Market Overview
| Study Period | 2021 - 2031 |
|---|---|
| Market Size (2026) | USD 19.15 Billion |
| Market Size (2031) | USD 24.73 Billion |
| Growth Rate (2026 - 2031) | 5.25% CAGR |
| Fastest Growing Market | Asia Pacific |
| Largest Market | Europe |
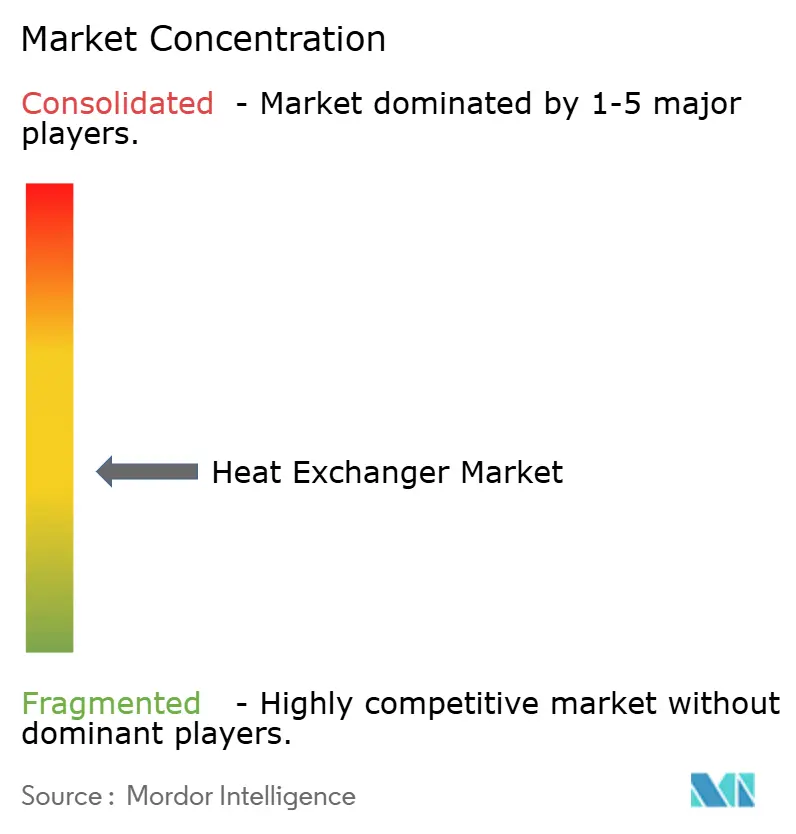
| Market Concentration | Medium |
Major Players *Disclaimer: Major Players sorted in no particular order Image © Mordor Intelligence. Reuse requires attribution under CC BY 4.0. | |

Heat Exchanger Market Analysis by Mordor Intelligence
The Heat Exchanger Market size is estimated at USD 19.15 billion in 2026, and is expected to reach USD 24.73 billion by 2031, at a CAGR of 5.25% during the forecast period (2026-2031).
Demand continues to rise because thermal-management equipment underpins refinery debottlenecking, hydrogen compression, LNG liquefaction, district-cooling networks, and hyperscale data-center liquid-cooling projects. Finned-tube air-cooled units are benefiting from water-scarcity mandates, while stainless-steel and exotic-alloy designs address corrosive media in desalination and sour-gas processing. Digital twin deployment, prefabricated skid modules, and printed-circuit technology shorten delivery cycles by up to 40%, a critical advantage as engineering, procurement, and construction (EPC) firms compress project schedules. Consolidation among top suppliers continues, illustrated by Alfa Laval’s purchase of Aalborg Industries and Chart Industries’ acquisition of Howden, each aiming to offer turnkey energy-transition packages.
Key Report Takeaways
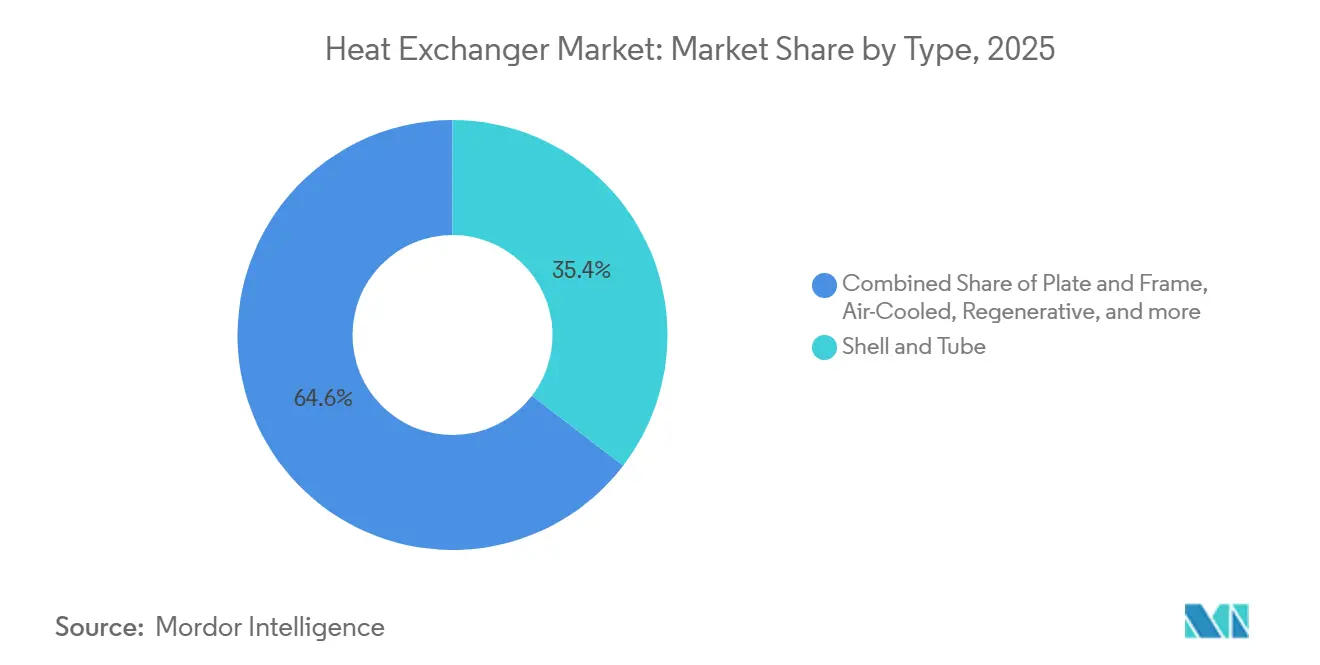
- By type, shell-and-tube units led with 35.4% revenue share in 2025, while air-cooled products are on track for a 6.6% CAGR through 2031.
- By material of construction, stainless steel held 30.5% of the heat exchanger market share in 2025, whereas exotic alloys are forecast to expand at a 7.0% CAGR to 2031.
- By flow arrangement, counter-current designs accounted for 65.1% share of the heat exchanger market size in 2025, and cross-flow designs are advancing at a 6.7% CAGR through 2031.
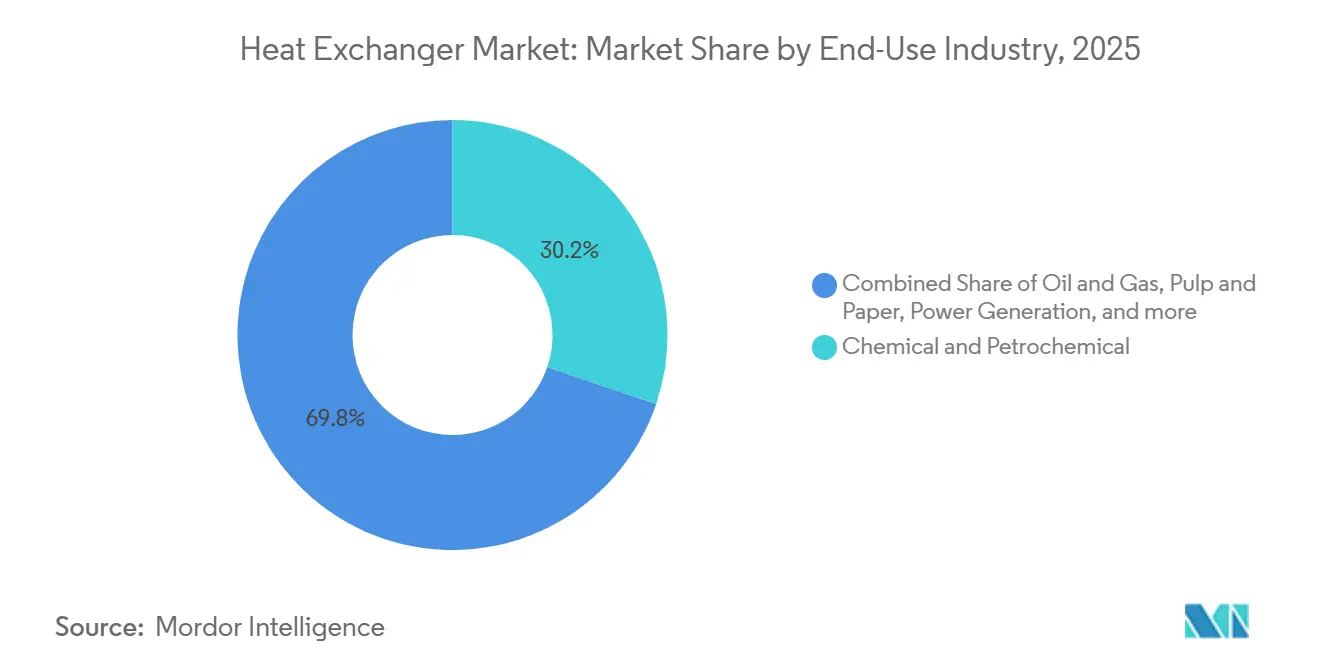
- By end-use industry, chemical and petrochemical operations captured a 30.2% share in 2025 and remain the fastest-growing user group at a 5.9% CAGR to 2031.
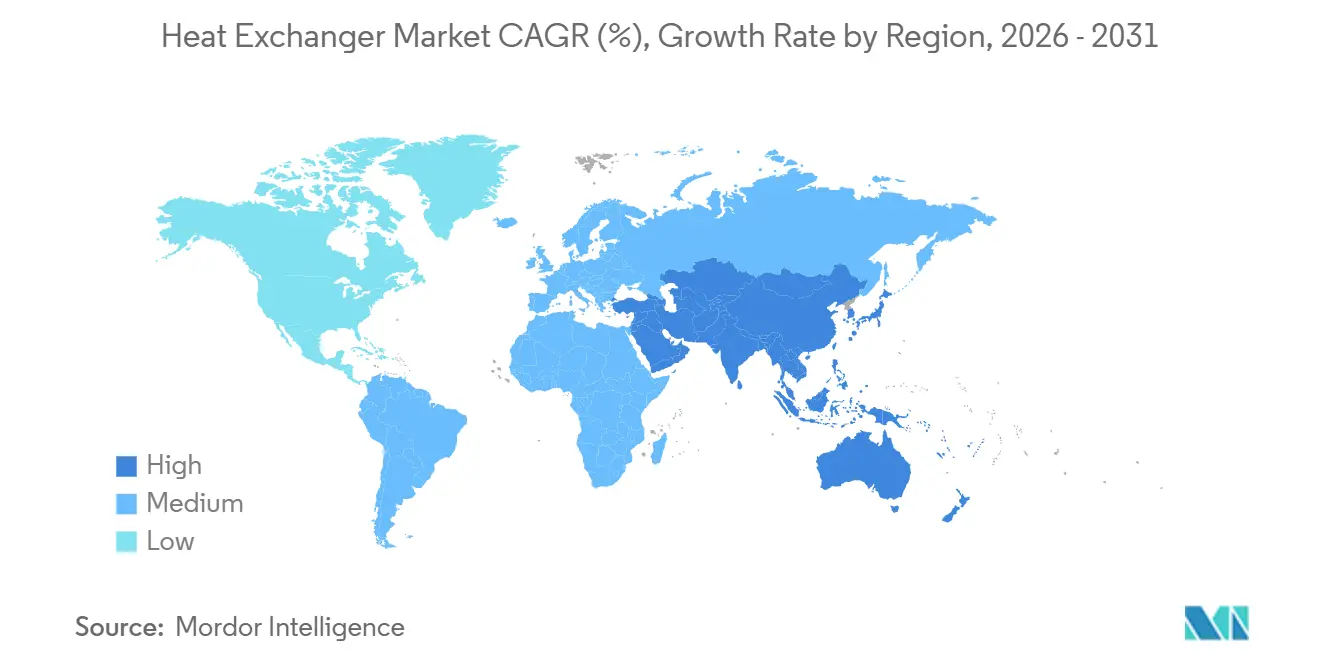
- By geography, Europe retained a 33.0% share in 2025; however, Asia-Pacific is forecast to post a 6.5% CAGR between 2026 and 2031.
Note: Market size and forecast figures in this report are generated using Mordor Intelligence’s proprietary estimation framework, updated with the latest available data and insights as of January 2026.
Global Heat Exchanger Market Trends and Insights
Drivers Impact Analysis*
| Driver | (~)% Impact on CAGR Forecast | Geographic Relevance | Impact Timeline |
|---|---|---|---|
| Surge in LNG liquefaction projects boosting demand for cryogenic exchangers | 1.2% | Global, with concentration in Middle East (Qatar), North America (US Gulf Coast), and Asia-Pacific (Australia) | Medium term (2-4 years) |
| District-cooling expansion in GCC & SE Asia driving plate-frame sales | 0.8% | Middle East (UAE, Saudi Arabia) and SE Asia (Singapore, Malaysia) | Short term (≤ 2 years) |
| Hydrogen pilot plants adopting printed-circuit exchangers for 200-bar service | 0.6% | Europe (Germany, Netherlands), North America (California, Texas), Asia-Pacific (Japan, South Korea) | Long term (≥ 4 years) |
| Mandatory EU industrial boiler upgrades spurring retrofit tube bundles | 0.7% | Europe, with spillover to UK and Turkey | Medium term (2-4 years) |
| SMR roll-out needing compact safety-class exchangers | 0.5% | North America (US, Canada), Europe (UK, Poland), Asia-Pacific (China) | Long term (≥ 4 years) |
| Data-center liquid cooling uptake accelerating micro-channel adoption | 0.9% | Global, with early concentration in North America hyperscale clusters and Asia-Pacific (Singapore, Hong Kong) | Short term (≤ 2 years) |
| Source: Mordor Intelligence | |||
Surge in LNG Liquefaction Projects Boosting Demand for Cryogenic Exchangers
Global LNG investments, North Field expansion in Qatar, Golden Pass and Plaquemines in the U.S., and Rio Grande in Texas, are driving a backlog worth more than USD 1.5 billion for spiral-wound and plate-fin cryogenic units. Equipment must meet API 660 and ASME Division 2 standards, handle minus-160 °C service, and ship within 16-month construction windows.[1]QatarEnergy, “North Field Expansion Project Update,” qatarenergy.qa
District-Cooling Expansion in GCC & Southeast Asia Driving Plate-Frame Sales
Empower’s Dubai network exceeded 241,000 refrigeration tons in 2025, while Marina Bay Singapore reached 203,000 refrigeration tons, both relying on gasketed-plate exchangers to trim electrical consumption below 0.6 kW per refrigeration ton. Titanium plates are now specified in geothermal loops with high dissolved solids, extending plate life to 25 years.
Hydrogen Pilot Plants Adopting Printed-Circuit Exchangers for 200-Bar Service
Alfa Laval’s HyBloc platform is rated to 1,250 bar and minus-253 °C, enabling rapid hydrogen precooling at fueling stations. The EU’s H2UpScale project and the U.S. Hydrogen Shot initiative both demonstrate how printed circuits raise electrolyzer efficiency from 65% to 75%.
Mandatory EU Industrial Boiler Upgrades Spurring Retrofit Tube Bundles
Revised EU emission limits compel nitrogen-oxide reductions to 100 mg/Nm³, triggering economizer retrofits. BASF invested EUR 1 billion to add condensing exchangers that lower natural-gas use by 15% and achieve sub-24-month paybacks.
Restraints Impact Analysis*
| Restraint | (~)% Impact on CAGR Forecast | Geographic Relevance | Impact Timeline |
|---|---|---|---|
| Nickel & titanium price volatility inflating corrosion-resistant units | -0.9% | Global, with acute impact in Asia-Pacific (China, India) and Europe due to high exotic-alloy adoption | Short term (≤ 2 years) |
| Bio-process fouling issues limiting adoption in biorefineries | -0.3% | North America (US Midwest), Europe (Germany, France), South America (Brazil) | Medium term (2-4 years) |
| EPC demand for 12-week lead-times curbing engineered-to-order designs | -0.5% | Global, with concentration in Middle East mega-projects and Asia-Pacific LNG terminals | Short term (≤ 2 years) |
| Direct air-cooling in power plants cannibalising air-cooled exchangers | -0.4% | Middle East, Africa, North America (Southwest US), Australia | Medium term (2-4 years) |
| Source: Mordor Intelligence | |||
Nickel and Titanium Price Volatility Inflating Corrosion-Resistant Units
Nickel traded with 30% intra-year swings in 2024, while titanium sponge experienced 15-20% shifts, lifting stainless-steel 304 plate costs 12-18% and extending exotic-alloy delivery to 36 weeks. EPC contracts lowered escalation pass-through thresholds from 5% to 3%, squeezing vendor margins.[2]London Metal Exchange, “Nickel Historical Pricing,” lme.com
Bio-Process Fouling Issues Limiting Adoption in Biorefineries
Cellulosic-ethanol pretreatment exchangers require cleaning every 72-96 hours because lignin precipitation cuts heat-transfer coefficients by up to 40%. Sugar caramelization in biodiesel loops forces caustic washes that shorten gasket life to three years.
*Our forecasts treat driver/restraint impacts as directional, not additive. The impact forecasts reflect baseline growth, mix effects, and variable interactions.
Segment Analysis
By Type: Modular LNG Skids Propel Air-Cooled Growth
Air-cooled units are projected to rise at a 6.6% CAGR, a full percentage point above the overall heat exchanger market growth, as desert refineries and LNG trains avoid water usage penalties. Shell-and-tube designs retained a 35.4% share in 2025 because ASME certifications remain indispensable for high-pressure petrochemical service. Plate-and-frame variants are climbing in district cooling, while printed-circuit equipment, though under 2% share, dominates hydrogen stations that operate above 200 bar.
Rear-door and micro-channel coils for data centers, together with prefabricated finned-tube modules for Middle East crackers, sustain robust ordering cycles. The heat exchanger market size for air-cooled units is anticipated to reach USD 9.7 billion by 2031, thanks to EPC preference for plug-and-play skids that shorten site work by 30%.


By Material of Construction: Exotic Alloys Surge on Hydrogen and Desalination
Exotic alloys will expand at a 7.0% CAGR as hydrogen compressors, offshore sour-gas facilities, and desalination plants require titanium Grade 2 or nickel alloys with high pitting resistance. Stainless steel still held a 30.5% share in 2025, sustained by food and beverage hygiene standards and duplex grades that handle moderate chlorides. Carbon-steel assemblies persist in low-corrosion duties but lose ground as decarbonization raises operating temperatures beyond 400 °C.
The heat exchanger market share of exotic alloys could climb to 18% by 2031 because Middle East desalination projects prefer titanium bundles with 30-year lifetimes. Nickel-based Hastelloy and Inconel are specified in European bio-refineries where feedstock acidities exceed pH 2, driving a premium of 3-4× over stainless units.[3]Saline Water Conversion Corporation, “Ras Al-Khair Desalination Plant,” swcc.gov.sa
By Flow Arrangement: Cross-Flow Gains in Compact Nuclear and Modular LNG
Counter-current flow retained a 65.1% share because its superior log-mean-temperature difference maximizes heat recovery in crude-preheat and feedwater applications. Cross-flow designs, however, are on track for a 6.7% CAGR as small modular reactors adopt passive safety systems that rely on vertical cross-flow bundles submerged in cooling pools.
The heat exchanger market size for cross-flow units could top USD 4.8 billion by 2031, supported by LNG plate-fin skids that fit ISO container frames and by data-center rear-door exchangers aligned with vertical airflow.
By End-Use Industry: Chemical and Petrochemical Sector Drives Growth
Chemical and petrochemical facilities accounted for 30.2% of revenue in 2025 and will grow at a 5.9% CAGR, underpinned by Asia-Pacific ethylene crackers and European renewable-diesel retrofits that target sub-1.0 steam-to-ethylene ratios. Oil and gas retained a roughly 24% share, anchored by LNG export terminals that deploy large cryogenic bundles.
Food and beverage operations use plate units that comply with 3-A sanitary standards, while nuclear projects and high-performance computing centers add specialty printed-circuit or micro-channel equipment. Together, these verticals keep the heat exchanger market diversified, cushioning it against single-sector downturns.
Geography Analysis
Asia-Pacific is set to post a 6.5% CAGR from 2026 to 2031, driven by Chinese 40 million tpa refinery projects, Indian HPCL Barmer upgrades, and ASEAN petrochemical investments. The heat exchanger market size for Asia-Pacific could reach USD 10.2 billion by 2031 as local EPC firms mandate air-cooled modules that avoid cooling-tower water penalties.
Europe maintained a 33.0% share in 2025 because of stringent energy-efficiency directives and district-cooling growth in Scandinavia. Retrofit programs, such as BASF Ludwigshafen, deploy condensing heat-recovery bundles that cut fuel 15%. EU Green Deal targets further bolster demand for stainless and exotic-alloy units.[4]European Commission, “Energy Efficiency Directive Updates,” europa.eu
North America contributes about 22% of revenue, with LNG terminals, SMR pilots, and data-center corridors in Virginia and Arizona pushing order books. The Middle East and Africa rely on air-cooled exchangers for gas processing and desalination, while South America focuses on refinery modernization in Brazil and Argentina to meet low-carbon fuel rules.

Competitive Landscape
Moderate fragmentation prevails: the top five players controlled roughly 35% of global turnover in 2025. Alfa Laval broadened its reach with Aalborg Industries, gaining marine boiler expertise and a captive tube supply that hedges nickel exposure. Chart Industries combined cryogenic exchangers with Howden compression, positioning itself for integrated hydrogen liquefaction skids. Danfoss, SPX Flow, and GEA re-aligned portfolios around plate-frame and industrial process units following divestitures.
Emerging entrants use additive manufacturing to build topology-optimized cores that deliver 25% higher heat-transfer rates and 40% weight savings. Digital twins and IoT predictive-maintenance suites create service revenue streams that raise switching costs. Certification barriers, notably ASME Section III for nuclear and ISO 19880-1 for hydrogen, favor incumbents with rigorous quality systems, thereby slowing new competition.
Regional fabricators compete on lead time and price, but risk margin erosion because EPC clients now require 12-week delivery. Vendors respond with standardized catalogs and stocked raw-material inventories, albeit at the expense of custom high-margin projects. Strategic partnerships, such as Kelvion-Modine data-center modules, illustrate how players chase growth niches.
Heat Exchanger Industry Leaders
Alfa Laval AB
Kelvion Holding GmbH
Danfoss A/S
GEA Group AG
SPX Flow Inc.
- *Disclaimer: Major Players sorted in no particular order

Recent Industry Developments
- October 2025: Shenshi has unveiled a PCHE-LNG heat exchanger tailored for the Fuel Gas Supply System (FGSS) sector. Boasting high compactness, efficient heat transfer, and superior anti-freezing properties, this product is ideally suited for offshore vessels with limited space.
- September 2025: Alfa Laval Aalborg Header-Coil A/S, a collaboration between heat exchanger giants Alfa Laval and Aalborg CSP, has unveiled its inaugural product in the realm of energy storage. This header-and-coil heat exchanger, tailored for large-scale thermal energy storage systems, boasts high thermal efficiency, a compact design, and exceptional reliability in cyclic operating conditions.
- July 2025: Southwest Research Institute (SwRI) has unveiled a megawatt-scale heat exchanger testing facility, specifically designed for aerospace and high-performance applications. This move bolsters validation and performance testing capabilities for next-generation heat exchangers.
- April 2025: Alfa Laval has unveiled its TS25 semi-welded heat exchanger, designed to enhance energy efficiency in sectors ranging from clean energy, such as hydrogen, to heavy processing. By merging durable welded designs with gasketed features, the TS25 offers superior sealing, a compact size, and high performance.


Research Methodology Framework and Report Scope
Market Definitions and Key Coverage
Our study defines the global heat exchanger market as all newly manufactured equipment that transfers heat between two stationary fluids through a solid wall, including shell-and-tube, plate-frame (gasketed, brazed, welded), air-cooled, regenerative, and printed-circuit units. According to Mordor Intelligence, we value shipments to process industries, power stations, HVAC installations, and district-energy schemes at factory-gate prices.
Scope exclusions include after-market bundles, vehicular micro-channel units made solely for passenger-car HVAC loops, and standalone boiler economizers, which lie outside this scope.
Segmentation Overview
- By Type
- Shell and Tube
- Plate and Frame (Gasketed Plate, Brazed Plate, Welded Plate)
- Air-Cooled (Fin and Tube, Plate-Fin, Micro-Channel)
- Regenerative (Rotary and Plate)
- Printed Circuit
- Others (Double-Pipe, Spiral, Coaxial)
- By Material of Construction
- Stainless Steel
- Carbon Steel
- Non-Ferrous (Copper, Aluminium)
- Exotic Alloys (Titanium, Nickel, Hastelloy)
- Polymers and Composites (PTFE, Graphite, Ceramic)
- By Flow Arrangement
- Counter-Current
- Parallel
- Cross-Flow
- Hybrid/Multi-Pass
- By End-Use Industry
- Oil and Gas
- Chemical and Petrochemical
- Power Generation (incl. Nuclear)
- Food and Beverage
- Pulp and Paper
- Water and Waste-water Treatment
- Other Industries (Automotive and Transportation, Metallurgy, Mining, HVACR, Pharmaceutical and Biotechnology)
- By Geography
- North America
- United States
- Canada
- Mexico
- Europe
- United Kingdom
- Germany
- France
- Italy
- Spain
- Nordic Countries
- Russia
- Rest of Europe
- Asia-Pacific
- China
- India
- Japan
- South Korea
- ASEAN Countries
- Australia
- Rest of Asia-Pacific
- South America
- Brazil
- Argentina
- Chile
- Colombia
- Rest of South America
- Middle East and Africa
- Saudi Arabia
- United Arab Emirates
- South Africa
- Egypt
- Rest of Middle East and Africa
- North America
Detailed Research Methodology and Data Validation
Primary Research
Mordor analysts interviewed plant engineers, EPC contractors, OEM sales managers, and regional distributors across North America, Europe, Asia-Pacific, and the Middle East. These conversations tested desk-derived ratios, clarified average exchanger surface area per installation, and captured early signals on alloy shifts and regulation-driven retrofits.
Desk Research
We start by mapping demand using open datasets from the International Energy Agency, Eurostat, the U.S. Energy Information Administration, UN Comtrade, and the European Chemical Council. Trade-body white papers, patent filings, and safety directives reveal technology shifts that alter effective surface-area demand. Company filings, prospectuses, and investor decks let our team align producer capacity with revenue splits, while D&B Hoovers and Dow Jones Factiva provide cross-checks on product mix.
Import-export shipment logs from Volza and global tender portals such as Tenders Info highlight upcoming capacity additions that feed near-term volume estimates. The sources listed are illustrative only; many additional public and proprietary references informed data collection, validation, and clarification.
Market-Sizing & Forecasting
We employ a top-down demand-pool model anchored on industrial gross fixed capital formation, new utility power capacity, district-cooling build-outs, and chemical output indices. We then corroborate results with selective bottom-up checks on vendor shipments and sampled average selling prices. Key variables like steel price indices, refiner utilization rates, plate-exchanger penetration, environmental efficiency mandates, and LNG liquefaction investments feed a multivariate regression with ARIMA overlays to project volumes through 2030. When supplier roll-ups under-report emerging-market volumes, ratio imputation against import values bridges the gap before final consolidation.
Data Validation & Update Cycle
Every draft passes variance screening, peer review, and a final recalibration against external signals. The model refreshes each year, with interim updates triggered by material events such as large petrochemical FIDs or sharp metal-price swings.
Why Mordor's Heat Exchanger Baseline Metrics Inspire Confidence
Published figures often diverge because some firms bundle aftermarket parts, micro-segment niches, or forward order books into headline values.
Key gap drivers include broader HVAC coverage, inclusion of replacement coils, differing currency bases, and longer refresh cycles used elsewhere, whereas Mordor reports only new-equipment revenue in constant 2025 dollars and revisits its model every twelve months.
Benchmark comparison
| Market Size | Anonymized source | Primary gap driver |
|---|---|---|
| USD 18.28 B (2025) | Mordor Intelligence | |
| USD 23.95 B (2025) | Global Consultancy A | Includes aftermarket & service contracts, wide HVAC component set |
| USD 19.72 B (2025) | Trade Journal B | Uses 2024 FX rates, counts automotive micro-channel exchangers |
| USD 20.16 B (2024) | Industry Association C | Relies on shipment-weight proxies, five-year refresh cadence |
Taken together, our disciplined scope selection, transparent variables, and annual update cadence give decision-makers a dependable baseline that remains traceable, testable, and ready for real-world planning.


Key Questions Answered in the Report
What is the projected value of the heat exchanger market by 2031?
The market is forecast to reach USD 24.73 billion by 2031.
Which product type is growing fastest?
Air-cooled heat exchangers are expected to expand at a 6.6% CAGR from 2026 to 2031.
Why are exotic alloys gaining share?
Hydrogen compression, desalination, and offshore sour-gas projects require corrosion-resistant titanium and nickel alloys.
Which region shows the highest growth outlook?
Asia-Pacific is forecast to post a 6.5% CAGR through 2031, supported by refinery and petrochemical mega-projects.
How are suppliers coping with compressed EPC lead times?
Vendors stock raw material, use digital twins, and offer standardized skid-mounted units to meet 12-week delivery windows.
What is driving printed-circuit heat exchanger adoption?
Hydrogen pilot plants and small modular reactors need compact, high-pressure units that printed-circuit technology provides.
Page last updated on:


