
Market Overview
| Study Period | 2021 - 2031 |
|---|---|
| Market Size (2026) | USD 13.97 Billion |
| Market Size (2031) | USD 18.38 Billion |
| Growth Rate (2026 - 2031) | 5.66 % |
| Fastest Growing Market | Asia Pacific |
| Largest Market | Asia Pacific |
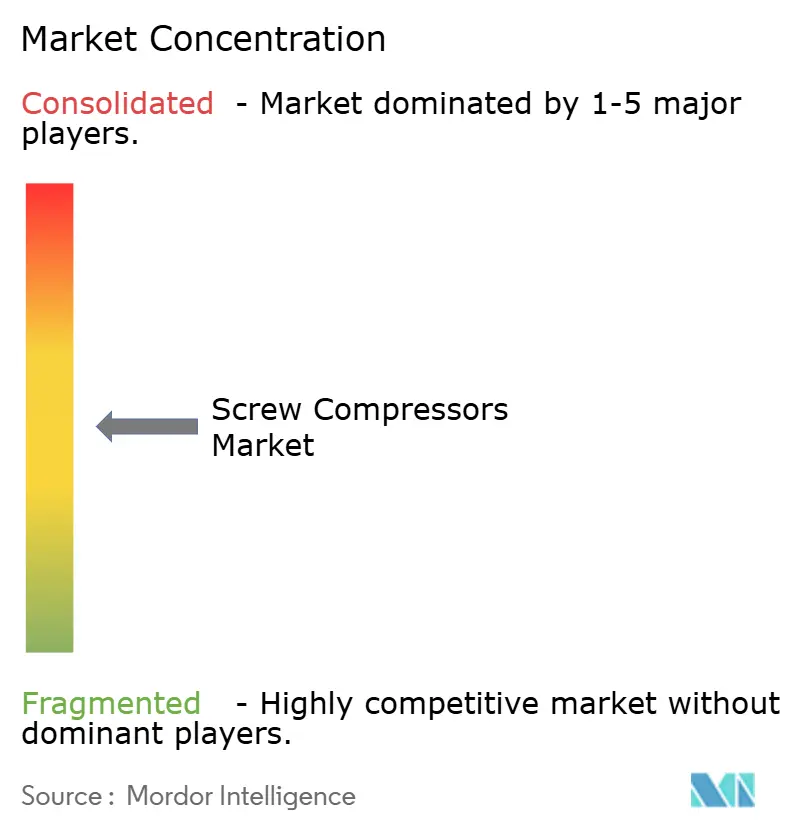
| Market Concentration | Medium |
Major Players *Disclaimer: Major Players sorted in no particular order Image © Mordor Intelligence. Reuse requires attribution under CC BY 4.0. | |
Screw Compressors Market Analysis by Mordor Intelligence
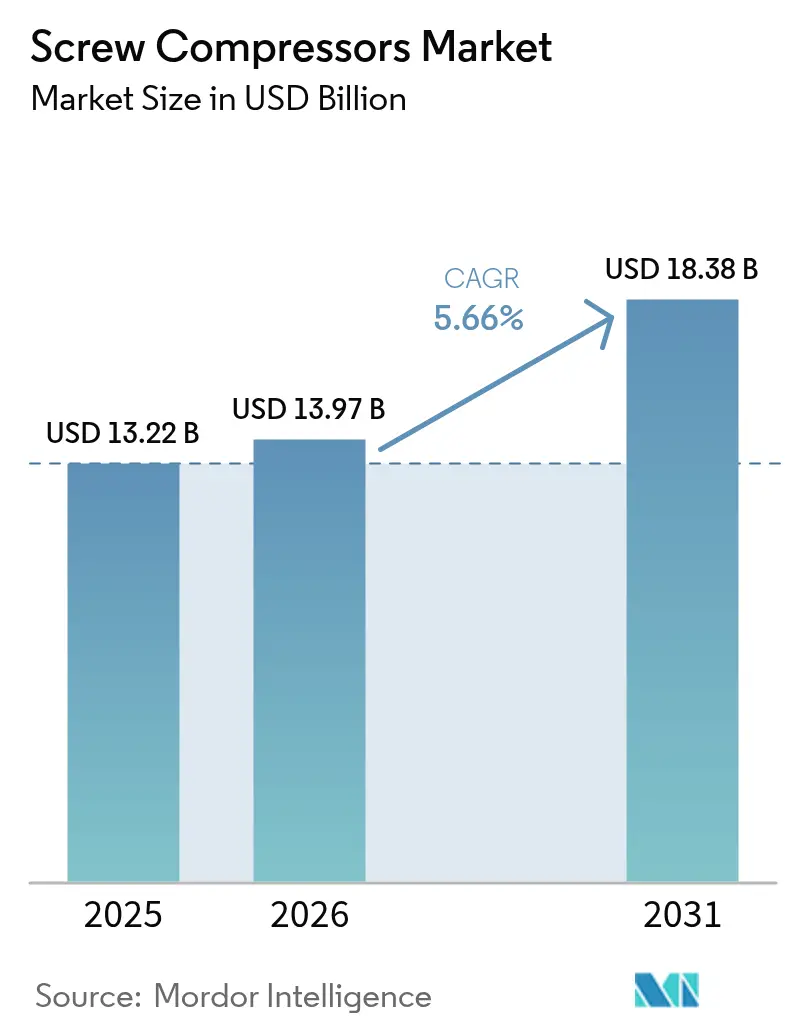
Screw Compressors Market size in 2026 is estimated at USD 13.97 billion, growing from 2025 value of USD 13.22 billion with 2031 projections showing USD 18.38 billion, growing at 5.66% CAGR over 2026-2031.
Robust capital expenditure in discrete and process industries, the roll-out of IE4/IE5 motor standards, and brownfield upgrades across oil-and-gas facilities are reinforcing equipment replacement cycles. Regulatory pressure around decarbonisation and workplace noise is accelerating technology upgrades, while Asia-Pacific’s manufacturing expansion underpins long-term demand for large installed horsepower bases. Competitive intensity continues to centre on energy-efficient designs, oil-free architectures, and digital monitoring capabilities that reduce unplanned downtime. The hydrogen infrastructure build-out and integration of heat-recovery-ready packages are emerging as niche but rapidly growing opportunities within the broader screw compressors market.
Key Report Takeaways
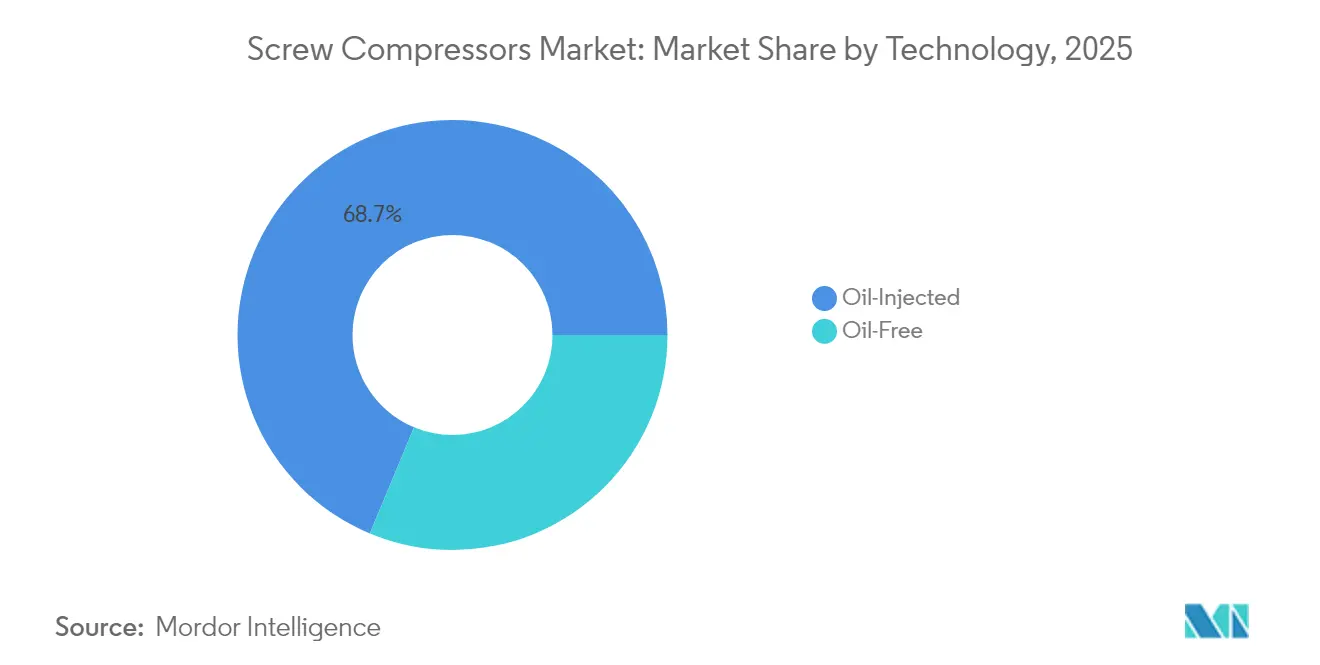
- By technology, oil-injected units held 68.72% of the screw compressors market share in 2025; oil-free systems are expanding at a 6.78% CAGR through 2031.
- By stage, single-stage machines accounted for 67.05% of the screw compressors market size in 2025; multi-stage configurations are projected to grow at a 6.31% CAGR to 2031.
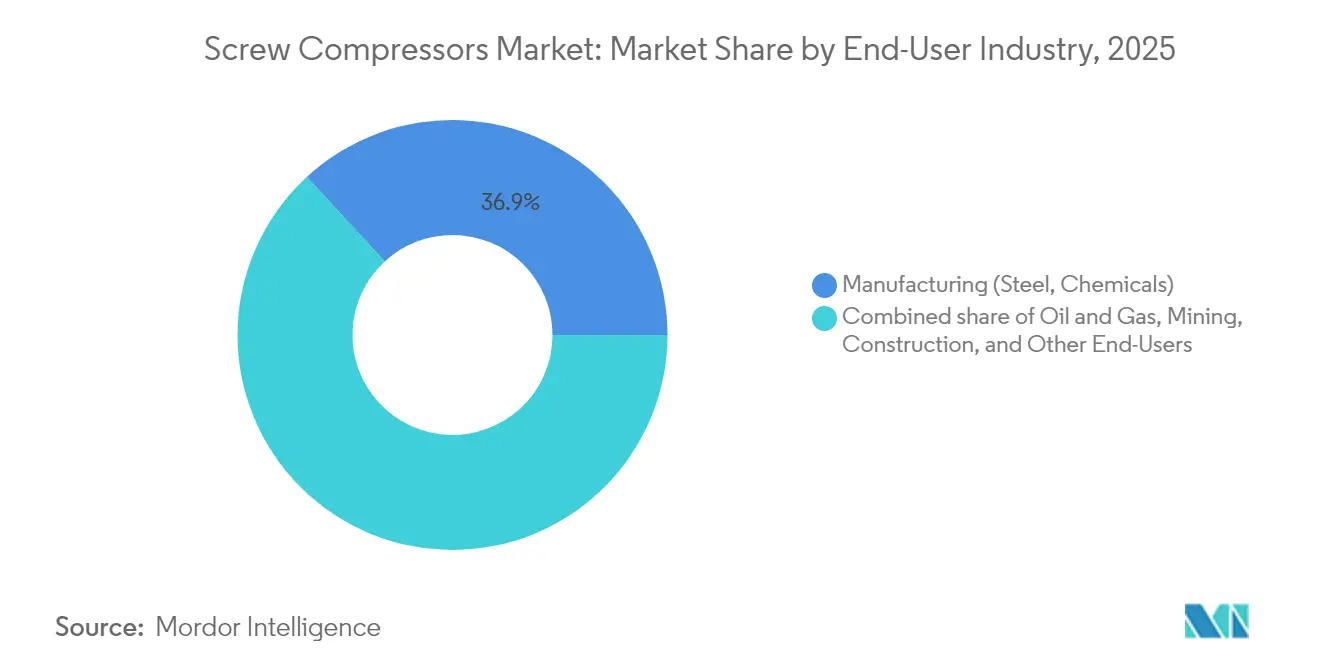
- By end-user industry, manufacturing represented a 36.85% revenue share of the screw compressors market size in 2025, while the oil and gas sector is forecast to post the fastest growth, at a 6.58% CAGR, through 2031.
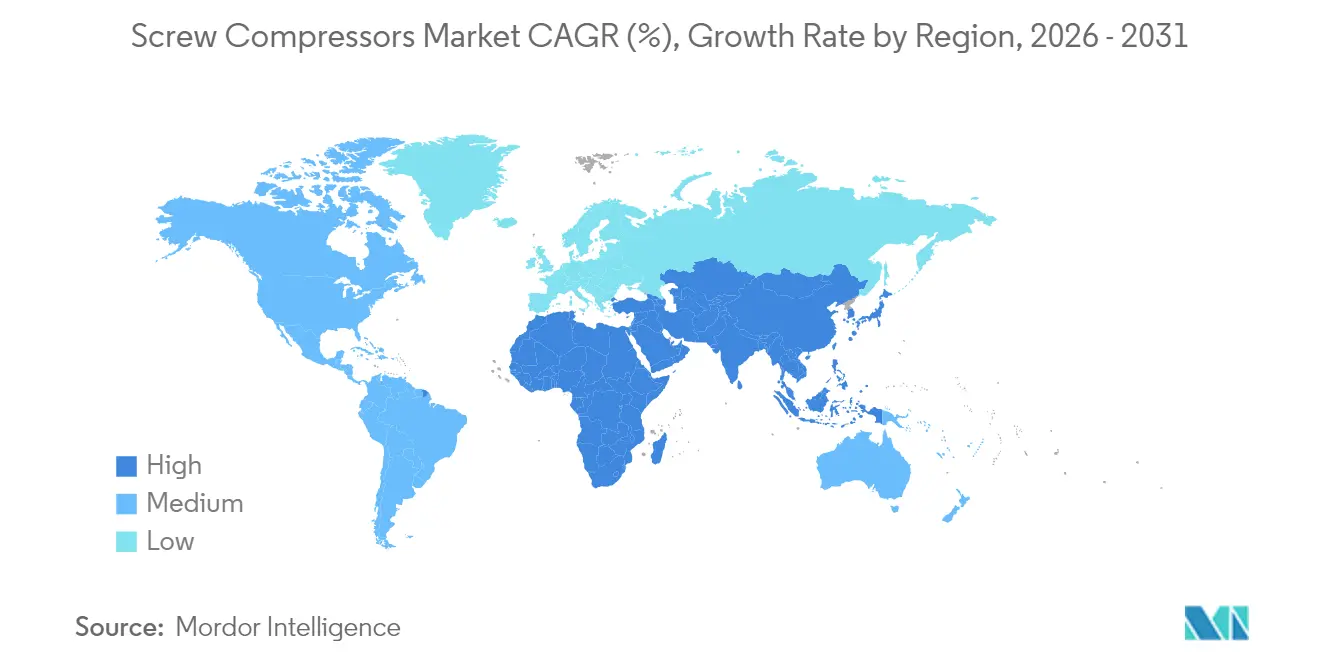
- By geography, the Asia-Pacific captured 41.12% of the screw compressors market share in 2025 and is expected to register the highest CAGR of 6.12% during the forecast period.
- Atlas Copco and Ingersoll Rand, together, commanded a 30% share of the screw compressor market in 2024, underpinning a moderate consolidation trend.
Note: Market size and forecast figures in this report are generated using Mordor Intelligence’s proprietary estimation framework, updated with the latest available data and insights as of 2026.
Market Trends and Insights
Drivers Impact Analysis of Screw Compressors Market*
| Driver | (~) % Impact on CAGR Forecast | Geographic Relevance | Impact Timeline |
|---|---|---|---|
| Industrial automation & cap-ex boom in discrete and process industries | +1.2% | Global, with APAC leading adoption | Medium term (2-4 years) |
| Energy-efficiency mandates & IE4/IE5 motor retrofits | +0.9% | North America & EU primary, APAC following | Short term (≤ 2 years) |
| Upstream & midstream oil-&-gas brownfield expansions | +0.8% | North America, Middle East, with spillover to APAC | Long term (≥ 4 years) |
| Hygiene-critical F&B & pharma demand for oil-free units | +0.7% | Global, concentrated in developed markets | Medium term (2-4 years) |
| Hydrogen refueling network roll-out needs high-pressure oil-free screws | +0.6% | EU, North America, Japan, Korea | Long term (≥ 4 years) |
| Heat-recovery-ready packages for industrial decarbonisation | +0.5% | EU primary, expanding to North America | Medium term (2-4 years) |
| Source: Mordor Intelligence | |||
Industrial Automation & Cap-Ex Boom in Discrete and Process Industries
Industrial automation projects are raising baseline demand for compressed air as factories retrofit lines with pneumatic actuators, pick-and-place robots, and vision-inspection stations that require stable pressure delivery. Rising labour costs and reshoring trends are accelerating plant upgrades that favour continuous-duty screw compressors with built-in variable-speed drives for load matching. Automotive assembly, food packaging, and fine chemicals are upgrading to networked compressor rooms that embed sensor-based condition monitoring for predictive maintenance. Vendors able to integrate controls with factory supervisory systems are gaining share because plant managers prioritise uptime and energy dashboards. This secular automation push anchors multi-year order visibility for the screw compressors market
Energy-Efficiency Mandates & IE4/IE5 Motor Retrofits
Mandatory minimum-performance requirements are forcing operators to replace legacy rotary units that fail to meet the EU 2019/1781 isentropic thresholds and the United States' 2025 rotary compressor rule, which covers 35–1,250 cfm models.[1]European Commission, “Regulation (EU) 2019/1781 Ecodesign Requirements for Electric Motors,” europa.eu IE4/IE5 motor retrofits unlock up to 10% energy savings at the system level and qualify for utility rebates, lowering payback periods to less than three years.[2]U.S. Department of Energy, “Energy Conservation Standards for Rotary Air Compressors,” energy.govCalifornia’s state code shows facility operators can save USD 2,700–9,200 per compressor through lower electricity bills. The regulatory hurdle disadvantages smaller manufacturers that lack advanced motor platforms, nudging market share toward incumbents with proprietary high-efficiency rotors and premium winding designs.
Upstream & Midstream Oil-&-Gas Brownfield Expansions
Operators expanding existing gathering stations, NGL recovery units, and transmission pipelines are specifying oil-injected screw compressors that tolerate variable gas compositions and sand ingress. Project schedules often prefer skid-mounted packages that drop into constrained footprints and integrate with legacy control systems. Digital twin models enable maintenance teams to optimise run hours and intervene before surge conditions arise, thereby extending the mean time between overhauls. Midstream contractors value screw technology for its high volumetric efficiency across a broad range of pressure ratios, pushing the screw compressor market deeper into gas-processing infrastructure. OEMs offering global service contracts and fast-track rotor repair are capturing repeat orders within the brownfield upgrade cycle.
Hygiene-Critical F&B & Pharma Demand for Oil-Free Units
Stringent contamination thresholds in aseptic bottling, lyophilisation, and clean-room tablet coating prohibit oil carry-over, prompting processors to transition to Class 0 oil-free screws. GEA’s natural-refrigerant compressor line and closed-loop heat-reuse modules show how manufacturers are pairing sustainability with product purity.[3]GEA Group, “Sustainable Refrigeration and Energy-Reuse Systems,” gea.com Hitachi Global Air Power added the 280–450 kW DS-Series to address higher horsepower needs in beverage canning and dairy dehydration lines.[4]Sullair LLC, “DS-Series Oil-Free Air Compressors Product Launch,” sullair.com Pharmaceutical good-manufacturing-practice audits increasingly cite compressed-air quality certificates, creating a moat around suppliers with validated oil-free designs. The premium price uplift sustains margins even as unit volumes scale, reinforcing long-term growth for the screw compressors market.
Restraints Impact Analysis of Screw Compressors Market*
| Restraint | (~) % Impact on CAGR Forecast | Geographic Relevance | Impact Timeline |
|---|---|---|---|
| Raw-material cost volatility (steel, copper, rare-earth magnets) | -0.8% | Global, with emerging markets most affected | Short term (≤ 2 years) |
| Substitution risk from centrifugal & scroll compressors in ≥2 MW range | -0.6% | North America & EU industrial segments | Medium term (2-4 years) |
| Pending PFAS lubricant ban jeopardises current oil formulations | -0.5% | Global, with EU and North America leading | Long term (≥ 4 years) |
| Tightening EU noise & workplace-exposure directives | -0.4% | EU primary, with regulatory spillover expected | Medium term (2-4 years) |
| Source: Mordor Intelligence | |||
Raw-Material Cost Volatility (Steel, Copper, Rare-Earth Magnets)
Steel, copper, and NdFeB magnet prices have fluctuated by more than 25% over the past eight quarters, increasing bill-of-materials exposure to exceed 45% for certain frame sizes. Smaller OEMs with limited hedging programs face a working-capital strain and thin gross margins when quarterly surcharges cannot be passed through to contracts. Copper drives double pain: winding packs for IE5 motors and plate-fin heat exchangers. Elevated Nd pricing complicates the adoption of permanent-magnet motors, delaying the introduction of premium-efficiency variants. Producers with captive foundries and long-term offtake agreements can offset volatility, but tier-2 assemblers risk delivery delays, which can dent credibility and slow the adoption of new models in the screw compressors market.
Substitution Risk from Centrifugal & Scroll Compressors in ≥ 2 MW Range
Process owners evaluating new build compressor rooms above 2 MW are increasingly attracted to three-stage centrifugal units that deliver higher isothermal efficiency at steady loads. Scroll machines add pressure in laboratories and small food plants where noise caps fall below 60 dB(A). Atlas Copco demonstrates that scrolls excel in clean indoor environments, eroding screws’ share of boutique oil-free niches. As rival technologies stretch their operating envelopes through new impeller coatings and inverter packages, screws risk displacement in select duty points. Continuous R&D in asymmetric rotors and water-injected cooling seeks to defend the screws’ position.
*Our forecasts treat driver/restraint impacts as directional, not additive. The impact forecasts reflect baseline growth, mix effects, and variable interactions.
Screw Compressors Market Segment Analysis
By Technology:
Oil-Free Systems Gain TractionOil-injected designs retained a 68.72% market share over screw compressors in 2025, thanks to favourable acquisition costs and rugged duty-cycle tolerance. The oil-free cohort is expanding at a 6.78% CAGR, driven by clean-label food processing, biosimilar drug production, and hydrogen refueling needs, thereby narrowing the lifecycle-cost gap. The screw compressors market size for oil-free lines is projected to reach USD 6,175 million by 2031, buoyed by Class 0 certifications and utility incentives for water-injected variants. OEMs are deploying precision-ground stainless steel rotors and dry air-end seals to extend service life beyond 24,000 hours, thereby reducing downtime premiums.
Manufacturers are also pairing oil-free air ends with heat-recovery modules that reclaim up to 80% of input energy as usable hot water, advancing the decarbonization agenda. Corporates with science-based targets prefer oil-free solutions because they eliminate downstream filtration, reducing power draw by 3–4%. The screw compressor market share differential will continue to tilt toward oil-free models as regulatory regimes tighten lubricant carryover limits in beverage and semiconductor fabs. Vendors with dual portfolio breadth can cross-sell oil-injected systems into heavy industry while upselling oil-free systems into clean zones, thereby defending their market share.



By Stage:
Multi-Stage Configurations AdvanceSingle-stage machines captured 67.05% of the screw compressor market size in 2025, filling mid-pressure slots in woodworking, textile spinning, and instrumentation air applications. Multi-stage units, however, are clocking a 6.31% CAGR, as petrochemical crackers, PET bottle blowing, and rail braking systems demand pressures exceeding 15 bar. Gains are amplified by built-in intercoolers that slash specific power at high ratios, improving site energy metrics.
Customers selecting multi-stage architectures often finance projects through energy-performance contracts that hinge on kWh savings, enhancing value perception. When integrated with variable-speed drives, two-stage packages maintain a differential pressure of ±0.1 bar, which is critical for product quality in extruded plastics and SMT pick-and-place lines. The screw compressors market share for multi-stage could climb to 37.40% by 2031 as cost curves fall with higher rotor manufacturing volumes.
By End-User Industry:
Oil & Gas Leads GrowthManufacturing dominated the user mix, with a 36.85% screw compressor market share in 2025, spanning steel, cement, and tire plants that rely on instrument air. Brownfield oil-and-gas revamps are forecast to yield the fastest 6.58% CAGR to 2031, as LNG terminals, booster stations, and flare recovery skids require high-pressure packages. Integrated compressors with API 619 compliance and NACE-approved metallurgy are winning bids where sour gas content increases.
Construction contractors remain significant buyers of portable diesel screws for road paving and shot-creting, although electrified job-site regulations in the EU may limit future growth. Mining fleets require high-altitude derate kits and heavy-duty filtration to handle abrasive dust, a niche served by ruggedised two-stage assemblies. The screw compressor market size will increasingly reflect specialty skids in carbon capture, hydrogen blending, and green ammonia synthesis plants as energy transition capital expenditure scales.
Geography Analysis
APAC Screw Compressors Market
The Asia-Pacific region held a commanding 41.12% share of the screw compressors market in 2025, driven by relentless factory construction across China, India, and ASEAN. The regional 6.12% CAGR to 2031 benefits from government infrastructure outlays, localisation of automotive drivetrains, and surging electronics output. Beijing’s Made-in-China roadmap incentivises CNC machining cells and SMT lines that rely heavily on compressed air networks, pushing local OEMs to license efficient screw profiles. India’s PLI schemes for APIs and processed foods are driving oil-free purchases in sterile production zones, while state rail electrification is adding fixed installations along carriage depots.
North America Screw Compressors Market
North America represents a replacement-driven landscape, where the Department of Energy’s 2025 efficiency rule is moving the installed base toward premium-efficiency frame sizes. Brownfield expansions at gas-processing hubs in Texas and Pennsylvania require high-horsepower skids with Class 1 Div 2 certification. Mexico’s fast-rising auto and electronics clusters attract mid-pressure units for plastics moulding and PCB depaneling. Vendors with Mexican assembly plants utilize the USMCA duty-free corridor to reduce lead times and manage landed costs in the broader screw compressors market.
Europe Screw Compressors Market
Europe’s stringent noise, ecodesign, and PFAS policies create a premiumisation effect that favours high-end offerings with enclosed acoustic canopies and validated green lubricants. Germany’s process industries are adopting multi-stage heat-recovery packages to decarbonize steam loops, while Eastern European contract manufacturers are seeking lower-priced but compliant single-stage screws. UK pharma clusters remain key buyers of oil-free machines due to MHRA regulatory oversight. The overall European environment is tilting toward integrated audits, where compressed air, cooling water, and condensate management are procured as a single system, thereby deepening vendor relationships.

Regulatory Landscape
Energy-efficiency regulation is a key compliance driver for screw compressors, particularly in the United States and Europe, where minimum performance requirements and test methods influence product design and certification. In the United States, the Department of Energy (DOE) energy conservation standards for commercial and industrial air compressors apply to covered equipment manufactured on or after January 10, 2025, including rotary lubricated air-cooled and liquid-cooled compressor classes under 10 CFR 431.345. Efficiency is determined using DOE-prescribed test procedures, including package isentropic efficiency metrics.
In Europe, Ecodesign-linked efficiency upgrades, together with the roll-out of IE4/IE5 motor adoption referenced in market dynamics, combine with tightening workplace noise rules and ongoing chemical policy scrutiny, including discussions around PFAS-related lubricant restrictions. This is pushing redesign work toward lower-loss air ends, higher-efficiency motors, and improved acoustic enclosures. The net result is that certified and documented performance at both full-load and part-load operating points carries more weight, which benefits OEMs with established test capability, validation documentation, and broader compliance portfolios.
Value Chain Analysis
The screw compressor value chain begins with metals and engineered components, then moves into precision manufacturing of air ends, including interlocking screw rotors. Motor and drive selection, such as permanent-magnet and high-efficiency motor platforms, feed into package design covering coolers, separators, filtration and drying, followed by assembly and factory testing. Rotor manufacturing and machining accuracy remain differentiators, with CNC machining and grinding used to support yield, efficiency, and noise outcomes, while the bill of materials stays exposed to steel, copper, and magnet inputs.
Downstream, OEMs sell via direct accounts, authorized distributors, and service partners. Lifecycle service, including spares, overhauls, controls upgrades, and monitoring subscriptions, acts as a recurring revenue layer. In specialized applications, independent packagers also play a role, where providers such as Howden (Chart Industries) supply bare-shaft oil-injected screw compressors integrated into localized packages for gas and refrigeration duties, helping manage regional certification requirements and shorten delivery cycles.
Competitive Landscape
Atlas Copco, Ingersoll Rand, Hitachi Global Air Power, Kaeser, Sullair, and Gardner Denver comprise the top tier, collectively holding nearly 60% of the 2024 revenue. Atlas Copco’s USD 465 million purchase of Kyungwon Machinery widened its Korean footprint and added oil-free water-injected intellectual property. Ingersoll Rand completed 14 tuck-in acquisitions in 2024, boosting life-sciences filtration and extending its addressable market by USD 12 billion. Both leaders emphasise cloud-connected condition monitoring, bundling annual data analytics subscriptions that deepen switching costs.
Mid-tier challengers focus on application specialisation: Kobelco dominates high-pressure hydrogen skids, Elgi leverages low total cost of ownership in textile clusters, while Fusheng scales aggressively inside China’s provincial manufacturing hubs. New entrants such as H2-compressor start-ups collaborate with gas-station integrators but face capital-intensive certification cycles. Technology differentiation centers on patented asymmetric rotor profiles, nano-coated air ends, and predictive maintenance algorithms that reduce unplanned shutdowns by up to 30%.
OEMs are increasingly positioning themselves as energy-service providers, offering heat-recovery integration and compressed-air-as-a-service contracts with uptime guarantees. Global players bundle financing, relay asset health through cloud dashboards, and maintain field-service fleets that complete repairs within 12 hours, reinforcing customer lock-in. The screw compressors market, therefore, shows a trend toward ecosystem playbooks rather than pure equipment sales.
Screw Compressors Industry Leaders
Atlas Copco AB
Ingersoll-Rand PLC
Kaeser Kompressoren SE
Hitachi Industrial Equipment Systems
Sullair LLC
- *Disclaimer: Major Players sorted in no particular order
Screw Compressors Market Companies Covered in this Report
- Aerzener Maschinenfabrik GmbH
- Atlas Copco AB
- Bauer Kompressoren GmbH
- Daikin Industries Ltd
- Emerson Electric Co
- Hitachi Industrial Equipment Systems
- Ingersoll Rand PLC
- Mitsubishi Electric Corporation
- Kobe Steel Ltd
- Kaeser Kompressoren SE
- Gardner Denver Industries LLC
- Sullair LLC
- Siemens Energy AG
- Elgi Equipments Ltd
- Doosan Infracore Co Ltd
- BOGE Kompressoren GmbH
- Kaishan Compressor USA & China
- Quincy Compressor LLC
- Hanbell Precise Machinery Co Ltd
- Baker Hughes (Compression Systems)

Market Opportunities and Future Outlook
Product compliance and decarbonization-linked upgrades are creating opportunities across lower-emissions operation, lubricant chemistry, and higher-efficiency package architectures. In March 2026, Hitachi Industrial Equipment Systems introduced GREEN SCREW OIL, a plant-based lubricant for oil-flooded screw compressors positioned around lifecycle CO2 reduction versus conventional synthetic oils. This aligns with customer programs targeting lower scope emissions while preserving the oil-injected economics. The same direction ties into the report's focus on heat-recovery-ready packages and energy-efficiency mandates, which pull demand toward integrated system offerings, including VSDs, high-efficiency motors, and optimized air ends, rather than stand-alone compressor units.
Oil-free and high-purity applications continue to expand where contamination risk, auditability, and compressed-air quality certificates drive procurement choices, including food and beverage and life sciences. In May 2026, Ingersoll Rand announced a multiyear strategic partnership with Garrett Motion to develop next-generation oil-free compressor technology for these verticals. For OEMs, this supports a development path that combines oil-free air ends with controls, monitoring, and validation support. Capacity additions that localize oil-free manufacturing and testing, such as Kaishan Compressor USA's September 2025 Loxley, Alabama expansion, also point to an execution focus on lead-time reduction and application-specific packaging for North American buyers facing tighter efficiency and operating-cost scrutiny.
Recent Industry Developments in Screw Compressors Market
- May 2026: Ingersoll Rand announced a multiyear strategic partnership with Garrett Motion to develop next-generation oil-free air compressor technology targeting food and beverage and life sciences applications. The collaboration focuses on accelerating oil-free innovation where purity, energy efficiency, and lifecycle cost are procurement priorities, reinforcing competitive differentiation beyond conventional hardware refresh cycles.
- April 2025: Ingersoll Rand introduced its next-generation R-Series 90-160 kW rotary screw air compressors in fixed-speed and variable-speed configurations. The release broadened the replacement market for upgraded compressor rooms seeking improved part-load efficiency and tighter control integration, supporting OEM moves toward higher-efficiency packaged solutions.
- October 2024: Ingersoll Rand completed acquisitions of APSCO, Blutek, and UT Pumps for a combined USD 135 million. While not limited to compressors, the additions expanded the company's industrial portfolio in adjacent fluid-handling and application domains serving food and beverage and pharmaceutical customers, supporting cross-selling and bundled system offerings for compressed-air-intensive operations.


Screw Compressors Market Report Scope and Research Methodology
Market Definition and Coverage
For this methodology, the screw compressors market covers revenues generated from rotary screw compressor units sold for industrial and commercial compressed air and gas compression needs, counted at the factory gate and then trended by region in USD.
Scope exclusions: We exclude non-screw compressor technologies (such as reciprocating and centrifugal), along with standalone aftermarket services and rentals when they are not bundled with a new unit sale.
Segments Covered in This Report
- By Technology
- Oil-Injected
- Oil-Free
- By Stage
- Single-Stage
- Multi-Stage
- End-User Industry
- Manufacturing (Steel, Chemicals)
- Oil and Gas
- Mining
- Construction
- Other End-User Industries
- Geography
- North America
- United States
- Canada
- Mexico
- Europe
- Germany
- United Kingdom
- France
- Italy
- Russia
- Rest of Europe
- Asia-Pacific
- China
- India
- Japan
- South Korea
- ASEAN Countries
- Rest of Asia-Pacific
- South America
- Brazil
- Argentina
- Rest of South America
- Middle-East and Africa
- Saudi Arabia
- United Arab Emirates
- South Africa
- Egypt
- Rest of Middle East and Africa
- North America
Data Sources, Market Sizing, and Validation
Desk Research
Desk research is used to set the fact base for demand creation and equipment adoption across key end-use industries, and then to shape realistic unit and price assumptions. We referred to public sources such as the US Energy Information Administration for energy and industrial activity signals, the US Bureau of Labor Statistics for production and pricing indicators, UN Comtrade for trade flow direction checks, and the International Energy Agency for macro energy and industry outlook.
On the supply side, company annual reports, investor presentations, and regulatory filings were reviewed to understand product mix and regional exposure. We then checked association websites and reputable trade press to confirm application trends. Where needed, we also used paid subscriptions for company financials and news intelligence, and for patent database checks that help validate technology shifts, for example oil-free adoption. These desk sources are not exhaustive, and other public references were used for data collection, validation, and research clarification.
Primary Interviews and Surveys
Primary work was done through expert interviews and structured surveys with compressor OEMs, component suppliers, distributors, and end users across manufacturing, oil and gas, mining, and construction. We focused on major buying regions to confirm utilization patterns, replacement cycles, and typical price bands, which helped close gaps that desk sources often leave open. Feedback was also used to sanity check how oil-injected versus oil-free demand is behaving under different energy-cost conditions and regulation settings.
Distribution of primary research fieldwork respondents
| Company type | Respondent position | Region |
|---|---|---|
| Top tier: 36% | CXOs: 14% | APAC: 46% |
| Mid tier: 43% | Functional/Unit leaders: 41% | EMEA: 31% |
| Smaller Players: 21% | Managers: 45% | Americas: 23% |
Market-Sizing & Forecasting
Sizing starts with a top-down build where industrial production, capital spending direction in key end users, and compressor penetration by application are used to reconstruct the addressable demand pool by region. Those totals are then corroborated with selective bottom-up approximations, mainly sampled unit shipments multiplied by typical ASP bands, distributor channel checks, and supplier revenue cross-checks, before final totals are adjusted.
A few inputs that mattered most for this market were the split between oil-injected and oil-free installations, the share of single-stage versus multi-stage units in heavy-duty use, typical replacement and maintenance-driven purchasing cycles, energy cost sensitivity that affects upgrade timing, and regional manufacturing output signals. Where bottom-up inputs were incomplete, we filled gaps by using anchored price ranges and adoption ratios that were validated in interviews. We then re-tested these assumptions in the model so the implied volumes stayed realistic.
For forecasting, we relied mainly on scenario analysis supported by a light multivariate regression layer, where variables like industrial output outlook, energy prices, and end-user capex intent were used to guide the base case. The final forecast path was discussed with primary respondents so growth rates align with what buyers and sellers plan for in the next cycle.
Data Validation & Update Cycle
Validation is done by checking whether modeled demand aligns with independent signals, such as regional manufacturing activity, trade movements for compressor equipment, and stated capacity expansion plans in key industries. When outputs look off versus these signals, the assumptions are revisited, and follow-up calls are triggered with relevant respondents to understand what changed.
Before sign-off, the work goes through multiple analyst review steps that include variance checks across regions and consistency checks across technology types and end users. Reports are refreshed annually, and interim updates are made when material events occur, such as sharp energy price shifts or major industrial policy changes. Just before delivery, a final review pass is completed so clients receive the most current view that the model can support.
Mordor Intelligence's Screw Compressors Market Size Compared With Other Published Estimates
Published market sizes for screw compressors often do not match because the boundaries are set differently and the price logic is handled in different ways. Even when the same end markets are discussed, the included technologies, base year selection, and currency timing can move the final number.
By tracking technology splits and regional end-user demand indicators, and by refreshing the price and replacement-cycle assumptions through interviews, Mordor Intelligence keeps the estimate focused on screw compressor unit revenues rather than mixing in adjacent compressor types or unbundled service values.
Benchmark comparison
| Source | Market Size | Gaps in Research Methodology |
|---|---|---|
| Mordor Intelligence | USD 13.97 B (2026) | |
| Global Consultancy A | USD 12.03 B (2024) | Uses an earlier base year and a different forecast window, and it appears to apply broader segment cuts (such as portable and capacity bands) that can shift the average selling price mix versus a technology-led build. |
| Industry Publisher B | USD 13.01 B (2024) | Anchors sizing on a single base year and may rely more on stated growth rates across industries, which can inflate totals if replacement cycles and oil-free adoption are not re-validated region by region. |
The spread in the table is mostly explained by year selection and what gets counted around the core unit revenue pool, followed by differences in how ASP progression is applied. When scope lines are kept tight and the key demand drivers are checked against real buying patterns, the market size becomes easier to trace and repeat across updates.


Key Questions Answered in the Report
What is the current size of the screw compressors market?
The screw compressors market size was USD 13.97 billion in 2026 and is projected to reach USD 18.38 billion by 2031.
Which technology segment is growing fastest?
Oil-free screw compressors are registering a 6.78% CAGR through 2031 as food, beverage and pharmaceutical processors eliminate contamination risk.
Why are multi-stage screw compressors gaining popularity?
Demand for pressures above 15 bar in PET blowing, hydrogen and rail braking systems is driving a 6.31% CAGR for multi-stage configurations due to superior energy efficiency.
How do energy-efficiency regulations affect compressor purchases?
EU and U.S. minimum efficiency rules effective 2025 force operators to replace older units with IE4/IE5 motor platforms, expanding sales for high-efficiency screw compressors.
Which region contributes the most revenue?
Asia-Pacific maintains 41.12% of global revenue and posts the fastest 6.12% CAGR thanks to robust manufacturing and infrastructure investment.
What are the main challenges facing manufacturers?
Raw-material price swings, substitution by centrifugal/scroll technologies, tightening noise regulations and upcoming PFAS lubricant bans pose key headwinds.
Page last updated on:


 Your data is secure and never sold or shared.


