Electroretinogram Market Size and Share
Market Overview
| Study Period | 2020 - 2031 |
|---|---|
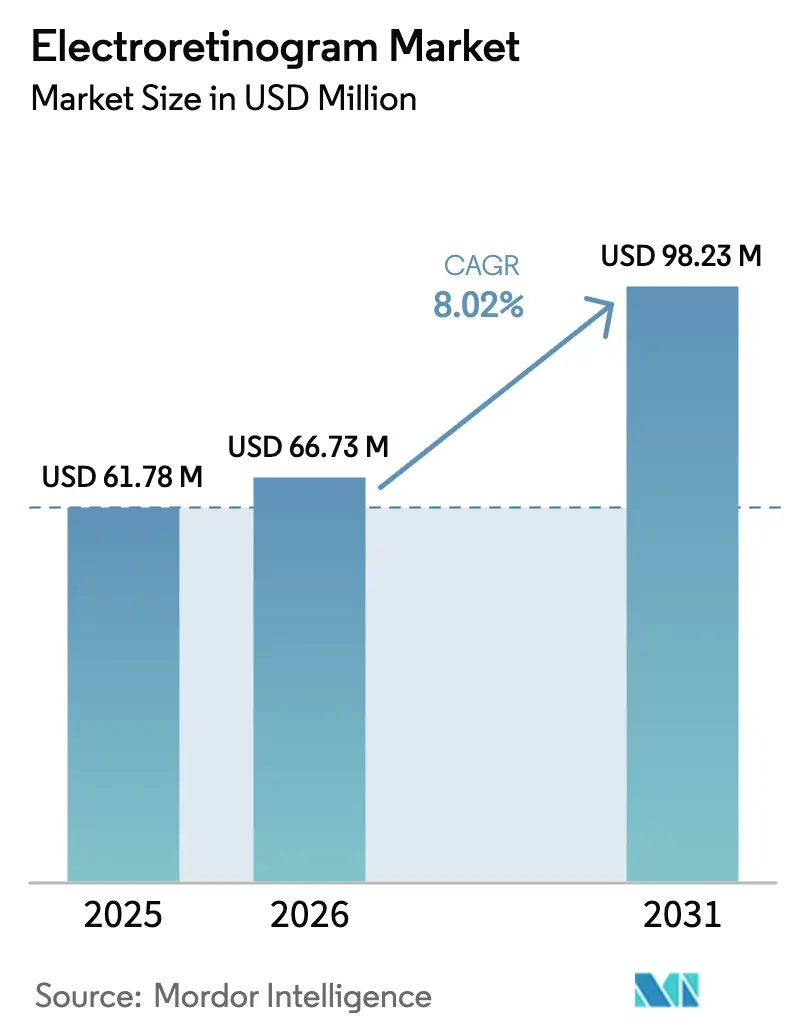
| Market Size (2026) | USD 66.73 Million |
| Market Size (2031) | USD 98.23 Million |
| Growth Rate (2026 - 2031) | 8.02% CAGR |
| Fastest Growing Market | Asia-Pacific |
| Largest Market | North America |
| Market Concentration | Medium |
Major Players *Disclaimer: Major Players sorted in no particular order Image © Mordor Intelligence. Reuse requires attribution under CC BY 4.0. | |
Electroretinogram Market Analysis by Mordor Intelligence
The electroretinogram market size is expected to grow from USD 61.78 million in 2025 to USD 66.73 million in 2026 and is forecast to reach USD 98.23 million by 2031 at 8.02% CAGR over 2026-2031. Sustained momentum stems from the growing use of electrophysiology in routine eye care, the expanding roster of gene-therapy clinical trials, and artificial-intelligence algorithms that shorten test-to-diagnosis turnaround times. Portable systems are the prime beneficiary of these trends because they move retinal testing closer to primary care settings and underserved populations. Meanwhile, fixed laboratory platforms keep their foothold in university hospitals thanks to multi-modality integration, broad reimbursement coverage under CPT codes 92273, 92274 and 0509T, and the need for high-fidelity recordings in advanced disease management. Consolidation among device makers is accelerating as full-service ophthalmic companies assemble integrated diagnostic portfolios that wrap electroretinography into complete retinal-care workstreams.
Key Report Takeaways
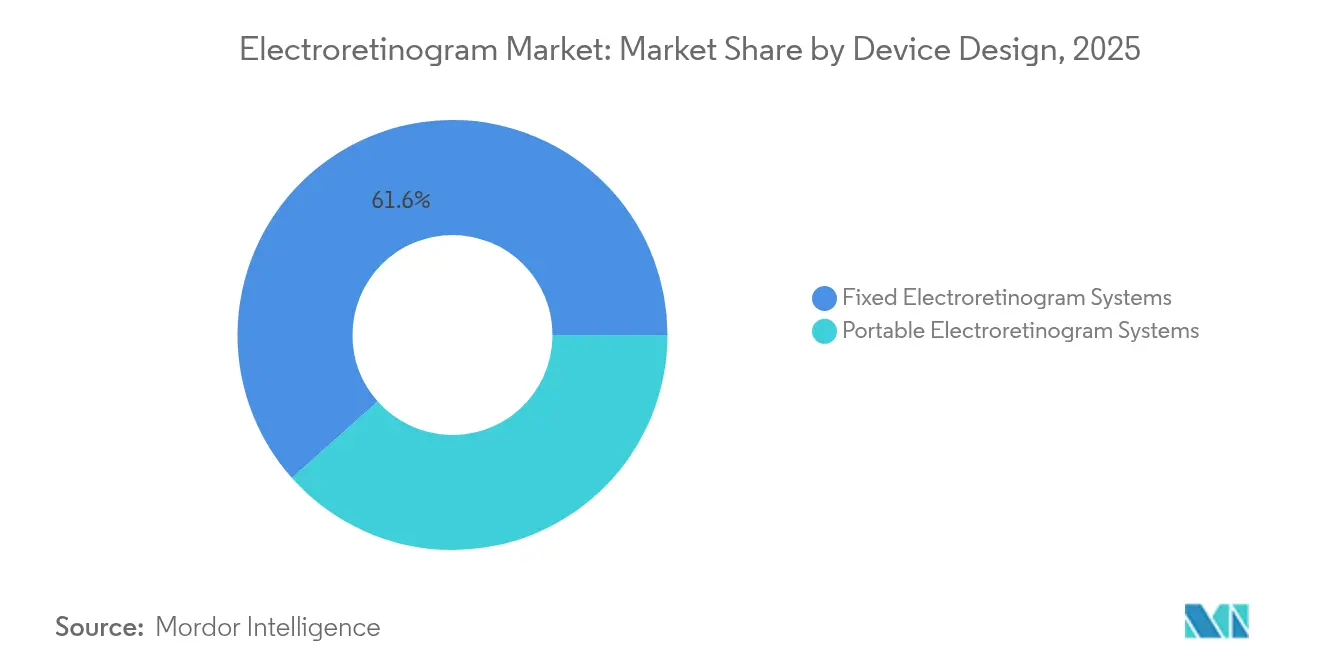
- By device design, fixed systems held 61.58% of the electroretinogram market share in 2025 while portable platforms are expanding at a 10.01% CAGR through 2031.
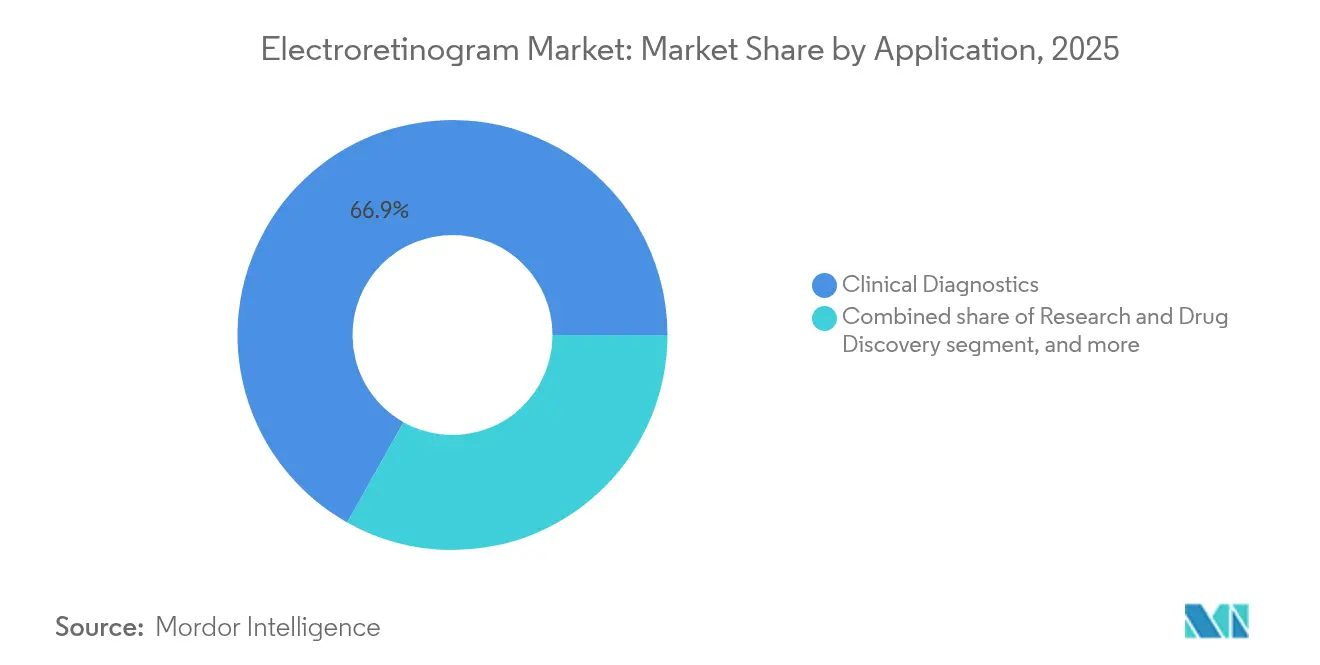
- By application, clinical diagnostics captured 66.85% revenue share of the electroretinogram market size in 2025; research and drug discovery is rising at an 11.05% CAGR to 2031.
- By test modality, full-field ERG led with 48.21% of the electroretinogram market size in 2025; multifocal ERG is tracking the fastest CAGR at 10.14% through 2031.
- By end-user, hospitals led with 54.08% of the electroretinogram market size in 2025; academic & research institutes is tracking the fastest CAGR at 10.88% through 2031.
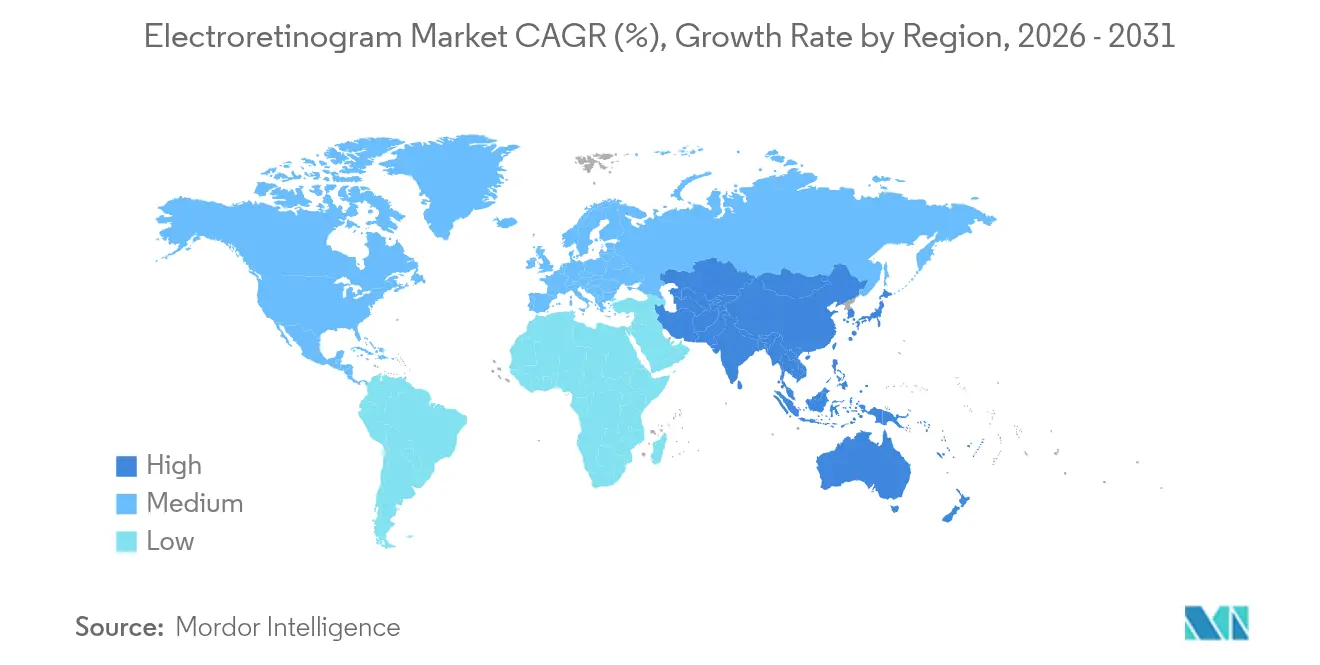
- By geography, North America commanded 40.12% of the electroretinogram market share in 2025, whereas Asia-Pacific records the briskest CAGR at 9.12% to 2031.
Note: Market size and forecast figures in this report are generated using Mordor Intelligence’s proprietary estimation framework, updated with the latest available data and insights as of 2026.
Global Electroretinogram Market Trends and Insights
Driver Impact Analysis*
| Driver | % Impact on CAGR Forecast | Geographic Relevance | Impact Timeline |
|---|---|---|---|
| Increasing burden of ophthalmic diseases | +2.1% | Global; highest in Asia-Pacific and North America | Long term (≥ 4 years) |
| Favorable demographics and aging population | +1.8% | Global; concentrated in developed markets | Long term (≥ 4 years) |
| Shift toward point-of-care retinal diagnostics | +1.5% | North America & EU; expanding to Asia-Pacific | Medium term (2-4 years) |
| Technological innovations in functional retinal imaging | +1.3% | Global; led by North America and Europe | Medium term (2-4 years) |
| Integration of artificial intelligence in ophthalmic diagnostics | +1.2% | North America & EU; early adoption in urban Asia-Pacific | Short term (≤ 2 years) |
| Expansion of gene and cell therapy clinical pipelines | +0.9% | North America & EU; selective rollout in Asia-Pacific | Medium term (2-4 years) |
| Source: Mordor Intelligence | |||
Increasing Burden of Ophthalmic Diseases
Diabetic retinopathy and age-related macular degeneration cases are climbing, making early functional assessment indispensable for vision preservation. Electroretinography detects retinal dysfunction before optical coherence tomography reveals structural lesions, which accelerates therapeutic intervention and broadens the electroretinogram market. Revised ISCEV standards issued in 2024 establish stricter testing parameters that reinforce clinical confidence and reimbursement eligibility[1]International Society for Clinical Electrophysiology of Vision, “2024 Standard for Pattern ERG,” iscev.org. Gene-therapy programs showcase the tool’s therapeutic-monitoring value; Life Biosciences reported pattern ERG improvements in nonhuman primates receiving ER-100 treatment at the 2024 AAO meeting. The resulting clinical-research feedback loop lifts procedure volumes in both hospitals and academic centers.
Favorable Demographics and Aging Population
Populations in Japan, Germany, the United States, and China are aging quickly, elevating incidences of macular degeneration and glaucoma that necessitate functional retinal testing[2]Asia-Pacific Journal of Ophthalmology, “Ophthalmologist Distribution in Asia,” apjo.org. Demand converges with workforce shortages, spurring portable electroretinogram systems that bring diagnostics to senior-care clinics and home-visit programs. Waseda University engineers advanced a soft multi-electrode contact lens in 2024, marrying comfort with disposable hygiene to suit older, fragile patients while shrinking practice turnover times. Device miniaturization also improves compliance among elderly individuals unable to tolerate corneal contact lens electrodes, widening the electroretinogram market footprint. Age-driven funding programs—such as Japan’s Long-Term Care Insurance reimbursements—further encourage institutional investment in portable ERG units.
Shift Toward Point-of-Care Retinal Diagnostics
Primary-care offices and community health centers are adopting ophthalmic screening technologies to offset the projected 30% shortfall of ophthalmologists by 2035 in the United States. ERG complements handheld retinal cameras by flagging functional deficits that photography alone cannot reveal, enabling earlier referral and shared-care protocols. FDA 510(k) clearances for portable imaging devices like AI Optics’ Sentinel Camera in 2025 underscore regulators’ support for decentralized diagnostics. Automated ERG classifiers now exceed 90% sensitivity in distinguishing normal versus abnormal responses, eliminating the need for on-site electrophysiology technicians and boosting adoption in non-specialist settings. This point-of-care wave is repositioning the electroretinogram market away from hospital basements to retail clinics, optical chains, and mobile vans.
Technological Innovations in Functional Retinal Imaging
Skin-electrode arrays and binocular recording hardware, such as the HE-2000 system, lower test discomfort and enable non-mydriatic protocols that accelerate high-volume cataract screening. Cross-platform integration lets clinicians overlay ERG signals with ultra-widefield imaging and optical coherence tomography angiography, producing unified reports that shorten interpretation cycles. Intellectual-property filings from Apple and Meta signal interest in embedding electro-oculographic sensing into consumer wearables, hinting at future home-based functional vision monitoring. These developments diversify revenue pools for manufacturers beyond traditional ophthalmology buyers. Cloud connectivity further accelerates data aggregation for algorithm training, reinforcing the electroretinogram market momentum among artificial-intelligence vendors.
Restraints Impact Analysis*
| Restraints Impact Analysis | (~) % Impact on CAGR Forecast | Geographic Relevance | Impact Timeline |
|---|---|---|---|
| High capital expenditure and maintenance costs | -1.4% | Global; most pronounced in emerging markets | Long term (≥ 4 years) |
| Inconsistent reimbursement frameworks globally | -1.1% | Global; wide regional variation | Medium term (2-4 years) |
| Limited skilled workforce for electrophysiology testing | -0.8% | Global; acute in rural and emerging areas | Long term (≥ 4 years) |
| Substitution by advanced retinal imaging modalities | -0.7% | North America & EU; spreading to Asia-Pacific | Medium term (2-4 years) |
| Source: Mordor Intelligence | |||
High Capital Expenditure and Maintenance Costs
Complete ERG laboratories require shielded rooms, amplifiers, and specialized personnel, placing upfront costs beyond the reach of many community clinics. Although new CPT codes 92273, 92274, and 0509T align test types with payment levels, Medicare’s 5.4% fee reduction in 2024 erodes operating margins. “Dark lab” automation models attempt to mitigate labor expenses through robotics and AI but demand even higher start-up investment that small providers cannot absorb. Emerging-market hospitals face added hurdles from customs duties, currency fluctuations, and limited technical-support networks, delaying equipment refresh cycles and capping the electroretinogram market’s reachable instal-base.
Inconsistent Reimbursement Frameworks Globally
National payers vary widely on covered indications, documentation rules, and fee schedules for ERG, forcing providers to navigate multiple coding regimes. European Medical Device Regulation updates extend approval timelines and add post-market surveillance costs that manufacturers must amortize across unit volumes, raising list prices for buyers. Portable ERG and AI-aided analysis software lack established payment categories in several Asia-Pacific countries, shelving purchasing decisions despite clinical need. Harmonization efforts led by ISCEV and regional ophthalmic societies are underway, yet a uniform pathway remains years away, tempering near-term electroretinogram market acceleration.
*Our forecasts treat driver/restraint impacts as directional, not additive. The impact forecasts reflect baseline growth, mix effects, and variable interactions.
Segment Analysis
By Device Design: Portable Platforms Stretch the Care Continuum
Fixed stations accounted for 61.58% of the electroretinogram market in 2025, reflecting their legacy base in tertiary referral hospitals where comprehensive electrophysiology labs remain essential for rare-disease workups. Most models integrate dark-adaptation chambers, pattern stimulators, and multifocal modules, allowing ophthalmologists to switch modalities without swapping hardware. However, portable devices are scaling at a 10.01% CAGR because rural clinics and primary-care offices prize weight, footprint, and battery operation over full modality suites. The RETeval handheld unit links to cloud dashboards via Bluetooth, capturing cone response flicker under photopic conditions and auto-grading severity within seconds. This convergence of portability and analytics elevates portable systems from triage tools to frontline diagnostic assets. Looking ahead, hybrid architectures—soft multi-electrode lenses tethered to smartphone apps—promise to fuse the signal quality of fixed equipment with the reach of handhelds. Such versatility blurs traditional segmentation lines, reshaping the electroretinogram market trajectory through 2031.
Second-generation portable devices also target intraoperative settings where surgeons require real-time functional feedback on macular perfusion. Disposable probe designs minimize sterility concerns and speed turnaround between cases. Component miniaturization has trimmed average device prices by 18% since 2022, although maintenance contracts still command premium fees that favor leasing structures over outright purchase. Vendors now bundle software upgrades and remote calibration within subscription models, smoothing cash flows for clinics while locking customers into multiyear service agreements. These go-to-market adjustments are expected to narrow the price gap between portable and entry-level fixed systems, encouraging smaller practices to adopt a two-tier model that balances quick screening with occasional referral to centralized labs for complex studies.


By Test Modality: Multifocal ERG Widens Therapeutic Horizons
Full-field recordings remain the workhorse modality with 48.21% of the electroretinogram market size in 2025 because they capture rod-cone degeneration patterns critical in inherited retinal disease screening. Nevertheless, multifocal ERG outpaces other modalities at a 10.14% CAGR, powered by its macula-centric mapping indispensable for gauging gene-therapy efficacy. The technique’s ability to dissect localized P1-wave densities enables fine-grained correlation with optical coherence tomography and fundus autofluorescence, yielding multifactorial endpoints favored by regulators. Studies of Bietti crystalline corneoretinal dystrophy showed 80% of treated eyes maintained P1-wave gains at 12 months, cementing multifocal tests as clinical-trial mainstays.
Pattern ERG, long considered a glaucoma biomarker, received an evidence upgrade in 2024 through tighter ISCEV calibration rules that cut inter-lab variability by 35%. Its ganglion-cell-layer focus dovetails with emerging neuroprotective therapeutics, potentially spawning new reimbursement add-ons and lifting overall electroretinogram market utilization. Focal ERG and scotopic threshold response—while niche—fill gaps in pediatric and ultra-low-vision populations, ensuring that modality diversification grows in tandem with personalized-medicine requirements.
By Application: Research Pipelines Drive Procedural Volume
Clinical diagnostics dominated spending with a 66.85% share in 2025, thanks to diabetic retinopathy and AMD management guidelines that make ERG testing routine in retina clinics. Yet research and drug discovery posts an 11.05% CAGR through 2031 because every wave of gene-editing or optogenetic therapy demands longitudinal functional endpoints. As of 2025, 67 ophthalmic interventional trials list electroretinography as a primary or secondary outcome on ClinicalTrials.gov, double the tally in 2022. CROs embed portable units into multicenter protocols to harmonize data collection, trimming site-set-up times by 40% relative to fixed labs. Intraoperative monitoring, though still a minority use-case, gains relevance in macular hole and retinal-prosthesis surgeries, where real-time electroretinogram feedback informs surgical technique adjustments and predicts postoperative visual potential.
Artificial-intelligence suppliers train algorithms on multi-institution datasets comprising more than 1,300 pattern ERG traces collected over two decades, boosting diagnostic sensitivity in under-represented ethnic groups. Hospitals in Europe and Japan now pilot AI-assisted ERG triage that flags anomalies for specialist review, slicing reporting turnaround from days to minutes and amplifying electroretinogram market procedure counts without adding staff.
By End-user: Academic Hospitals Orchestrate Innovation Loops
Hospitals and clinics held 54.08% of 2025 revenue because insurers reimburse facility-based tests more readily than office procedures. Many tertiary centers run electrophysiology labs alongside imaging suites, facilitating multidisciplinary workflows for complex retinal cases. Academic institutions, however, grow at 10.88% CAGR as they secure grants to explore gene editing, stem-cell implants, and neuro-visual prosthetics. Their dual mandate—research and training—creates high baseline demand for advanced ERG, spurring early adoption of skin-electrode arrays and machine-learning toolkits.
Ambulatory surgical centers and high-street optical chains are fastfollowers, leveraging portable ERG to differentiate service offerings and capture pre-operative assessments. Workforce shortages push community ophthalmologists toward remote-read arrangements with academic hubs, intertwining these end-user segments. Industry-funded fellowships reinforce technology-transfer pipelines, ensuring that graduating residents carry ERG literacy into private practice, thereby enlarging the electroretinogram market catchment.
Geography Analysis
North America leads the electroretinogram market with a 40.12% share in 2025, anchored by robust reimbursement, dense subspecialty networks, and ISCEV-certified laboratories. Medicare recognition of specific ERG CPT codes secures predictable cash flows, though the 2024 Physician Fee Schedule cut margins for private practices. Remote area shortages—29% adequacy in rural zones—accelerate portable-unit adoption under teleophthalmology umbrellas that feed university reading centres.
Asia-Pacific charts a 9.12% CAGR to 2031, propelled by population aging and uneven ophthalmologist distribution—Japan has 114 ophthalmologists per million citizens, contrasting with scant coverage in rural India. Government blindness-prevention programs in China subsidize portable devices for community health stations, widening the electroretinogram market base. Japan’s universal health insurance fast-tracks reimbursement, while Australia integrates ERG into indigenous eye-health outreach, illustrating diverse regional growth triggers.
Europe exhibits stable expansion as Medical Device Regulation compliance matures. National Health Service frameworks in the United Kingdom reimburse ERG under specialized tariffs, sustaining lab updates despite cost constraints. Germany’s statutory insurance bundles ERG within disease-management programs for diabetic patients, reinforcing recurrent testing revenue. Regulatory guidance issued in 2024 clarifies investigation exemptions for low-risk ERG components, accelerating innovation uptake.
Middle East & Africa and South America collectively contribute a modest share but hold long-run promise. Private hospital chains in the Gulf Cooperation Council import high-end fixed systems, while South American NGOs deploy solar-powered portable units in remote Amazonian communities. Funding gaps and tariff barriers remain obstacles; nonetheless, technology-transfer initiatives sponsored by international development agencies aim to bridge these deficits, gradually enlarging the electroretinogram market addressable base.

Competitive Landscape
Electroretinography suppliers operate in a moderately concentrated arena where product differentiation hinges on signal quality, workflow automation, and regulatory pedigree. LKC Technologies, Diagnosys, and Roland-consult anchor the field by leveraging ISCEV conformance, multichannel stimulators, and FDA clearances to retain key accounts. Mid-tier entrants emphasize AI-powered analytics, enticing resource-strapped clinics with “interpretation-as-a-service” subscriptions that eliminate diagnostic bottlenecks.
Industry consolidation is re-drawing boundaries: Carl Zeiss’s USD 1 billion acquisition of DORC integrates intraoperative visualization with electrophysiology pipelines, promising single-vendor retinal platforms. EssilorLuxottica’s majority stake in Heidelberg Engineering bridges refraction retail, imaging, and ERG analytics, signaling a shift toward vertically integrated eye-care ecosystems that embed functional testing within end-to-end journeys.
Patenting trends forecast expansion into consumer-electronics channels; Meta filed wearables that capture visually evoked potentials, and Apple followed with eye-movement detection modules, foreshadowing wellness applications that could swell the electroretinogram market user base. Academic-industry partnerships—Waseda University co-developing soft lenses with a domestic sensor startup—feed a pipeline of flexible electrodes and disposable arrays aimed at high-volume screening. Overall, competitive success now relies less on manufacturing scale than on ecosystem orchestration, software stickiness, and data-rich service layers.
Electroretinogram Industry Leaders
CSO Italia
Metrovision
LKC Technologies
Neurosoft
Konan Medical USA Inc
- *Disclaimer: Major Players sorted in no particular order

Recent Industry Developments
- July 2025: Alcon acquired LumiThera, adding the FDA-authorized Valeda photobiomodulation system for dry AMD to its arsenal.
- March 2025: The American Academy of Ophthalmology incorporated electroretinography into its Diabetic Retinopathy Preferred Practice Pattern, elevating ERG to guideline status.
- January 2025: Cencora bought an 85% stake in Retina Consultants of America for USD 4.6 billion, consolidating retina services that rely on standardized ERG testing.
- December 2024: EssilorLuxottica agreed to purchase Espansione Group, gaining light-therapy devices relevant to ERG-monitored retinal care.
- November 2024: FDA cleared LumiThera’s Valeda Light Delivery System, marking the first approved dry-AMD device using ERG-linked endpoints.


Global Electroretinogram Market Report Scope
As per the scope of the report, electroretinogram (ERG) is a reliable, non-invasive test that assesses the electrical response of retinal cells to light stimuli. It can be employed to diagnose various eye diseases such as glaucoma and diabetic retinopathy.
The Electroretinogram Market is segmented by Type, Application and Geography. By type, the market is segmented into fixed electroretinogram and portable electroretinogram. By application, the market is segmented into research and developments, and clinical uses. By geography the market is segmented into North America, Europe, Asia-Pacific, Middle East & Africa, and South America. The market report also covers the estimated market sizes and trends for 17 countries across major regions globally. The report offers the value (USD) for the above segments.
| Fixed Electroretinogram Systems |
| Portable Electroretinogram Systems |
| Full-field ERG |
| Multifocal ERG |
| Pattern ERG |
| Focal ERG |
| Clinical Diagnostics |
| Research & Drug Discovery |
| Intraoperative Monitoring |
| Hospitals & Clinics |
| Ophthalmic Centers |
| Ambulatory Surgical Centers |
| Academic & Research Institutes |
| North America | United States |
| Canada | |
| Mexico | |
| Europe | Germany |
| United Kingdom | |
| France | |
| Italy | |
| Spain | |
| Rest of Europe | |
| Asia-Pacific | China |
| Japan | |
| India | |
| Australia | |
| South Korea | |
| Rest of Asia-Pacific | |
| Middle East & Africa | GCC |
| South Africa | |
| Rest of Middle East & Africa | |
| South America | Brazil |
| Argentina | |
| Rest of South America |
| By Device Design | Fixed Electroretinogram Systems | |
| Portable Electroretinogram Systems | ||
| By Test Modality | Full-field ERG | |
| Multifocal ERG | ||
| Pattern ERG | ||
| Focal ERG | ||
| By Application | Clinical Diagnostics | |
| Research & Drug Discovery | ||
| Intraoperative Monitoring | ||
| By End-user | Hospitals & Clinics | |
| Ophthalmic Centers | ||
| Ambulatory Surgical Centers | ||
| Academic & Research Institutes | ||
| Geography | North America | United States |
| Canada | ||
| Mexico | ||
| Europe | Germany | |
| United Kingdom | ||
| France | ||
| Italy | ||
| Spain | ||
| Rest of Europe | ||
| Asia-Pacific | China | |
| Japan | ||
| India | ||
| Australia | ||
| South Korea | ||
| Rest of Asia-Pacific | ||
| Middle East & Africa | GCC | |
| South Africa | ||
| Rest of Middle East & Africa | ||
| South America | Brazil | |
| Argentina | ||
| Rest of South America | ||


Key Questions Answered in the Report
How large is the electroretinogram market in 2026?
The electroretinogram market size reaches USD 66.73 million in 2026 and is forecast to hit USD 98.23 million by 2031 at an 8.02% CAGR.
Which device type is growing fastest?
Portable electroretinogram platforms lead growth with a 10.01% CAGR by addressing access gaps outside tertiary hospitals.
What modality sees the highest adoption momentum?
Multifocal ERG shows the quickest uptake at a 10.14% CAGR because its localized mapping is critical for gene-therapy monitoring.
Which region records the strongest expansion?
Asia-Pacific posts the fastest CAGR at 9.12% through 2031 due to aging populations and wider ophthalmic coverage.
How are AI tools influencing ERG use?
Artificial-intelligence algorithms now deliver >90% sensitivity in automated ERG interpretation, shortening turnaround times and enabling point-of-care deployment.
Who are the key market leaders?
LKC Technologies, Diagnosys, Roland-consult, and recently acquisitive conglomerates such as Carl Zeiss and EssilorLuxottica dominate through technology depth and ecosystem integration.
Page last updated on:


