
Laboratory Equipment and Disposables Market Size and Share
Market Overview
| Study Period | 2020 - 2031 |
|---|---|
| Market Size (2026) | USD 40.73 Billion |
| Market Size (2031) | USD 58.86 Billion |
| Growth Rate (2026 - 2031) | 7.64 % |
| Fastest Growing Market | North America |
| Largest Market | Asia-Pacific |
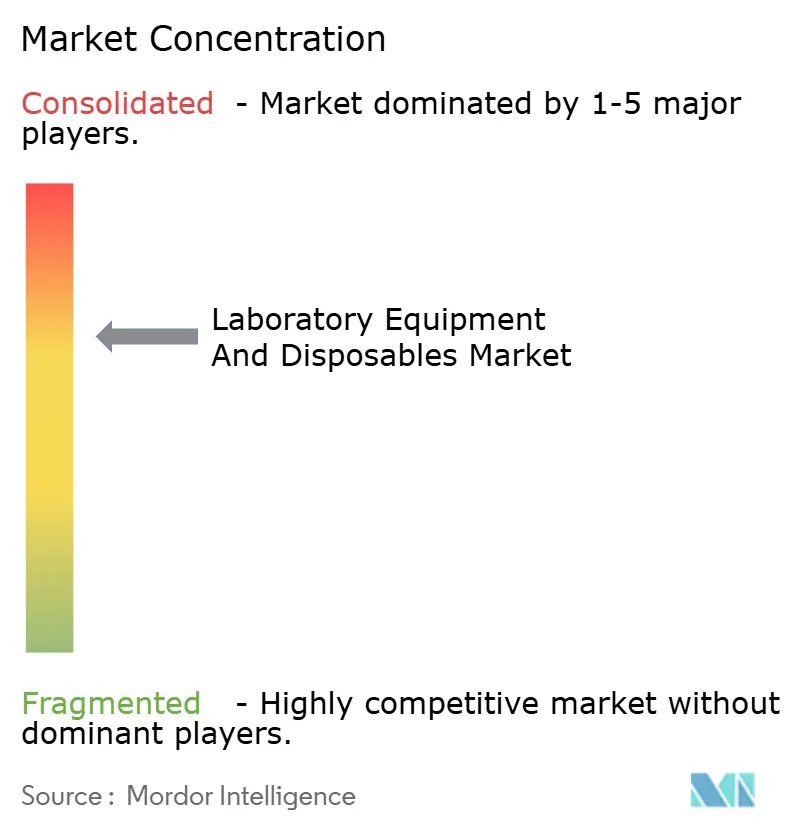
| Market Concentration | Medium |
Major Players *Disclaimer: Major Players sorted in no particular order Image © Mordor Intelligence. Reuse requires attribution under CC BY 4.0. | |
Laboratory Equipment and Disposables Market Analysis by Mordor Intelligence
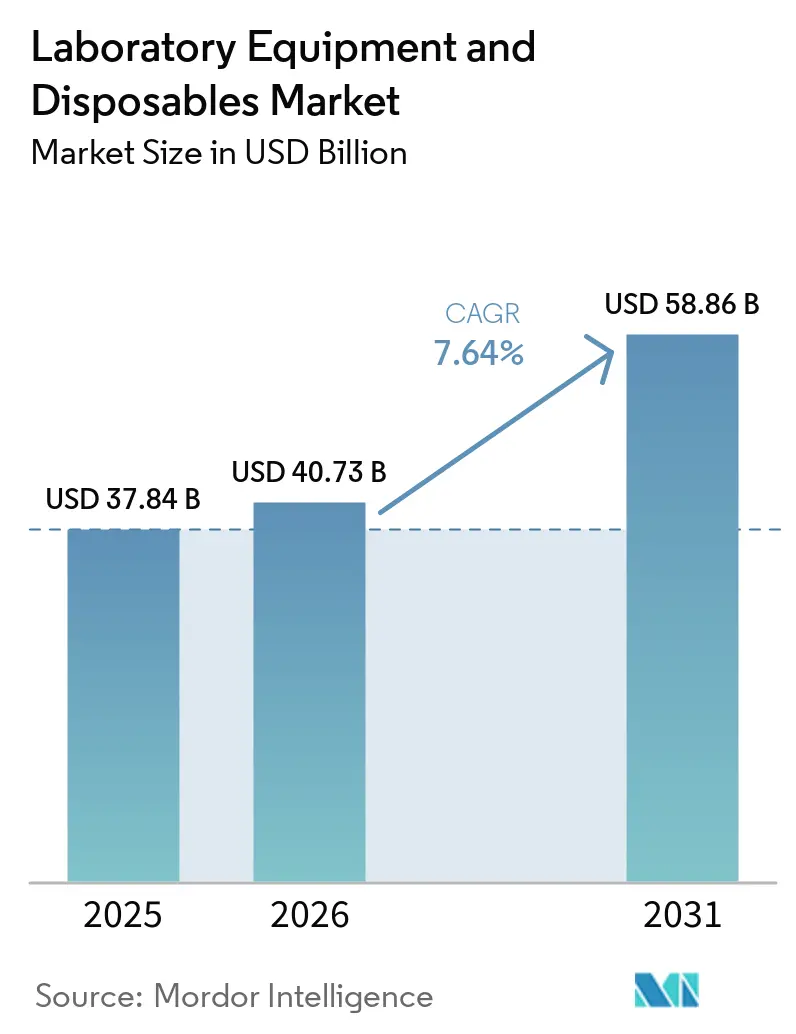
The Laboratory Equipment And Disposables Market size is projected to be USD 37.84 billion in 2025, USD 40.73 billion in 2026, and reach USD 58.86 billion by 2031, growing at a CAGR of 7.64% from 2026 to 2031.
In 2024, leading pharmaceutical companies are expected to allocate approximately USD 190 billion to biopharmaceutical R&D. This significant investment is driving strong demand for analytical instruments as firms prioritize accelerated discovery timelines. Concurrently, hospitals and reference laboratories are expanding their testing capacities, driven by the global burden of non-communicable diseases, which account for 41 million deaths annually. This trend is fueling increased adoption of automated systems for chemistry, hematology, and molecular testing. Additionally, advancements in automation and single-use technologies are reducing equipment replacement cycles and boosting consumables demand. Public-sector net-zero mandates are further incentivizing suppliers to demonstrate low-carbon operations and implement effective take-back programs. Although near-term pressures on plastics margins and extended regulatory timelines for new diagnostic platforms may moderate growth, these factors are not expected to hinder the overall expansion trajectory.
Key Report Takeaways
- By product type, laboratory equipment accounted for 55.43% of revenue in 2025, whereas disposables are forecast to expand at a 9.54% CAGR through 2031.
- By application, clinical diagnostics led with 41.45% of the laboratory equipment & disposables market share in 2025, while genomics and proteomics are set to advance at a 9.76% CAGR through 2031.
- By end user, hospitals and clinics captured 46.54% spending in 2025, yet contract research organizations are projected to grow at a 10.43% CAGR to 2031.
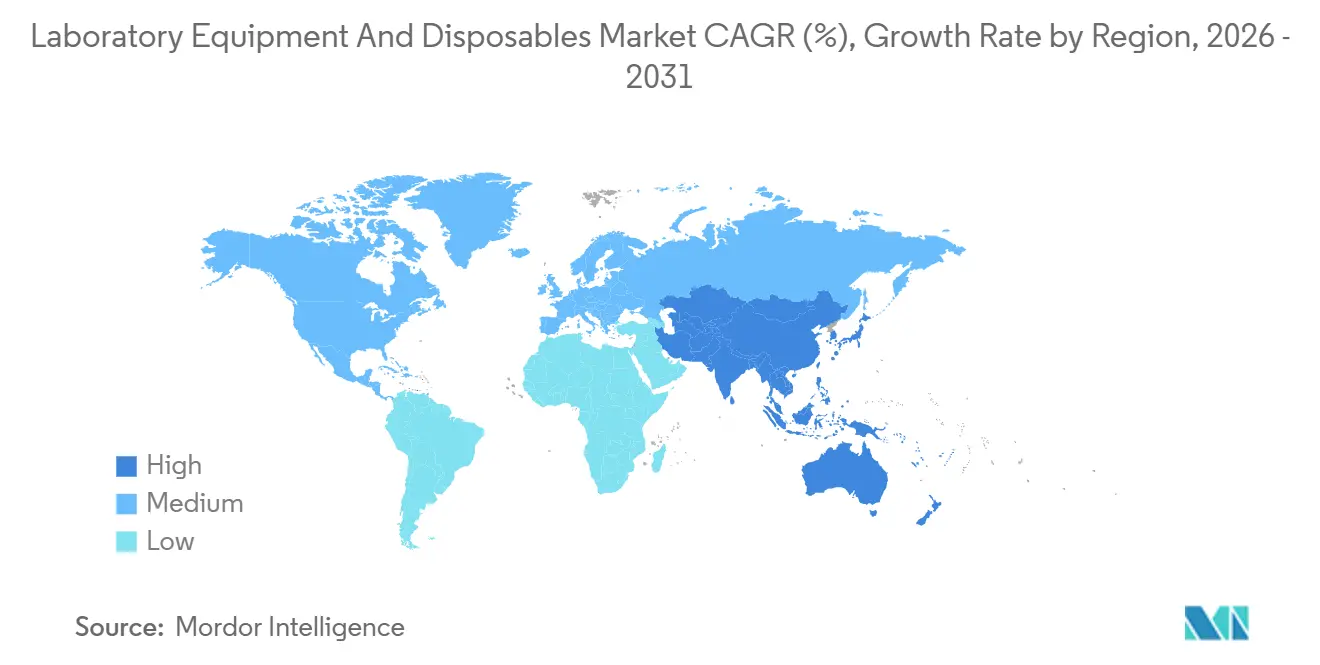
- By geography, North America accounted for 42.65% of revenue in 2025; Asia-Pacific is the fastest-growing region, with an 8.54% CAGR for 2026-2031.
Note: Market size and forecast figures in this report are generated using Mordor Intelligence’s proprietary estimation framework, updated with the latest available data and insights as of 2026.
Global Laboratory Equipment and Disposables Market Trends and Insights
Drivers Impact Analysis*
| Driver | (~) % Impact on CAGR Forecast | Geographic Relevance | Impact Timeline |
|---|---|---|---|
| Escalating Biopharmaceutical R&D Budgets | +1.8% | North America, Europe, expanding Asia-Pacific | Medium term (2-4 years) |
| Rising Prevalence of Chronic Diseases Driving Diagnostic Testing | +1.5% | Global, especially Asia-Pacific and North America | Long term (≥ 4 years) |
| Growing Adoption of Automation and High-Throughput Lab Systems | +1.3% | North America, Europe, emerging Asia-Pacific hubs | Medium term (2-4 years) |
| Convergence of Lab-On-Chip Manufacturing With Disposable Platforms | +1.0% | Global, strongest in point-of-care markets | Long term (≥ 4 years) |
| Government Net-Zero Procurement Mandates for Laboratory Infrastructure | +0.7% | Europe, North America, early Asia-Pacific adopters | Long term (≥ 4 years) |
| Venture-Backed Open-Access Lab Networks Accelerating Equipment Turnover | +0.6% | North America, Europe innovation clusters | Short term (≤ 2 years) |
| Source: Mordor Intelligence | |||
Escalating Biopharmaceutical R&D Budgets
Drug makers face a collective patent-expiry cliff that threatens USD 150 billion in sales by 2027, prompting record investment in discovery and process-development labs. Industry R&D outlays climbed to roughly USD 288 billion in 2024, with Merck, Johnson & Johnson, and Roche each deploying more than USD 15 billion. Capital is channelled into liquid-handling robots, UHPLC, and next-generation sequencing, all of which underpin higher demand for precision instruments. Rising cell-and-gene-therapy pipelines further elevate needs for flow cytometers, digital PCR, and closed-system bioreactors. As sponsors push for faster IND filings, laboratories modernize to shorten cycle times.
Rising Prevalence of Chronic Diseases Driving Diagnostic Testing
Non-communicable ailments account for 74% of global mortality, led by cardiovascular disease, cancers, respiratory disorders, and diabetes. Diabetes alone is expected to affect 783 million adults by 2045, sustaining orders for HbA1c analyzers and continuous-glucose-monitoring lab components[1]International Diabetes Federation, “IDF Diabetes Atlas 2025,” idf.org . Cancer incidence could reach 35 million new cases by 2050, driving increased hospital demand for immunohistochemistry platforms and liquid biopsy workflows. In the United States, 60% of adults present at least one chronic condition, keeping chemistry and hematology systems fully utilized. Large chain laboratories, notably Quest Diagnostics and LabCorp, each exceeded USD 2 billion in Q3 2024 revenue, underlining the diagnostic-testing tailwind.
Growing Adoption of Automation and High-Throughput Lab Systems
Laboratories deploy automation to offset skilled-labor shortages and tighten quality control. QIAGEN plans three new sample-prep instruments by 2026, complementing its QIAcube and QIAsymphony lines. Agilent’s ADS 2 and Infinity III LC series improve dilution accuracy and speed in QC labs. MilliporeSigma’s partnership with Opentrons embeds open-source robotics into reagent workflows, while Bio-Rad’s 2024 acquisition of Stilla Technologies enlarged its digital-PCR suite. Such systems cut turnaround times, boost reproducibility, and feed laboratory-information-management systems for real-time analytics.
Convergence of Lab-On-Chip Manufacturing with Disposable Platforms
The United Kingdom, United States, and European Union now embed life-cycle emissions criteria in public lab-equipment tenders. Vendors must document carbon footprints, offer take-back of used consumables, and slash energy draws. Thermo Fisher and Sartorius pledge operational carbon neutrality by 2030, aligning with these mandates. Suppliers without retrofit capabilities risk exclusion from lucrative government contracts, accelerating consolidation in disposables.
Restraints Impact Analysis*
| Restraint | (~) % Impact on CAGR Forecast | Geographic Relevance | Impact Timeline |
|---|---|---|---|
| Volatile Prices of Medical-Grade Polymers and Specialty Resins | -0.9% | Global, acute in regions reliant on Asian polymer imports | Short term (≤ 2 years) |
| Lengthy Validation and Certification Cycles for New Instrument Platforms | -0.6% | Global, notably Europe under IVD-R and North America under FDA | Medium term (2-4 years) |
| Emerging Circular-Economy Regulations Curtailing Single-Use Disposables | -0.4% | Europe, North America, spreading to Asia-Pacific | Long term (≥ 4 years) |
| Shortage of Cross-Skilled Automation and Data-Science Personnel | -0.3% | Global, most pronounced in developing R&D hubs | Medium term (2-4 years) |
| Source: Mordor Intelligence | |||
Volatile Prices of Medical-Grade Polymers and Specialty Resins
Medical-grade polypropylene and polyethylene experienced triple-digit price swings in early 2025 following supply disruptions, compressing margins for pipette-tip and cell-culture-flask makers[2]British Plastics Federation, “Polymer Market Update Q1 2025,” bpf.co.uk. Corning cited resin volatility as a headwind to its USD 1.2 billion life-sciences revenue in Q3 2024, while Thermo Fisher acknowledged customer resistance to pass-through pricing. Smaller vendors lacking long-term contracts must absorb spikes or cede share to vertically integrated rivals. Moves toward recycled or biodegradable plastics, though environmentally positive, introduce cost premiums that many laboratories still hesitate to pay.
Lengthy Validation and Certification Cycles for New Instrument Platforms
Gaining FDA 510(k) clearance takes 3-12 months, whereas PMA approvals for high-risk diagnostics can take up to 3 years[3]U.S. Food and Drug Administration, “Premarket Approval (PMA) Process,” fda.gov. Europe’s IVD-R requires notified-body reviews even for moderate-risk devices, further lengthening timelines. ISO 13485 quality-system certification adds documentation and audit burdens, nudging innovators toward incremental, rather than disruptive, upgrades. Illumina’s NovaSeq X underwent multi-year global validations before its 2024 commercial launch, underscoring the capital and time barriers even the best-funded players face.
*Our forecasts treat driver/restraint impacts as directional, not additive. The impact forecasts reflect baseline growth, mix effects, and variable interactions.
Segment Analysis
By Product Type: Disposables Outpace Equipment on Single-Use Adoption
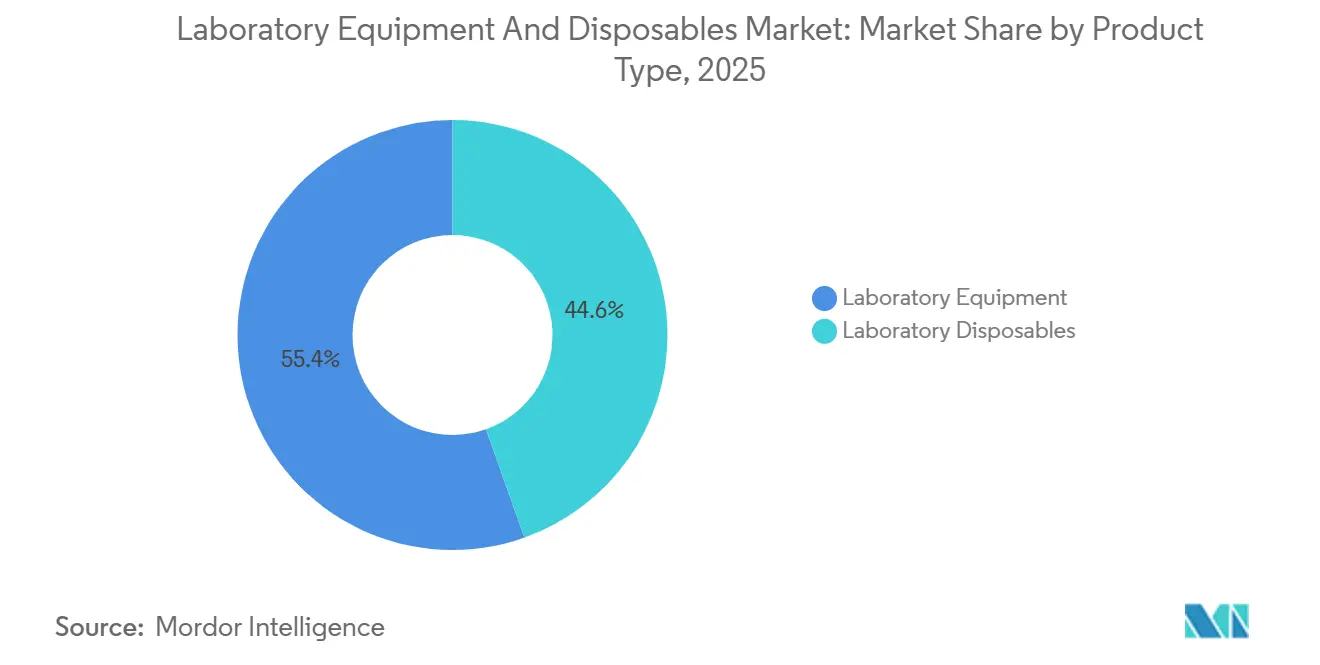
Disposables are on track to eclipse traditional hardware growth, advancing at a 9.54% CAGR through 2031, even though equipment retained 55.43% revenue in 2025. The shift reflects biopharma’s move to single-use bioreactors that trim cleaning validation and cross-contamination risk. Analytical instruments, notably LC-MS and ICP-MS, still anchor capital budgets, with Waters and Agilent securing pharmaceutical QC contracts. General lab fixtures—centrifuges, incubators, biosafety cabinets—see lengthened replacement cycles as hospitals stretch capital budgets via service agreements.
Plasticware and glassware dominate the consumables basket, with Corning and Thermo Fisher serving cell-culture, filtration, and general laboratory needs, including laboratory glassware. Filtration media for monoclonal-antibody purification buoy MilliporeSigma and Sartorius orders. Clean-room disposables, from gloves to sterile garments, rise in step with GMP enforcement. Emerging lab-on-chip diagnostics integrate reagents into single-use cartridges, creating ancillary demand from companies such as Abbott and Roche Diagnostics.



By Application: Genomics and Proteomics Surge on Precision Medicine
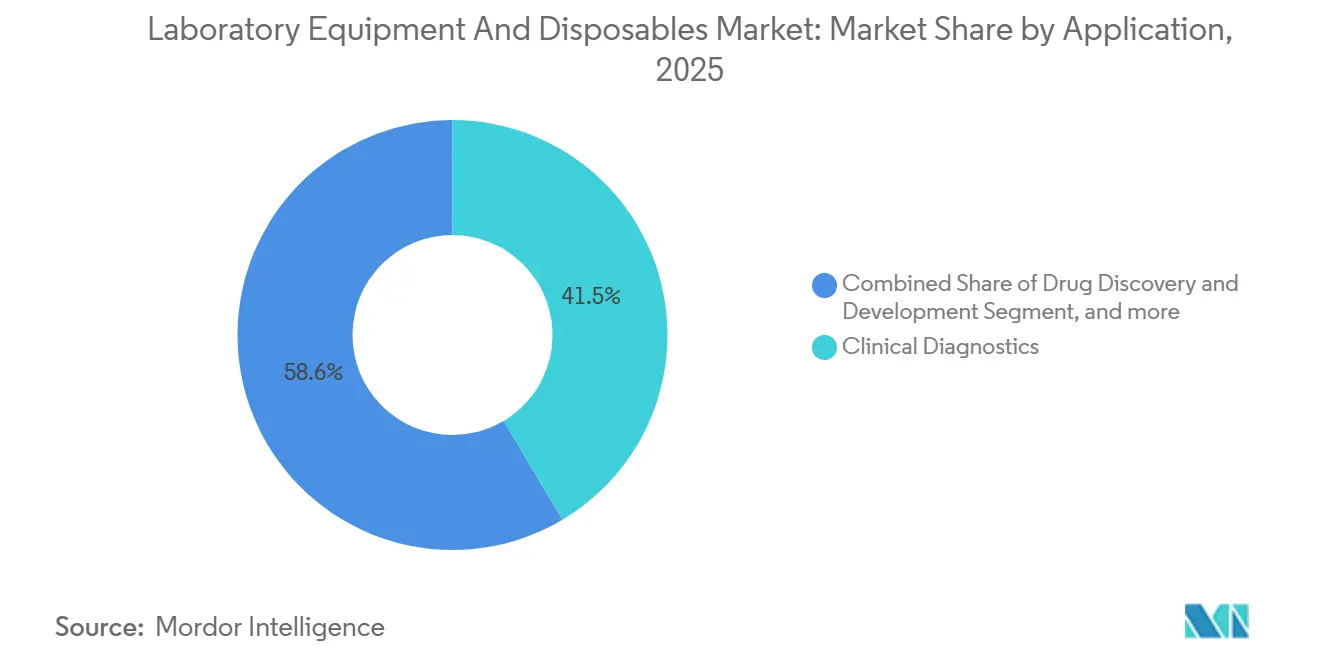
Clinical diagnostics accounted for 41.45% of revenue in 2025, benefiting from large installed bases of chemistry and immunoassay analyzers. Genomics and proteomics are the fastest movers, projected at a 9.76% CAGR, supported by Illumina’s NovaSeq X and Bruker’s Timstof platforms that cut per-sample costs for whole-genome and proteomic screens. Drug-discovery labs continue to invest in automated liquid handlers and high-content imagers as total industry R&D hit USD 288 billion in 2024.
Academic budgets remain tight, increasing reliance on shared core facilities and open-access hubs such as LabCentral. Industrial and environmental labs deploy GC-MS and ICP-MS to meet ISO 17025 requirements for contaminant testing, while clinical labs adopt mass spectrometry workflows through partnerships such as LabCorp’s alliance with Roche. Single-cell multi-omics and spatial transcriptomics platforms from 10x Genomics and Bio-Rad promise integrated end-to-end solutions that further propel spending.
By End User: CROs Accelerate on Outsourcing Wave
Hospitals and clinics absorbed 46.54% of outlays in 2025, yet contract research organizations are poised for a 10.43% CAGR as sponsors seek variable-cost models. Charles River logged USD 1.02 billion in Q3 2024 revenue, reflecting demand for discovery and safety labs, while IQVIA forecast up to USD 15.6 billion full-year sales across clinical services. Pharmaceutical majors maintain core discovery labs but outsource late-stage work to CROs to conserve capital.
Universities and government institutes depend on NIH and EU Horizon funding cycles, pushing many to adopt shared-resource models that require instrument turnover every 3 to 5 years. Open-access networks further lower entry barriers for start-ups, creating predictable refresh demand. Reference laboratories such as Quest and LabCorp blend routine and specialty testing, investing heavily in next-generation sequencing and flow cytometry to capture higher-margin assays and meet CLIA or ISO 15189 quality mandates.
Geography Analysis
North America generated 42.65% of 2025 sales, buoyed by dense biopharma clusters in Boston, San Francisco, and Research Triangle Park. NIH appropriations of USD 47 billion in fiscal 2024 and venture-capital inflows above USD 20 billion keep the laboratory equipment & disposables market vibrant. Thermo Fisher reported Q3 2024 revenue of USD 10.6 billion, with North America as its leading region. Tight FDA and CLIA oversight elevate demand for compliant platforms, while hospital reference labs deploy NGS and mass spectrometry to support personalized-medicine initiatives.
Asia-Pacific is forecast to grow at an 8.54% CAGR, powered by China’s CDMO build-out, India’s burgeoning diagnostics chains, and Japan’s precision-instrument exports. WuXi AppTec and WuXi Biologics are erecting multi-billion-dollar facilities that require extensive chromatography, filtration, and single-use hardware. BGI’s sequencing centers field thousands of instruments, and South Korea’s upgrades to cell-therapy capacity fuel orders for closed-system bioreactors.
Europe maintains a significant position through Germany’s chemical powerhouse, the United Kingdom’s research universities, and France’s public-health labs. Stringent IVD-R and MDR rules favor established suppliers such as Roche Diagnostics, Siemens Healthineers, and Danaher’s Beckman Coulter. NHS sustainability mandates push for energy-efficient analyzers and circular consumables. Elsewhere, GCC states ramp clinical capacity, South Africa bolsters infectious-disease labs, and Latin American markets adopt reagent-rental models to offset currency volatility.

Regulatory Landscape
Laboratory equipment and disposables suppliers work within overlapping quality, safety, and data-integrity regimes that cover both instruments and software used in regulated workflows, and the consumables that support them. In the United States, FDA expectations for electronic records and signatures under 21 CFR Part 11 shape instrument software validation and audit-trail capabilities, while EU data-integrity requirements are reflected in EU GMP guidance (including Annex 11) for computerized systems used in GxP environments. For market access, quality-management certification remains a prerequisite across many product categories, with established vendors running ISO 9001 and ISO 13485 programs and extending privacy and information security controls, such as ISO/IEC 27701, as laboratory equipment becomes more connected.
In Europe, the In Vitro Diagnostics Regulation (IVDR) (EU) 2017/746 has tightened conformity assessment requirements and increased the role of notified bodies for many diagnostics-related product lines, raising documentation and timeline burdens. Transition deadlines vary by risk class, including a May 2025 milestone for certain Class D devices, with later deadlines for other classes. In addition, supply-chain governance has become a purchasing factor, including conflict-minerals due diligence obligations for SEC registrants under Rule 13p-1, which reinforces traceability expectations for upstream component sourcing.
Value Chain Analysis
The value chain runs from upstream materials and components, including medical-grade polymers and resins for plasticware and clean-room consumables, precision metals and optics, and microfluidic substrates, through instrument and consumables design and manufacturing, to downstream validation, distribution, and end-use in regulated and non-regulated laboratories. As workflows digitize, software, cybersecurity, and data-integrity services increasingly sit alongside physical equipment, and compliance consulting and validation support that aligns with 21 CFR Part 11 can act as a commercial lever by accelerating installation, qualification (IQ/OQ/PQ), and sustained use in GxP settings.
Midstream, vendors sell directly to biopharma, hospitals, and reference labs, while third-party distributors extend reach across geographies. Service organizations also influence throughput through calibration, preventive maintenance, and uptime commitments. Outsourced testing providers are another downstream node, since cGMP-aligned contract testing services, such as Sartorius biologics testing, let sponsors shift quality control and characterization workloads without building equivalent internal facilities, supporting recurring demand for validated consumables, assay kits, and instrument time. Compliance and sourcing requirements, including conflict-minerals due diligence for certain manufacturers, add documentation and auditing steps that can narrow supplier selection toward vendors with established quality systems and traceability programs.
Competitive Landscape
Market concentration is moderate. Thermo Fisher, Danaher, and Agilent leverage integrated portfolios of instruments, reagents, and multi-year service contracts to deepen customer lock-in. Thermo Fisher’s USD 17.4 billion PPD acquisition signaled its extension into contract research, while Danaher’s Cytiva and Pall divisions extend their reach from discovery to bioproduction. Waters, PerkinElmer, and Bio-Rad pursue bolt-on deals—such as Waters’ 2024 acquisition of Wyatt Technology—to fill capability gaps.
Niche entrants focus on lab-on-chip microfluidics and cloud-connected automation. Venture-backed LabCentral and BioLabs replace ownership with access, refreshing equipment every few years and guaranteeing vendors repeat business. Automation specialists Tecan and Hamilton integrate robotics with LIMS to cut error rates and labor costs. ISO 13485 and 17025 compliance remains costly, reinforcing incumbent advantages and slowing disruption.
Laboratory Equipment and Disposables Industry Leaders
Agilent technologies Inc
Bio-Rad Laboratories
Brucker Corporation
Sartorius AG
PerkinElmer Inc.
- *Disclaimer: Major Players sorted in no particular order

Market Opportunities and Future Outlook
Compliance-driven digitization of laboratory workflows is generating incremental demand for validated software layers, audit trails, and end-to-end data integrity in regulated environments. A specific indicator is Agilent's December 2025 release of 21 CFR Part 11-compliant software for its xCELLigence RTCA eSight platform, which supports deployment in GMP-regulated settings and creates attach opportunities for services, validation, and software upgrades across existing installed bases. Similar compliance needs extend across chromatography, mass spectrometry, and automation platforms, where laboratories prioritize inspection-ready workflows over bespoke integrations.
Europe's IVDR transition is also creating white space for certified controls and documentation-ready products that can support continuity through re-certification cycles. Bio-Rad's EU QMS certificate under IVDR (EU) 2017/746, supporting CE-IVDR marking for 40 infectious-disease molecular quality controls, points to where vendors that can carry certified portfolios can find demand for QC materials used alongside diagnostic platforms. At the same time, biopharma's move toward advanced modalities is pulling through demand for outsourced, cGMP-compliant testing capacity and related consumables. Sartorius' focus on compliant biologics testing services, including viral vectors, cell therapies, and biosimilars, highlights contract testing as both a capacity-release channel and a pull-through engine for high-value reagents, single-use sampling and handling consumables, and validated analytical workflows.
Recent Industry Developments
- July 2026: Agilent Technologies Inc. introduced Altura size exclusion chromatography (SEC) and Altura PLRP-S columns for biopharmaceutical development and production workflows. The launch expands Agilent's consumables and validated portfolio to support recurring revenue in regulated labs.
- July 2026: Bio-Rad Laboratories, Inc. launched the Vericheck ddPCR Kit portfolio for cell and gene therapy quality control (includes Mycoplasma Detection and residual DNA quantification kits). The portfolio strengthens QC tooling for gene therapy development and manufacturing. This diversification supports Bio-Rad's consumables revenue in high-growth biotherapeutics workflows.
- June 2026: Agilent Technologies Inc. completed the acquisition of Biocare Medical, a provider of clinical and research pathology solutions. The integration broadens Agilent's diagnostic and pathology presence to cross-sell instruments and reagents.


Research Methodology Framework and Report Scope
Market Definition and Coverage
This market covers revenue from laboratory instruments and routine lab disposables purchased to run testing, research, and quality control workflows across life science, clinical, and industrial labs. Amounts are measured at the point of sale to end users through direct and channel routes.
Scope exclusions: This sizing excludes general hospital supplies not used for lab workflows, household testing items, and purely in-house service labor billed separately from equipment or disposables.
Segmentation Overview
- By Product Type
- Laboratory Equipment
- Analytical Instruments
- Spectroscopy Equipment
- Chromatography Systems
- Microscopes & Imaging Systems
- Other Instruments
- General Lab Equipment
- Centrifuges & Separators
- Incubators & Ovens
- Autoclaves & Sterilizers
- Other Equipments
- Analytical Instruments
- Laboratory Disposables
- Plasticware & Glassware
- Pipettes & Tips
- Petri Dishes
- Test & Culture Tubes
- Others
- Filtration & Separation Supplies
- Membrane Filters
- Syringe & Vacuum Filters
- Centrifugal Filters
- Clean-Room Consumables
- Gloves
- Gowns & Masks
- Wipes & Swabs
- Plasticware & Glassware
- Laboratory Equipment
- By Application
- Clinical Diagnostics
- Drug Discovery & Development
- Genomics & Proteomics
- Academic & Research
- Industrial & Environmental Testing
- By End User
- Hospitals & Clinics
- Pharmaceutical & Biotechnology Companies
- Academic & Research Institutes
- Contract Research Organizations
- Geography
- North America
- United States
- Canada
- Mexico
- Europe
- Germany
- United Kingdom
- France
- Italy
- Spain
- Rest of Europe
- Asia-Pacific
- China
- Japan
- India
- Australia
- South Korea
- Rest of Asia-Pacific
- Middle East & Africa
- GCC
- South Africa
- Rest of Middle East & Africa
- South America
- Brazil
- Argentina
- Rest of South America
- North America
Data Sources, Market Sizing, and Validation
Desk Research
Desk research starts with public datasets that describe the lab demand pool and how it is shifting. We relied on sources such as the US FDA (device and diagnostic policy signals), the US CDC (testing and surveillance context), the World Health Organization, OECD health statistics, and UN Comtrade trade data to frame import reliance, broad category flows, and price direction.
We also reviewed company filings, annual reports, and investor presentations to understand portfolio mix between instruments and recurring consumables, along with association websites and reputable press for capacity expansions and product recalls. Where needed, paid subscriptions were used for company financials and intelligence, patent searching, and shipment-level import and export checks, so model inputs could be cross-verified. These sources are illustrative and not exhaustive, and many other references were used to collect, validate, and clarify data points.
Primary Interviews and Surveys
Primary work was done through expert interviews and structured surveys with lab procurement, distributors, service teams, and product specialists who cover equipment categories and high-run-rate consumables. To reduce blind spots, discussions were spread across large reference labs, mid-sized testing networks, and smaller independent labs, then cross-checked with views from manufacturing and quality labs.
A key output from interviews was confirming what gets budgeted as capital equipment versus what is treated as expensed disposable spend. Respondents also helped verify typical replacement cycles, utilization-driven reorder patterns, and observed pricing changes after major regulation updates or supply constraints.
Distribution of primary research fieldwork respondents
| Company type | Respondent position | Region |
|---|---|---|
| Top tier: 33% | CXOs: 12% | APAC: 38% |
| Mid tier: 49% | Functional/Unit leaders: 34% | EMEA: 36% |
| Smaller Players: 18% | Managers: 54% | Americas: 26% |
Market-Sizing & Forecasting
Sizing was built using both top-down and bottom-up logic, with the main structure coming from a top-down demand pool build that translates lab activity into purchase needs and spending. For laboratory equipment, the model leans on installed base expansion, replacement timing, and upgrade cycles. For disposables, the link is more directly tied to test throughput and routine lab run rates.
To keep totals realistic, outputs were corroborated with selective bottom-up approximations, including sampled average selling price ranges multiplied by likely unit volumes for common instruments, and channel checks on consumable reorder frequency. Where some categories had limited visibility in public data, gaps were handled by using conservative penetration assumptions that were then stress-tested using distributor feedback.
Forecasting used scenario analysis supported by variable-level expectations from primary experts, then applied to inputs such as pharma and biotech R&D spending direction, diagnostics test volumes, automation adoption in labs, consumable price inflation, and lead-time normalization. The final forecast was accepted only when the growth path stayed consistent with these demand indicators and with observed purchasing behavior across geographies.
Data Validation & Update Cycle
Validation was done in multiple steps so the final numbers do not depend on any single dataset. Model outputs were checked against independent signals such as trade movement direction, public budget and funding cycles for research and health programs, and revenue mix trends visible in financial disclosures.
Any large variance triggered a re-check of assumptions, for example replacement cycle length or disposable reorder rates. If the gap was driven by unclear category definitions, a second round of calls was used to clarify the boundary conditions before adjustment. Before sign-off, the work is reviewed by another analyst for arithmetic accuracy, scope consistency, and logic. Reports are refreshed annually, with interim updates when material events change pricing, supply continuity, or lab demand. A final pre-delivery pass is done so clients receive the latest view.
Mordor Intelligence's Laboratory Equipment and Disposable Market Size Versus Other Published Estimates
Published market values for laboratory equipment and disposables can vary a lot because authors do not always count the same purchase basket or the same pricing basis. Some also blend adjacent lab supply categories into a single headline number. Differences also come from how price inflation is applied, how replacement cycles are treated, and how frequently assumptions are refreshed.
The main gap comes from whether broad lab supplies such as chemicals and reagents are included. In this market, Mordor Intelligence counts only equipment and routine lab disposables, keeping pricing tied to category-specific ASP ranges validated through channel feedback, rather than using one blended spend-per-lab factor.
Benchmark comparison
| Source | Market Size | Gaps in Research Methodology |
|---|---|---|
| Mordor Intelligence | USD 40.73 B (2026) | |
| Industry Bulletin A | USD 39.20 B (2024) | Uses a different base year and a broader laboratory supplies definition that can mix in adjacent supply lines, which changes the spend pool even before forecasting assumptions are applied. |
| Research Portal B | USD 58.90 B (2025) | Appears to apply a wide scope that can bundle multiple lab supply categories and uses a long horizon with a low growth rate, which can still yield a higher base if the starting basket is wider. |
The table shows that year choice and category scope are usually the two biggest drivers of spread, followed by how prices and replacement cycles are treated in the model. By keeping the model anchored to repeatable inputs such as installed base behavior, test throughput signals, and checked ASP ranges, the resulting market size stays easier to audit and update when lab demand conditions change.


Key Questions Answered in the Report
What is the projected value of the Laboratory equipment & disposables market in 2031?
It is forecast to reach USD 58.86 billion, rising at a 7.64% CAGR between 2026 and 2031.
Which product category is expanding fastest?
Disposables lead growth, propelled by single-use bioreactor adoption and are set for a 9.54% CAGR through 2031.
Why are genomics and proteomics seeing rapid uptake in laboratories?
Higher-throughput platforms such as Illumina’s NovaSeq X and Bruker’s Timstof cut per-sample costs, boosting demand for sequencing and proteomic workflows.
How are sustainability mandates affecting purchasing decisions?
Government net-zero procurement frameworks favor energy-efficient instruments and recyclable consumables, influencing supplier selection in Europe and North America.
Which end-user segment is growing fastest?
Contract research organizations are projected to expand at a 10.43% CAGR as pharmaceutical sponsors outsource preclinical and clinical laboratory work.
Page last updated on:


 Your data is secure and never sold or shared.


