Electronic Shift Operations Management Solutions Market Size and Share
Market Overview
| Study Period | 2020 - 2031 |
|---|---|
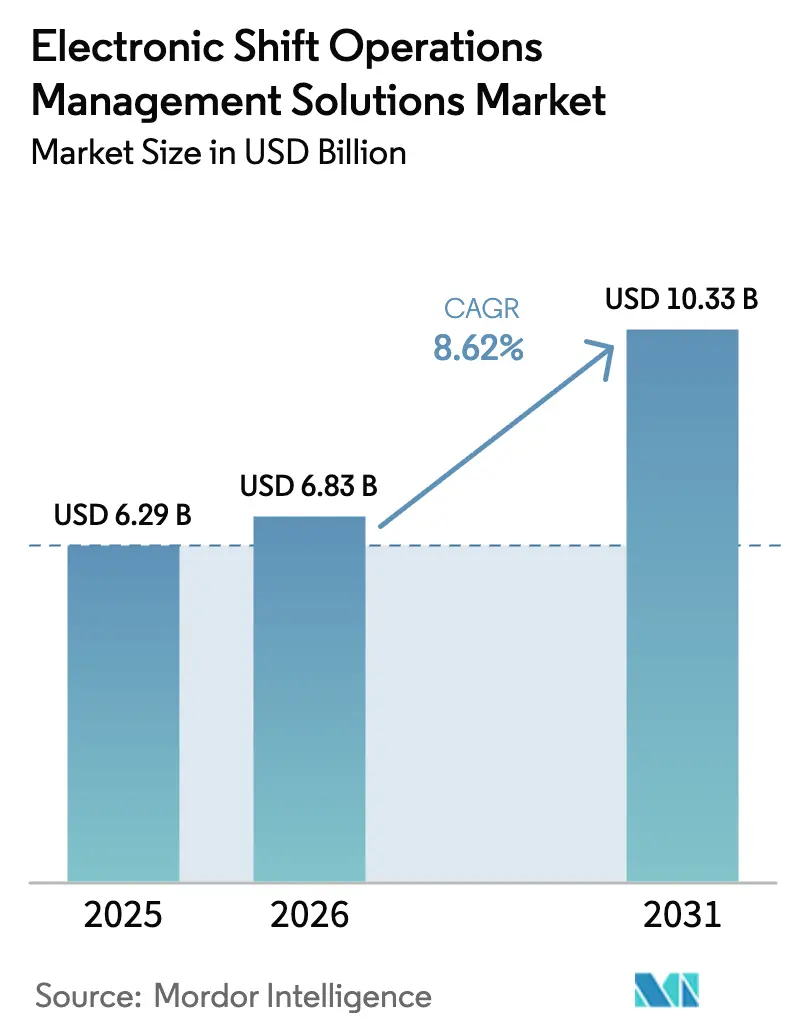
| Market Size (2026) | USD 6.83 Billion |
| Market Size (2031) | USD 10.33 Billion |
| Growth Rate (2026 - 2031) | 8.62% CAGR |
| Fastest Growing Market | Asia Pacific |
| Largest Market | North America |
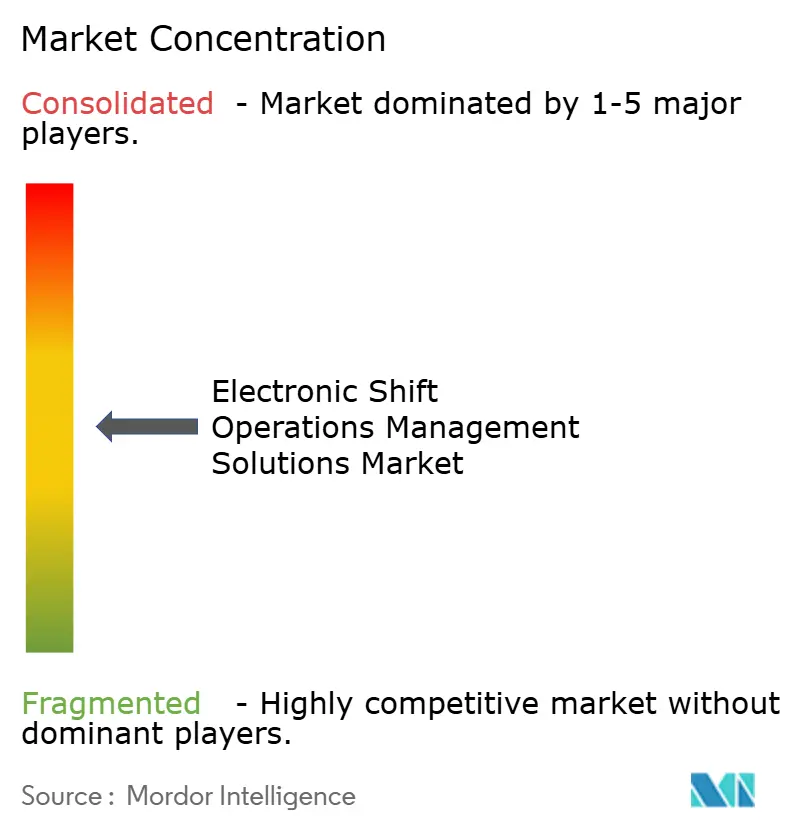
| Market Concentration | Medium |
Major Players *Disclaimer: Major Players sorted in no particular order Image © Mordor Intelligence. Reuse requires attribution under CC BY 4.0. | |
Electronic Shift Operations Management Solutions Market Analysis by Mordor Intelligence
The Electronic Shift Operations Management Solutions market size is expected to grow from USD 6.29 billion in 2025 to USD 6.83 billion in 2026 and is forecast to reach USD 10.33 billion by 2031 at 8.62% CAGR over 2026-2031. This growth is driven by the retirement of paper-based shift handovers, the fusion of operational technology with cloud-native platforms, and the push for higher safety and regulatory compliance in critical infrastructure. Large energy and utilities operators accelerate adoption by linking workforce scheduling to asset-performance data, while AI-powered predictive analytics unlock productivity gains in manufacturing and mining. Cloud deployment lowers upfront costs, yet hybrid architectures gain traction as operators safeguard sensitive operational technology data. Heightened cyber-risk in industrial control systems further prompts investment in integrated solutions that unite security with shift coordination.
Key Report Takeaways
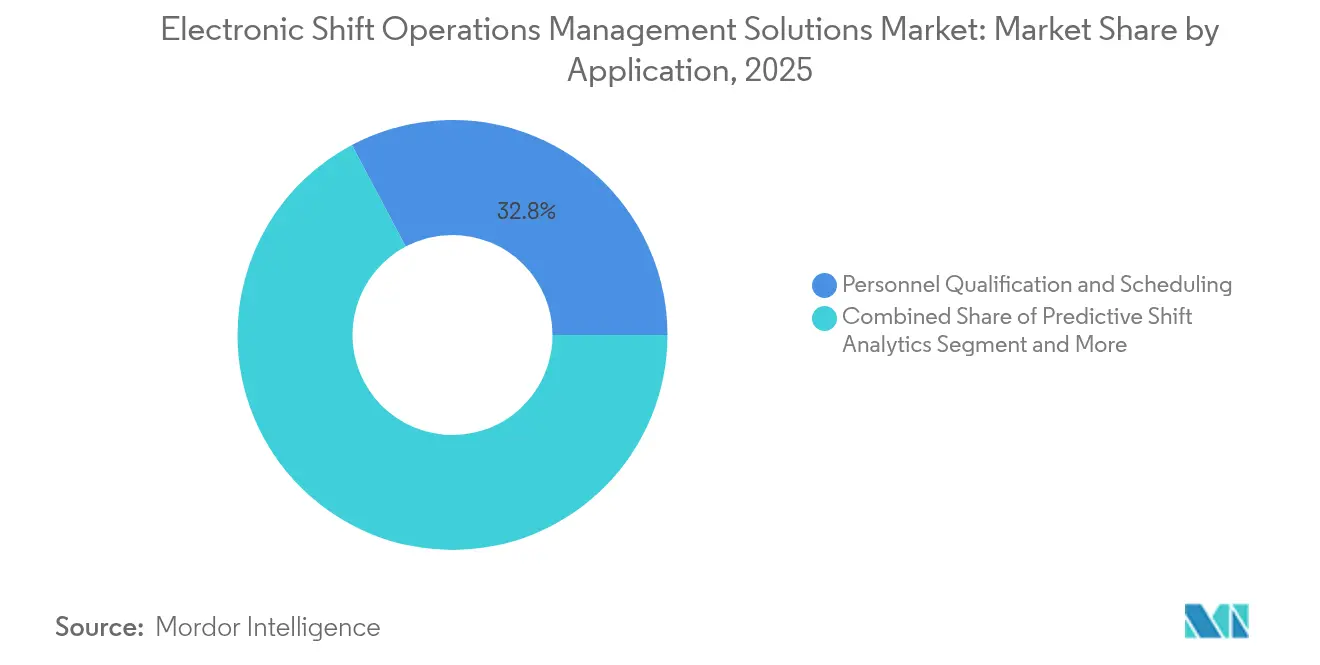
- By application, Personnel Qualification and Scheduling led with a 32.75% revenue share of the Electronic Shift Operations Management Solutions market in 2025, whereas Predictive Shift Analytics is projected to advance at an 11.05% CAGR through 2031.
- By end-user industry, oil and gas accounted for 26.65% of the Electronic Shift Operations Management Solutions market share in 2025; metals, mining, and materials are expected to grow at a 10.55% CAGR to 2031.
- By deployment mode, cloud solutions held 53.95% of the Electronic Shift Operations Management Solutions market in 2025, yet hybrid models show the quickest expansion at an 10.75% CAGR to 2031.
- By organization size, large enterprises captured 62.85% of the Electronic Shift Operations Management Solutions market value in 2025, while small and mid-sized enterprises are set to rise at an 11.25% CAGR through 2031.
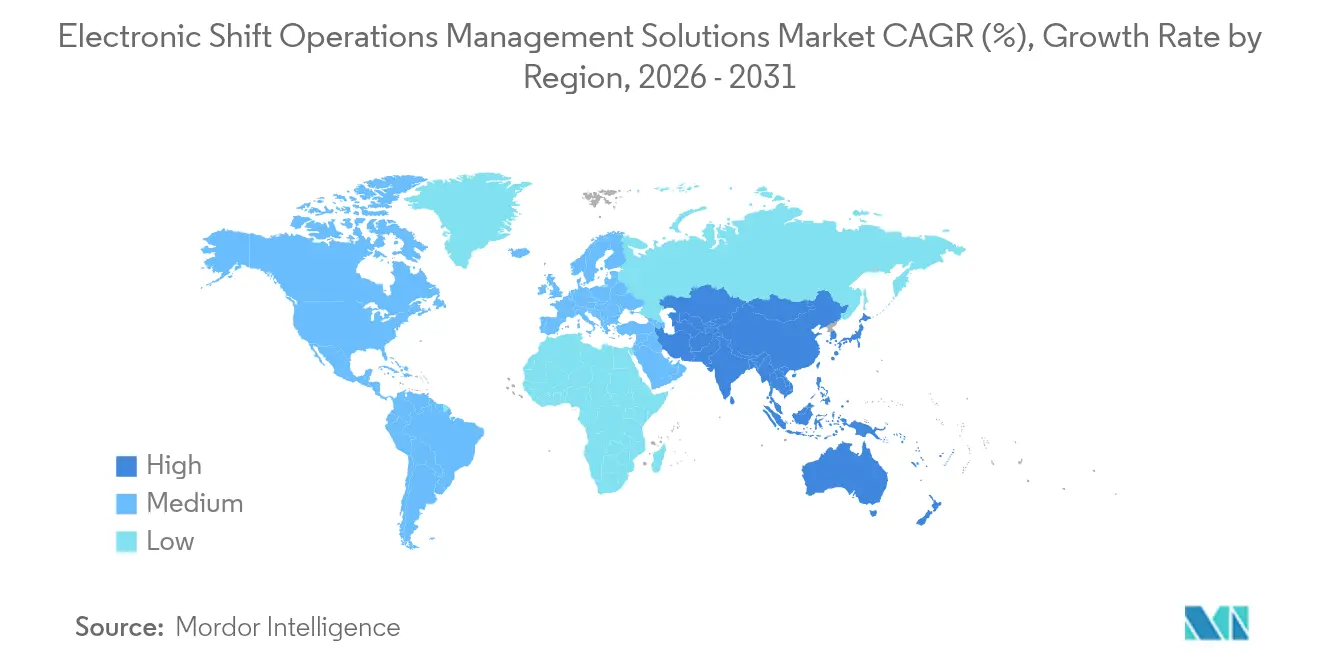
- By geography, North America commanded 36.25% of 2025 revenue, whereas Asia-Pacific is poised for an 11.05% CAGR to 2031.
Note: Market size and forecast figures in this report are generated using Mordor Intelligence’s proprietary estimation framework, updated with the latest available data and insights as of 2026.
Global Electronic Shift Operations Management Solutions Market Trends and Insights
Drivers Impact Analysis*
| Driver | ( ~ ) % Impact on CAGR Forecast | Geographic Relevance | Impact Timeline |
|---|---|---|---|
| Rising demand across energy and utilities | +2.1% | Global, with a concentration in North America and Europe | Medium term (2-4 years) |
| Automation and integration of mission-critical operations | +1.8% | Global, led by Asia-Pacific manufacturing hubs | Long term (≥ 4 years) |
| Adoption of cloud-native shift platforms | +1.5% | North America and EU, expanding to APAC | Short term (≤ 2 years) |
| Regulatory push for digital logbooks and safety compliance | +1.3% | Global, strongest in regulated industries | Medium term (2-4 years) |
| AI-driven predictive scheduling and LLM copilots | +1.2% | North America and EU early adopters, APAC following | Long term (≥ 4 years) |
| Digital-twin convergence for real-time shift analytics | +0.9% | Global, concentrated in process industries | Long term (≥ 4 years) |
| Source: Mordor Intelligence | |||
Rising Demand Across Energy and Utilities
Energy operators seek to minimize outage risk and reduce maintenance costs. Argonne National Laboratory estimates that AI-enabled grid maintenance software can cut crew visits by up to 66%. Utilities, therefore, prioritize platforms that merge workforce scheduling with asset insights to keep grids reliable amid renewable variability. Shiftboard’s energy-focused suite showcases how compliance tracking and emergency roster management are packaged for sector needs. [1]Shiftboard, “Energy Workforce Scheduling Software,” shiftboard.com These factors buoy the Electronic Shift Operations Management Solutions market as utilities retire spreadsheets in favor of real-time, rule-based scheduling.
Automation and Integration of Mission-Critical Operations
Industry 4.0 initiatives dissolve the divide between plant-floor controls and enterprise software, fueling unified shift-handover systems. PPG’s digital paint lines achieved 30% productivity gains via GE Vernova’s iFIX deployment. Bosch Connected Industry’s Shift Book demonstrates similar gains by automating data capture for operators. These examples illustrate why integrated solutions become standard in the Electronic Shift Operations Management Solutions market.
Adoption of Cloud-Native Shift Platforms
Cost-effective SaaS models open enterprise-grade tools to smaller firms. Microsoft’s patent for virtual assistant technology signals a future where conversational AI supports supervisors during shift turnover. Hybrid cloud adoption rises as operators weigh scalability against data-sovereignty rules; MIT Technology Review notes 37% of firms now favor hybrid strategies. This dynamic broadens the Electronic Shift Operations Management Solutions market user base.
Regulatory Push for Digital Logbooks and Safety Compliance
The FDA’s 2026 Quality Management System Regulation compels life-science plants to adopt electronic documentation. Sun Pharmaceuticals cut errors through AmpleLogic’s digital logbook, underscoring compliance benefits. Similar mandates in chemicals and energy reinforce demand, cementing recurring revenue in the Electronic Shift Operations Management Solutions market.
Restraints Impact Analysis*
| Restraint | (~) % Impact on CAGR Forecast | Geographic Relevance | Impact Timeline |
|---|---|---|---|
| High initial installation and switching costs | -1.4% | Global, particularly affecting SMEs | Short term (≤ 2 years) |
| Shortage of skilled technical workforce | -1.1% | Global, acute in developed markets | Medium term (2-4 years) |
| Heightened cyber-risk in critical infrastructure | -0.8% | Global, concentrated in OT environments | Long term (≥ 4 years) |
| Legacy OT/IT data-silo integration hurdles | -0.7% | Global, prevalent in established industries | Medium term (2-4 years) |
| Source: Mordor Intelligence | |||
High Initial Installation and Switching Costs
Licensing, integration, and training outlays deter budget-constrained firms. FHI Works estimates hidden warehouse labor costs can erode productivity by 40%. [2]FHI Works, “The Hidden Costs of Warehouse Labor,” fhiworks.com While SaaS models defray capital expenses, fear of disruption slows decisions, restraining immediate Electronic Shift Operations Management Solutions market uptake among smaller operators.
Shortage of Skilled Technical Workforce
Only 13% of manufacturers possess centralized operational-technology visibility, reflecting a talent gap. Cyber expertise is scarce as incidents rise 73% in industrial networks. Limited staff slows platform rollouts and underscores the need for vendor training services, tempering Electronic Shift Operations Management Solutions market growth.
*Our forecasts treat driver/restraint impacts as directional, not additive. The impact forecasts reflect baseline growth, mix effects, and variable interactions.
Segment Analysis
By Application: Personnel Qualification Anchors Predictive Analytics
Personnel Qualification and Scheduling contributed USD 2.06 billion to the Electronic Shift Operations Management Solutions market size in 2025 and remained the cornerstone because operator credentials directly influence safety. Utilities, refineries, and pharmaceutical plants leverage competency matrices to ensure staff meet evolving regulatory mandates. Kahuna’s software aligns certifications with shift rosters, preventing unqualified assignments. Coupled with automated reminders for expiring licenses, such tools reduce audit risk and downtime.
Predictive Shift Analytics, though smaller, is poised for an 11.05% CAGR. AI models adapt schedules to weather, demand, and asset-health signals, trimming overtime costs and elevating employee satisfaction. Early adopters in mining pair analytics with digital twins to forecast labor needs against haul-truck availability. This synergy enlarges the Electronic Shift Operations Management Solutions market as analysis becomes embedded within day-to-day shift planning.
Administrative and Compliance modules grow steadily by digitizing logbooks and procedure checklists, replacing binders with timestamped e-records. Tracking and Control Dashboards broaden situational awareness for supervisors, integrating alarms, KPI charts, and crew locations in one interface. Limited Condition of Operation tracking, vital in nuclear and chemical plants, gains ground as regulators demand continuous parameter logging. Vendors that deliver a unified application stack tap cross-selling synergies, reinforcing market stickiness.


By End-user Industry: Oil and Gas Leads Mining Transformation
The oil and gas sector held USD 1.68 billion of the Electronic Shift Operations Management Solutions market size in 2025, reflecting complex permit-to-work rules and hazardous conditions. Skedulo’s use in upstream operations improved safety metrics while shrinking dispatch times. Refiners embed digital shift logs into control-room consoles, linking incident data and maintenance notes to facilitate regulatory reporting.
Metals, mining, and materials are set to expand 10.55% annually as autonomous trucks and remote underground operations demand synchronized human oversight. Barrick’s Turquoise Ridge mine applied advanced scheduling to raise ore throughput, showcasing ROI for analytics-driven rosters. Chemicals, utilities, and automotive industries sustain significant adoption, each propelled by distinct compliance or lean-manufacturing imperatives.
Pharmaceutical and life-science plants invest ahead of looming GMP changes, integrating digital logbooks with electronic batch records. Military and defense users emphasize redundancy and secure offline modes, prompting ruggedized deployments. Cross-industry parallels in safety culture and traceability create avenues for horizontal platform vendors, broadening the Electronic Shift Operations Management Solutions market penetration.
By Deployment Mode: Cloud Dominance, Hybrid Upswing
Cloud deployments contributed 53.95% of 2025 revenue, equating to USD 3.39 billion in the Electronic Shift Operations Management Solutions market size. Multitenant SaaS offerings allow rapid provisioning and automatic upgrades, appealing to distributed workforces. Vendors bundle mobile apps for field technicians, cutting paperwork and allowing instant status updates.
Hybrid models grow fastest at 10.75% CAGR as operators retain telemetry on-premise yet leverage cloud analytics. Cloud Security Alliance stresses rigorous secret-management in such architectures. Nuclear plants and defense sites opt for air-gapped local instances with periodic secure replication to cloud, balancing resilience and security.
On-premise solutions persist where data-sovereignty rules or latency constraints dominate, such as maritime terminals. Suppliers, therefore, offer license portability so customers can shift workloads across deployment modes without rewriting code. This flexibility sustains Electronic Shift Operations Management Solutions' market expansion into conservative sectors.

By Organization Size: Enterprise Scale Inspires SME Momentum
Enterprises with revenue above USD 1 billion commanded 62.85% of spending in 2025, reflecting complex operations and ample budgets. Honeywell’s Connected Enterprise unit grew 20% by bundling shift management with process controls. Such firms deploy multi-site rollouts with identity-management integrations and advanced analytics layers.
Small and mid-sized enterprises, although contributing a smaller slice, represent the Electronic Shift Operations Management Solutions market’s liveliest growth at 11.25% CAGR. SaaS subscriptions and pre-configured templates lower adoption barriers. Vendors emphasize no-code workflow editors so operations managers can tailor forms without IT intervention. This democratization diffuses advanced scheduling, fostering vendor ecosystems of plug-ins and specialized content packs.
Support partners capitalize on SME demand by offering managed implementations, aligning configurations with industry norms. As success stories accumulate, peer influence accelerates uptake, further enlarging the Electronic Shift Operations Management Solutions market.
Geography Analysis
North America generated USD 2.28 billion from the Electronic Shift Operations Management Solutions market size in 2025 and maintained a 36.25% share, underpinned by rigorous OSHA, FDA, and FERC mandates. US refineries integrate digital logbooks into distributed control systems, while Canadian utilities modernize outage management with AI-assisted crew dispatch. Honeywell’s plan to split into three entities by 2026 illustrates regional specialization aimed at higher customer intimacy.
Asia-Pacific posts the steepest climb at an 11.05% CAGR, adding USD 1.56 billion to the Electronic Shift Operations Management Solutions market by 2031. Chinese factories adopt cloud scheduling as 92% of decision-makers already host workloads in the cloud. India’s chemicals sector implements hybrid models to overcome bandwidth gaps, while Japanese firms align implementations with Society 5.0 objectives. Nonetheless, IBM notes 71% of regional firms struggle to translate digital projects into value, fueling demand for integrators.
Europe follows with consistent growth, driven by Germany’s Industry 4.0 roadmaps and the United Kingdom’s pharmaceutical modernization. EU GMP Annex 1 compliance timelines hasten digital logbook rollouts in sterile plants. France’s nuclear fleet pursues resilient on-premise architectures, and Italy’s manufacturers embed shift dashboards within MES suites. South America and the Middle East and Africa show emerging momentum as mining and petrochemicals upgrade control rooms, expanding the Electronic Shift Operations Management Solutions market footprint to new frontiers.

Competitive Landscape
Competition remains moderate, with no single vendor exceeding 15% revenue share. Industrial automation leaders—Honeywell, Siemens, ABB, Schneider Electric—bundle shift management into broader control portfolios, using installed sensors and historians to create sticky ecosystems. Platform breadth, global service teams, and cybersecurity certifications differentiate these incumbents.
Specialists such as Shiftboard, UKG, ARCOS, and WorkForce Software attack niche pain points with mobile-first interfaces and vertical templates. Shiftboard’s energy edition includes call-out automation for storm response, while ARCOS integrates outage analytics for utilities. These focused offerings compel larger vendors to acquire or partner; Honeywell’s USD 2.2 billion purchase of Sundyne signals appetite for domain expertise. [4]Honeywell, “Honeywell Reports First Quarter Results; Updates 2025 Guidance,” honeywell.com
Cloud hyperscalers and ERP vendors also enter the Electronic Shift Operations Management Solutions market, embedding scheduling into enterprise suites. SAP’s Multi-Resource Scheduling deployment at Jemena showcases this trend. Microsoft invests in conversational AI patents to infuse Copilots into shift workflows, raising innovation pressure. Startups leverage AI forecasting and low-code customization to win pilot projects, targeting hybrid deployments that coexist with legacy operational technology networks.
Vendor roadmaps converge on three priorities: predictive labor demand, cyber-resilient architectures, and ESG reporting. Patent filings in these domains rise, and open-API ecosystems attract partner developers. Services revenue grows as customers seek change-management support, creating annuity streams that stabilize supplier margins within the Electronic Shift Operations Management Solutions market.
Electronic Shift Operations Management Solutions Industry Leaders
ABB Ltd.
Hexagon AB (HxGN Shift Operations)
Honeywell International Inc.
Siemens AG
Schneider Electric SE
- *Disclaimer: Major Players sorted in no particular order

Recent Industry Developments
- June 2025: Shield Technology Partners raised over USD 100 million to scale an AI-enabled managed IT service network across the United States.
- June 2025: C&S Wholesale Grocers agreed to acquire SpartanNash for USD 1.77 billion, expanding its distribution footprint to 60 centers.
- April 2025: Honeywell announced a USD 2.2 billion acquisition of Sundyne to bolster industrial automation.
- February 2025: Honeywell unveiled plans to separate its Automation and Aerospace units into standalone companies by 2026.
- January 2025: IFS reported 32% annual recurring revenue growth, topping EUR 1 billion on industrial AI demand.
- December 2024: ShiftPixy was acquired by G3 Business Services, integrating staffing workflows into G3’s platform.


Global Electronic Shift Operations Management Solutions Market Report Scope
Electronic shift operations management solution (eSOMS) ensures a high level of efficiency and sustainability by automating the manual and repetitive process of documentation, transmission of information, scheduling shifts, and other mandatory tasks.
The electronic shift operations management solutions market is segmented by application (limited condition of operation (LCO) tracking, administration, tracking and control, personnel, qualification and scheduling, and other applications), end-user (chemicals, oil & gas, military, automotive, energy & utilities, and other end-users), and geography (North America, Europe, Asia Pacific, Latin America, and Middle East & Africa).
The market sizes and forecasts are provided in terms of value (USD) for all the above segments.
| Limited Condition of Operation (LCO) Tracking |
| Administration and Compliance |
| Tracking and Control Dashboards |
| Personnel Qualification and Scheduling |
| Predictive Shift Analytics |
| Oil and Gas |
| Chemicals and Petrochemicals |
| Energy and Utilities |
| Automotive and Transportation |
| Military and Defense |
| Pharmaceuticals and Life Sciences |
| Metals, Mining and Materials |
| Other End-user Industries |
| Cloud-Based |
| On-Premise |
| Hybrid |
| Large Enterprises |
| Small and Mid-sized Enterprises (SMEs) |
| North America | United States | |
| Canada | ||
| Mexico | ||
| South America | Brazil | |
| Argentina | ||
| Chile | ||
| Rest of South America | ||
| Europe | Germany | |
| United Kingdom | ||
| France | ||
| Italy | ||
| Spain | ||
| Russia | ||
| Rest of Europe | ||
| Asia-Pacific | China | |
| India | ||
| Japan | ||
| South Korea | ||
| Singapore | ||
| Malaysia | ||
| Australia | ||
| Rest of Asia-Pacific | ||
| Middle East and Africa | Middle East | United Arab Emirates |
| Saudi Arabia | ||
| Turkey | ||
| Rest of Middle East | ||
| Africa | South Africa | |
| Nigeria | ||
| Rest of Africa | ||
| By Application | Limited Condition of Operation (LCO) Tracking | ||
| Administration and Compliance | |||
| Tracking and Control Dashboards | |||
| Personnel Qualification and Scheduling | |||
| Predictive Shift Analytics | |||
| By End-user Industry | Oil and Gas | ||
| Chemicals and Petrochemicals | |||
| Energy and Utilities | |||
| Automotive and Transportation | |||
| Military and Defense | |||
| Pharmaceuticals and Life Sciences | |||
| Metals, Mining and Materials | |||
| Other End-user Industries | |||
| By Deployment Mode | Cloud-Based | ||
| On-Premise | |||
| Hybrid | |||
| By Organization Size | Large Enterprises | ||
| Small and Mid-sized Enterprises (SMEs) | |||
| By Geography | North America | United States | |
| Canada | |||
| Mexico | |||
| South America | Brazil | ||
| Argentina | |||
| Chile | |||
| Rest of South America | |||
| Europe | Germany | ||
| United Kingdom | |||
| France | |||
| Italy | |||
| Spain | |||
| Russia | |||
| Rest of Europe | |||
| Asia-Pacific | China | ||
| India | |||
| Japan | |||
| South Korea | |||
| Singapore | |||
| Malaysia | |||
| Australia | |||
| Rest of Asia-Pacific | |||
| Middle East and Africa | Middle East | United Arab Emirates | |
| Saudi Arabia | |||
| Turkey | |||
| Rest of Middle East | |||
| Africa | South Africa | ||
| Nigeria | |||
| Rest of Africa | |||


Key Questions Answered in the Report
What is the current size of the Electronic Shift Operations Management Solutions market?
The market values USD 6.83 billion in 2026 and is projected to reach USD 10.33 billion by 2031.
Which region leads in revenue contribution?
North America holds 36.25% of revenue, driven by stringent regulatory mandates and mature automation ecosystems.
Which application segment grows fastest?
Predictive Shift Analytics is forecast to rise at an 11.05% CAGR thanks to AI-based roster optimization.
Why are hybrid deployments gaining momentum?
Hybrid models balance cloud scalability with on-premise security, expanding by 10.75% CAGR through 2031.
What restrains faster adoption among small firms?
High installation and switching costs, along with limited technical talent, slow uptake despite SaaS availability.
Which industry vertical offers the biggest growth window?
Metals, mining and materials is expected to expand 10.55% annually as autonomous and predictive operations spread.
Page last updated on:


