
Electromyography Devices Market Size and Share
Market Overview
| Study Period | 2020 - 2031 |
|---|---|
| Market Size (2026) | USD 1.34 Billion |
| Market Size (2031) | USD 1.96 Billion |
| Growth Rate (2026 - 2031) | 7.81 % |
| Fastest Growing Market | Asia-Pacific |
| Largest Market | North America |
| Market Concentration | Medium |
Major Players *Disclaimer: Major Players sorted in no particular order Image © Mordor Intelligence. Reuse requires attribution under CC BY 4.0. | |
Electromyography Devices Market Analysis by Mordor Intelligence
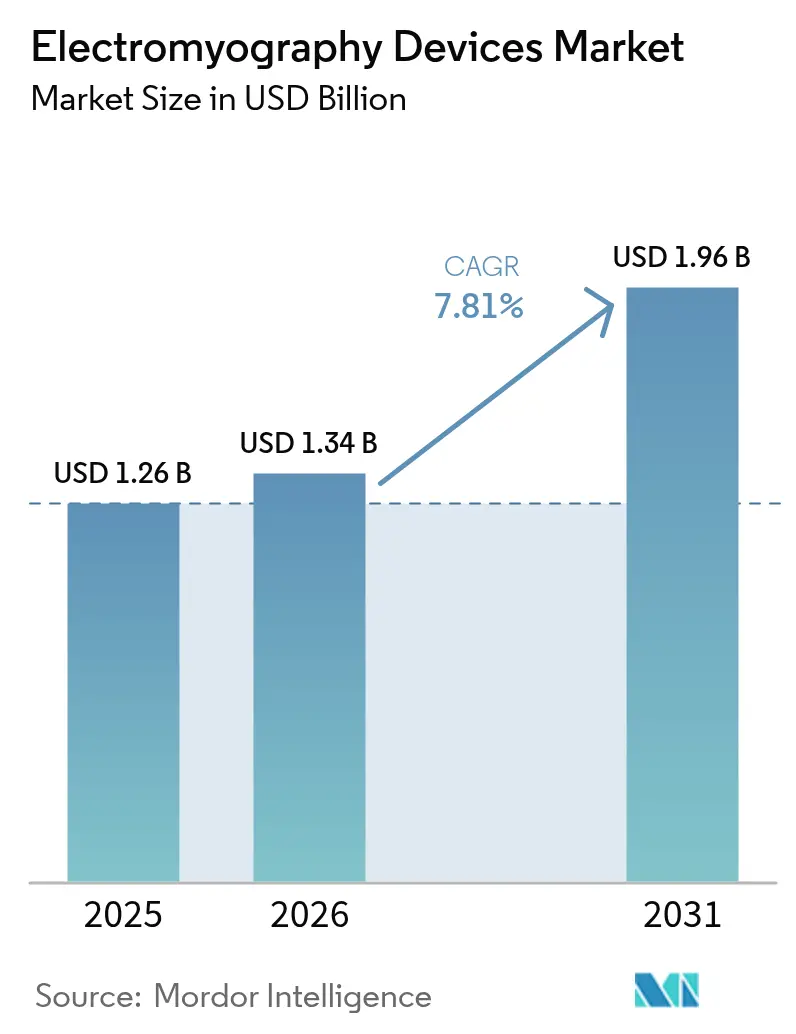
The Electromyography Devices Market size is expected to increase from USD 1.26 billion in 2025 to USD 1.34 billion in 2026 and reach USD 1.96 billion by 2031, growing at a CAGR of 7.81% over 2026-2031.
This steady climb reflects rising neurological disease prevalence, a surge in portable and AI-enabled platforms, and supportive reimbursement for remote testing. Manufacturers are embedding end-to-end encryption to counter heightened cybersecurity scrutiny, while stricter IEC 60601-2-40 safety norms are lifting the baseline for signal quality.[1] International Electrotechnical Commission, “IEC 60601-2-40:2024 Medical Electrical Equipment,” IEC, iec.chDemand is also shifting from hospital labs toward outpatient, sports, and home environments as payers reward lower-cost care pathways. Finally, China’s USD 8.8 billion hospital-modernization program and Japan’s aging-care subsidies are enlarging the buyer base across Asia-Pacific.
Key Report Takeaways
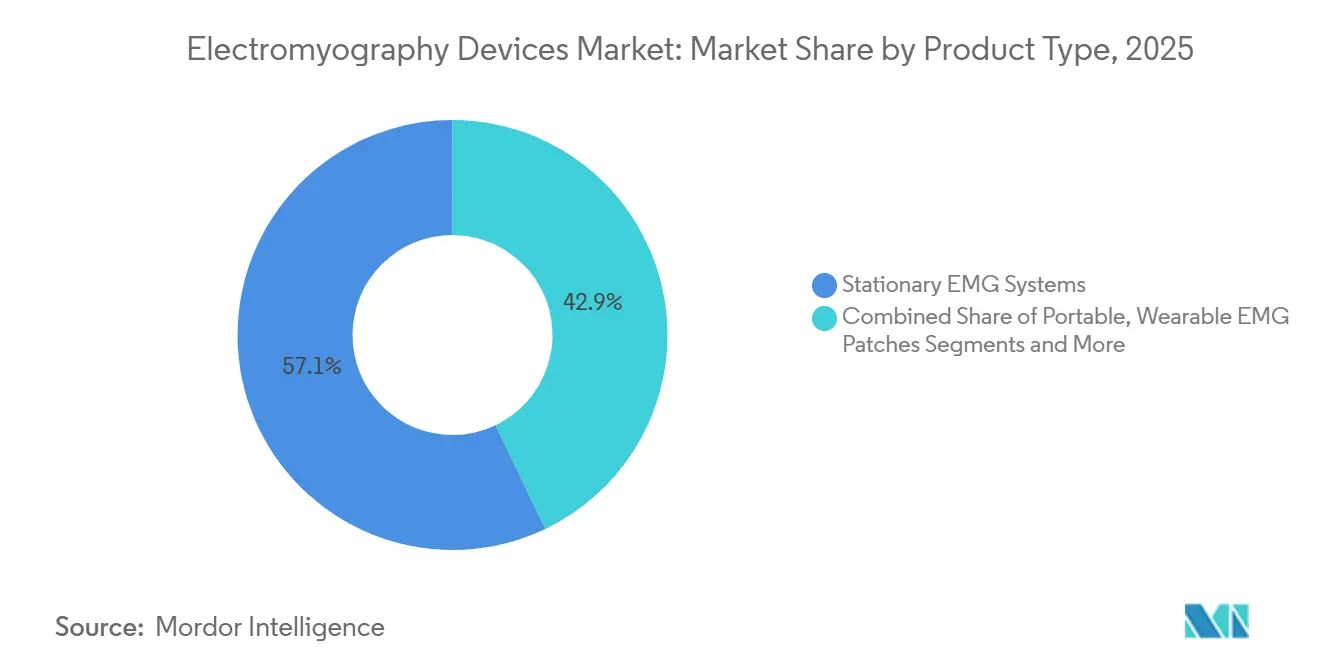
- By product type, stationary systems led with 57.11% of the electromyography devices market share in 2025, while wearable patches are forecast to grow at an 11.43% CAGR to 2031.
- By study type, surface techniques accounted for 46.52% of the electromyography devices market size in 2025; high-density arrays are advancing at a 10.25% CAGR through 2031.
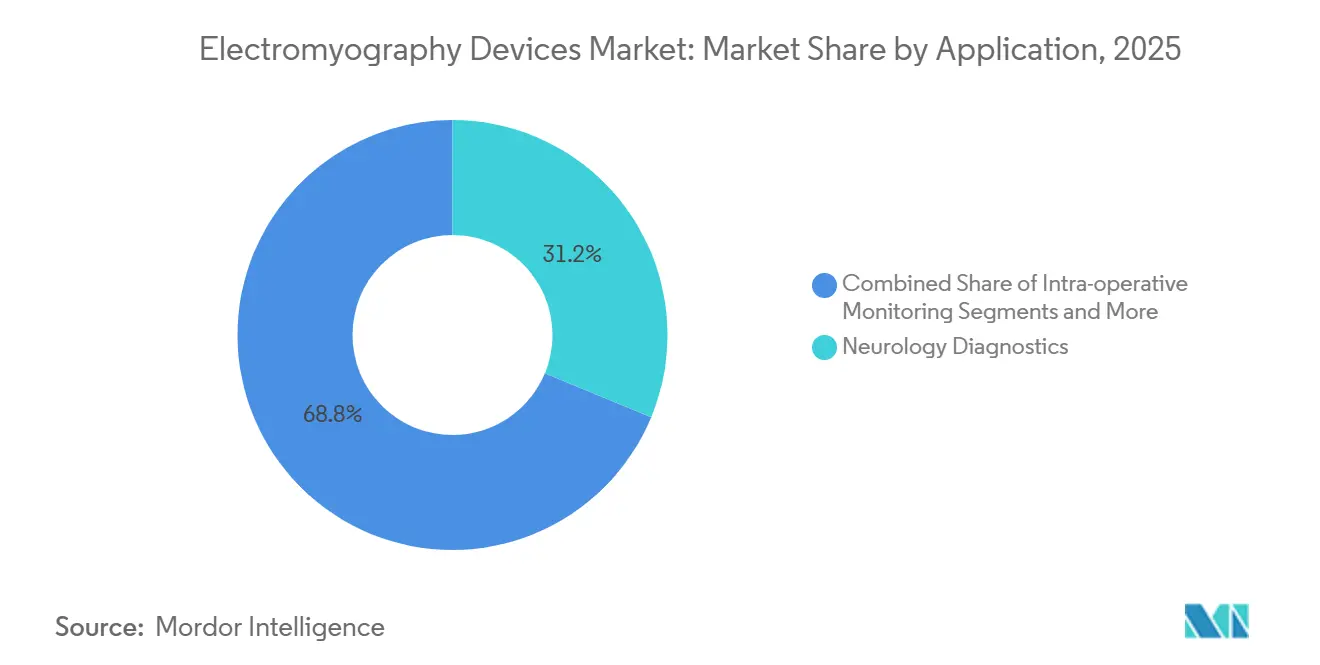
- By application, neurology diagnostics captured 31.24% revenue in 2025, whereas orthopedics and sports medicine is expanding at a 9.73% CAGR to 2031.
- By end user, hospitals commanded 54.63% of sales in 2025, yet home care settings are projected to post a 10.35% CAGR between 2026 and 2031.
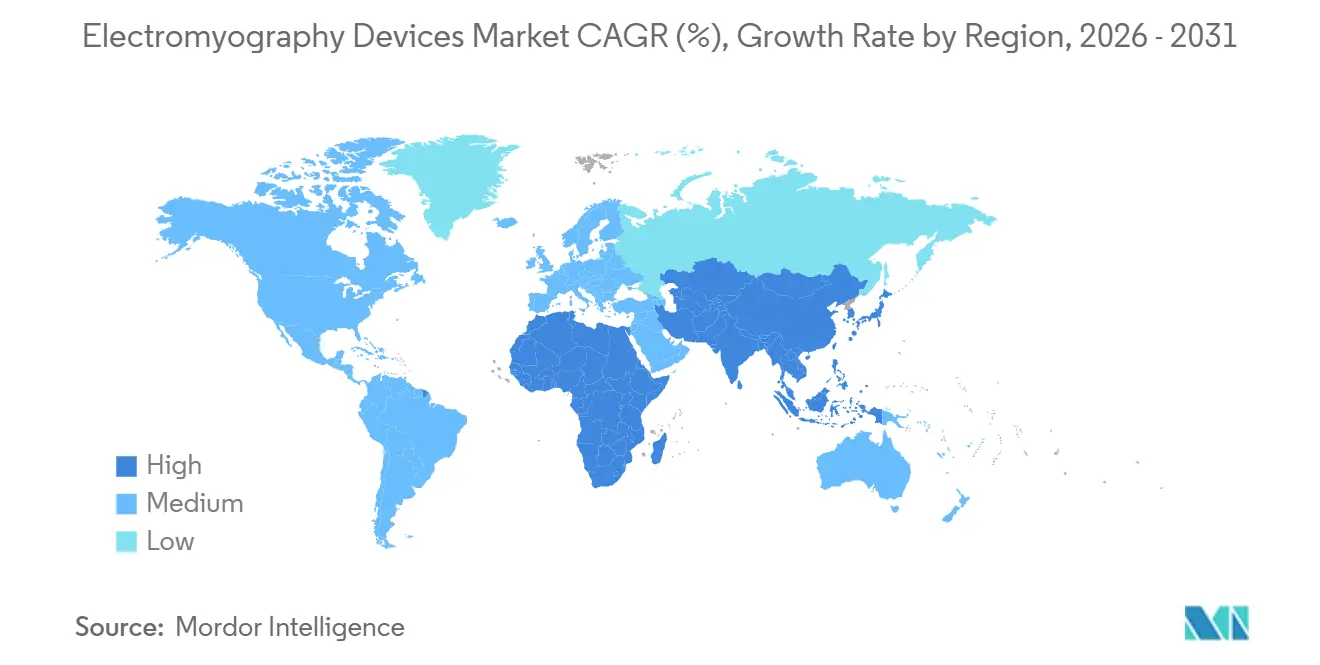
- Regionally, North America retained 39.41% share in 2025, and Asia-Pacific is set to register a 9.12% CAGR across the forecast period.
Note: Market size and forecast figures in this report are generated using Mordor Intelligence’s proprietary estimation framework, updated with the latest available data and insights as of 2026.
Global Electromyography Devices Market Trends and Insights
Drivers Impact Analysis*
| Driver | (~) % Impact on CAGR Forecast | Geographic Relevance | Impact Timeline |
|---|---|---|---|
| Rising prevalence of neuromuscular disorders | +1.4% | North America, Europe, Asia-Pacific | Long term (≥ 4 years) |
| Aging population expansion | +1.2% | Asia-Pacific core, North America spill-over | Long term (≥ 4 years) |
| Portable and wireless EMG adoption | +1.6% | North America, Europe, early Asia-Pacific | Medium term (2-4 years) |
| AI-driven automated analytics | +1.3% | Global, led by North America and key EU states | Medium term (2-4 years) |
| Elite sports performance use-cases | +0.9% | North America, Western Europe, Australia | Short term (≤ 2 years) |
| Intra-operative monitoring demand | +1.1% | North America, Europe, emerging Asia-Pacific | Medium term (2-4 years) |
| Source: Mordor Intelligence | |||
Rising Prevalence of Neuromuscular Disorders
Global cases of ALS, muscular dystrophy, and myasthenia gravis are climbing, supported by the U.S. CDC’s 12% rise in ALS prevalence between 2020 and 2024.[2]Centers for Disease Control and Prevention, “ALS Prevalence in the United States 2024 Update,” CDC, cdc.gov EMG remains the definitive test for distinguishing motor-neuron from peripheral pathologies, and clinicians now order repeat studies every 6–12 months to track disease progression. Universal-coverage markets permit easier reimbursement for follow-up testing, doubling device utilization per patient. WHO’s 2024 update lists neurological conditions at 9.4% of global DALYs, underscoring the diagnostic gap that the electromyography devices market can fill.[3]World Health Organization, “Global Burden of Disease 2024 Neurological Disorders,” WHO, who.int
Rapid Growth of the Aging Population
Japan’s over-65 cohort hit 29.1% in 2023 and is driving an 18% forecast rise in neurodegenerative disease by 2030. China plans 15,000 new neurology beds by 2028, each budgeted for at least one stationary EMG console. Concentrated demand pockets in Northeast Asia and Southern Europe reward vendors that localize manuals and expand service footprints. South Korea’s regulator approved 14 new device models in 2024, illustrating momentum among domestic producers.
Technology Shift to Portable & Wireless Systems
FDA clearance of Soterix Medical’s battery-powered MEGA-IOM unit demonstrated regulatory comfort with cable-free intra-operative monitoring. Hospitals cutting capital budgets can now acquire portable rigs for USD 30,000–50,000 versus USD 80,000-plus for full consoles. Low-energy Bluetooth and Wi-Fi 6E allow multi-channel data to flow straight to EHRs, trimming transcription errors and accelerating billing. Compumedics pivoted R&D toward hybrid cloud-linked portables after 22% year-on-year revenue growth in 2024
Integration of AI-Driven Analytics
Convolutional neural networks reached 94% sensitivity in detecting abnormal waveforms, matching expert review while cutting interpretation time. Vendors now bundle software-as-a-service layers that supply real-time reporting, trend charts, and remote consultations. EU MDR rules require traceable algorithm updates, pushing suppliers to maintain active post-market surveillance.
Restraints Impact Analysis*
| Restraint | (~) % Impact on CAGR Forecast | Geographic Relevance | Impact Timeline |
|---|---|---|---|
| High capital and maintenance costs | -0.8% | Emerging Asia, MEA, South America | Medium term (2-4 years) |
| Shortage of trained electro-diagnostic staff | -0.6% | Rural North America, parts of Asia-Pacific | Long term (≥ 4 years) |
| Data-privacy and cyber-security risks | -0.5% | North America, Europe, heightened China scrutiny | Short term (≤ 2 years) |
| Motion-artifact and noise issues | -0.4% | Global, especially uncontrolled out-of-lab environments | Medium term (2-4 years) |
| Source: Mordor Intelligence | |||
High Capital and Maintenance Costs
Advanced consoles can cost up to USD 150,000, exceeding many regional-hospital budgets. Brazil directed only 18% of its USD 42 million neurology spend to EMG in 2024, channeling the rest to MRI and CT. Certified pre-owned programs from Natus and Nihon Kohden—priced 40% below new—are one workaround, already validated by Argentina’s 2025 approvals for six refurbished models.
Shortage of Trained Professionals
The U.S. needs 1,200 additional board-certified electromyographers, and 62% of counties lack any electrodiagnostic lab. Germany logged a fall in certification completions, mirroring a wider European drift toward more lucrative subspecialties. Task-shifting to technologists and India’s six-month diploma program aim to relieve bottlenecks.
*Our forecasts treat driver/restraint impacts as directional, not additive. The impact forecasts reflect baseline growth, mix effects, and variable interactions.
Segment Analysis
By Product Type: Wearables Challenge Stationary Dominance
Stationary consoles retained 57.11% of the electromyography devices market share in 2025, buoyed by multi-modal capability and high throughput in hospital neuro-labs. They continue to anchor the electromyography devices market size for comprehensive diagnostics, yet their growth is modest as capital budgets tighten. Wearable patches, priced below USD 200 each, are clocking an 11.43% CAGR and are reshaping the electromyography devices market by enabling continuous monitoring in sports and home settings. Portable eight- to sixteen-channel units occupy a strategic middle ground, especially in outpatient and ambulatory theatres where space is scarce. Integrated EMG-EEG rigs serve sleep-medicine and epilepsy researchers, commanding premium prices but remaining a niche.
Accelerating adoption of portability plays to ambulatory centers that lack floor space for large carts. Compumedics noted 22% growth in portable sales during 2024, validating a shift toward laptop-sized amplifiers. Next-generation stationary systems now feature swappable modules, letting buyers scale channel counts without entire replacements, while wearables benefit from algorithmic denoising that lifted concordance with clinical consoles to 88% in 2024 trials. Sustainability pressures in Europe further favor modular upgrades over wholesale turnover.



By Study Type: High-Density Arrays Gain Research Traction
Surface methods held 46.52% share in 2025 because they are painless and quick, especially for gait and rehab assessment. High-density arrays, however, are growing 10.25% annually as universities and start-ups chase granular motor-unit data. Such systems contribute disproportionately to the electromyography devices market size through higher unit prices and service contracts. Needle EMG remains irreplaceable for radiculopathy and myopathy diagnosis, and is bundled with nerve-conduction studies that insurers reimburse separately.
Commercial availability of 64- to 256-channel grids, priced USD 5,000–15,000, cuts procurement hurdles for research labs. Surface EMG’s role is stable as wearables absorb some share yet still use surface electrodes. Diabetes screening programs in India and China are expanding nerve-conduction volumes, further lifting procedural demand. FDA Class II classification keeps regulatory barriers low, accelerating market entry for both high-density and surface devices.
By Application: Orthopedics Outpaces Traditional Neurology
Neurology diagnostics made up 31.24% of 2025 revenue, yet orthopedics and sports medicine is rising faster at a 9.73% CAGR, propelled by performance optimization and injury prevention. This surge is enlarging the electromyography devices market as teams integrate real-time muscle-fatigue analytics into training regimens. Intra-operative monitoring commands high unit prices and reduces complication rates in minimally invasive spine surgery, while pain-management and rehab settings leverage EMG biofeedback to document functional gains.
Elite sports bodies reported 19% fewer hamstring re-injuries after adopting wearable EMG, signaling tangible clinical and commercial value. Prosthetics research and brain–computer interface development, though smaller in direct revenue, spur innovation that feeds back into mainstream clinical products. Payers increasingly reimburse EMG-guided botulinum injections, enlarging procedural revenue streams and raising utilization among neurology and pain specialists.
By End User: Home Care Disrupts Hospital-Centric Models
Hospitals generated 54.63% of 2025 sales, but home settings are projected to grow at 10.35% annually thanks to telehealth reimbursement and smartphone-linked patches. Clinics remain the go-to venue for routine follow-ups, while ambulatory surgical centers adopt portable monitors to keep same-day procedures within safety margins. Sports rehab centers charge USD 150–300 per session, a more affordable alternative to hospital rates, captivating employer-sponsored wellness schemes and self-pay athletes.
Zynex shipped 12,000 home-use patches in 2024, underlining how consumer-friendly form factors can deepen penetration outside traditional channels. FDA guidance confirms that battery-powered intra-operative systems need no extra clearance when based on approved predicates, easing adoption in outpatient theatres. As portable units now replicate 80% of stationary capability at one-third the price, hospitals face gradual share erosion, pushing them toward advanced multi-modal consoles for complex cases.
Geography Analysis
North America held 39.41% share in 2025 on the back of Medicare reimbursement for nerve-conduction studies, a mature electrodiagnostic lab network, and 23 FDA device clearances in 2024. Canada widened coverage for home-based EMG, targeting remote ALS patients, while Mexico’s private chains upgraded neuro labs despite public-sector fiscal pressure. Competitive rivalry is concentrated, with Medtronic, Natus, and Cadwell controlling most hospital tenders, and Delsys and Noraxon carving sports and research niches.
Asia-Pacific is forecast to register the fastest CAGR at 9.12%, propelled by China’s USD 8.8 billion infrastructure drive and Japan’s subsidies for 200 municipal hospitals. India earmarked USD 120 million for neurology equipment, 40% of which targets EMG. South Korea exported USD 4.2 billion in medical devices, including EMG systems, underscoring rising regional manufacturing capability. Australia’s sports-science ecosystem drives incremental demand, while Southeast Asian markets prioritize cost-efficient portables for rural outreach.
Europe occupies a solid mid-tier position. Germany approved 18 new EMG products in 2024, and France widened reimbursement for EMG-guided botulinum injections. The U.K. launched a pilot to deploy wearable EMG in physiotherapy centers. In the Middle East and Africa, GCC states allocated USD 1.8 billion to health infrastructure, spotlighting neuro-centers of excellence. South Africa’s private hospitals adopt portable EMG for spine surgery, whereas public uptake is budget-limited. South America remains modest; Brazil bought 340 systems in 2024, yet Argentina favors refurbished units amid fiscal constraints.

Regulatory Landscape
Electromyography (EMG) systems are regulated as medical electrical equipment and must meet country-specific device rules alongside electrical safety and performance standards. In the United States, EMG devices are commonly regulated as Class II devices and are typically commercialized through the 510(k) pathway under FDA oversight. For manufacturers selling into the US, a key compliance shift is the FDA Quality Management System Regulation (QMSR), effective February 2, 2026, which incorporates ISO 13485:2016 by reference and raises the bar for harmonized quality-system documentation and audit readiness.
In Europe, market access depends on conformity with the EU Medical Device Regulation (MDR 2017/745) and notified body certification, which has become a gating factor for portfolio continuity and new introductions. On the standards side, IEC 60601-2-40:2024 (published December 20, 2024) replaces the 2016 edition for electromyographs and evoked response equipment, requiring updated verification and technical documentation for elements such as constant voltage stimulators. These changes push vendors to refresh test evidence and post-market processes, while aligning hardware and software releases to updated safety and performance expectations.
Value Chain Analysis
The EMG devices value chain starts with raw materials (metals, polymers, adhesives) and specialized consumables (surface electrodes, needle electrodes, cables), then moves into sensor and electrode manufacturing, analog front-end electronics (high-gain amplifiers, filters), microcontrollers, and wireless modules for portable and wearable formats. Device assembly and systems integration combine acquisition hardware with stimulators and accessories, followed by calibration, verification testing, and certification against relevant electrical safety and quality requirements. A large share of value creation sits in embedded firmware and proprietary software that performs denoising, artifact suppression, feature extraction, reporting, and connectivity to EHR and cloud environments.
Go-to-market commonly splits between direct sales and service teams for hospital tenders and intra-operative monitoring accounts, and distributors or channel partners for clinics, sports science labs, and rehabilitation providers. After-sales activities (training, preventive maintenance, consumables replenishment, software updates, and cybersecurity hardening) represent a meaningful lifecycle revenue stream and shape renewals and upgrades. Bottlenecks arise from single-source dependencies for high-fidelity sensors and electrodes, and from compliance workload for connected software releases, prompting vendors to diversify qualified suppliers while tightening traceability across hardware lots and algorithm updates.
Competitive Landscape
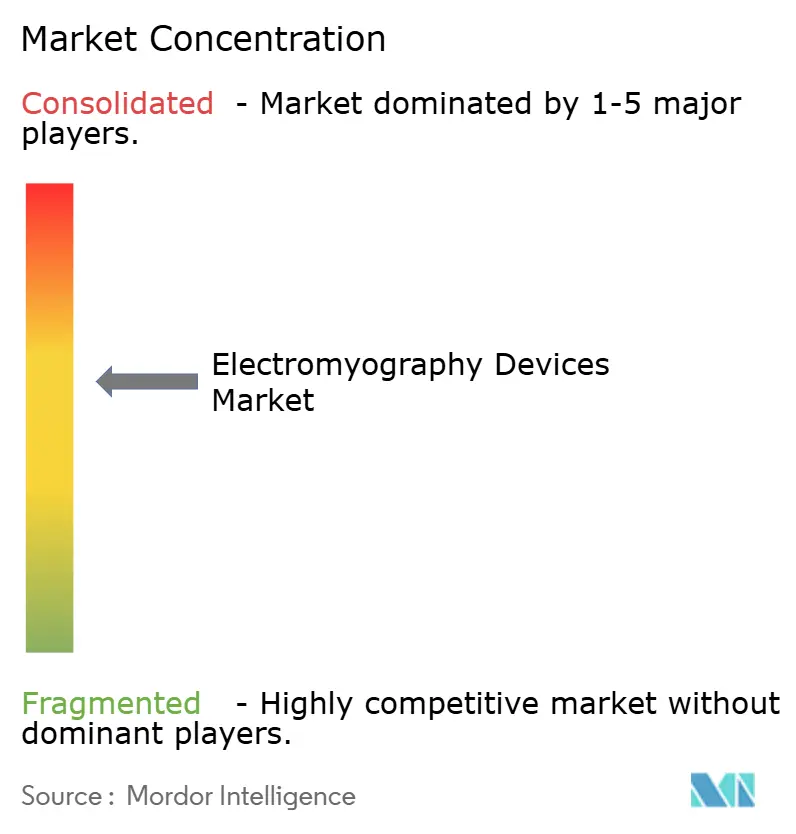
The electromyography devices market is moderately concentrated. These firms leverage installed bases, multi-year service pacts, and bundled nerve-conduction modules. Niche specialists such as Delsys, Noraxon, and Zynex compete on wearables, sports analytics, and home-care patches, respectively. Competition is shifting toward integrated software ecosystems that lock users into proprietary analytics and cloud storage.
Open-source datasets like MIT’s 500-subject release lower R&D barriers for academic spin-offs, intensifying rivalry in research and athletic segments. Compliance with the 2024 edition of IEC 60601-2-40 raises certification costs, giving incumbents an advantage, while ISO 27001 credentials are emerging as a procurement differentiator post-ransomware unrest. Patent filings focus on adaptive noise cancellation and electrode design; Compumedics submitted four such patents in 2024. White-space innovation is evident in pediatric miniaturization, robotic-surgery integration, and longitudinal disease tracking, each promising premium pricing for early movers.
Electromyography Devices Industry Leaders
Natus Medical Incorporated
Medtronic plc
Nihon Kohden Corporation
Cadwell Industries Inc.
Compumedics Limited
- *Disclaimer: Major Players sorted in no particular order

Market Opportunities and Future Outlook
A near-term opportunity is expanding EMG sensing beyond standalone neurodiagnostic labs into perioperative and bedside neuromuscular monitoring workflows, where procurement is often tied to broader patient-monitor ecosystems. In May 2026, Senzime received FDA 510(k) clearance for the TetraGraph Neuromuscular Transmission Monitor and associated sensors and accessories. In June 2026, its technology was promoted through Fukuda Denshi USA availability messaging for next-generation neuromuscular monitoring. Together, these moves point to an addressable whitespace for vendors that can package EMG-based neuromuscular assessment with hospital IT integration, consumable sensor pull-through, and workflow-friendly analytics.
A second opportunity cluster sits in wearable EMG and objective rehabilitation measurement, supported by active programs and publishable validation of analytics rather than purely hardware refresh cycles. Myontec reported ongoing participation (July 2026) in the Horizon Europe H2TRAIN project (running to 2027) on wearable EMG biosensors, AI, and smart textiles. In 2026, peer-reviewed research continued to demonstrate machine learning-based EMG scoring for rehabilitation exercise quality and EMG-driven rehabilitation concepts. These signals support product roadmaps that combine portable acquisition with software layers such as remote review, longitudinal tracking, and standardized outcome metrics, while driving demand for clinically credible denoising, data governance, and update-controlled algorithm pipelines under tightening MDR and quality-system expectations.
Recent Industry Developments
- May 2026: Senzime AB received FDA 510(k) clearance (K261098, decision date May 22, 2026) for the TetraGraph neuromuscular transmission monitor and associated sensors/accessories, expanding US-market access for EMG-based neuromuscular monitoring. The clearance supports broader integration of EMG sensing into perioperative monitoring workflows and strengthens competitive positioning for vendors with hospital connectivity and consumables strategies.
- December 2025: Wearable Devices Ltd. secured an Israel Innovation Authority grant to run a clinical pilot with Soroka University Medical Center. The funding underpins clinical evidence generation for wearable sensing approaches, which can accelerate pathway design for product validation and payer-facing outcomes in home and outpatient settings.
- August 2025: Nox Medical rolled out the Nox SAS system in the United States, extending access to advanced EEG capabilities for sleep-study environments that also use EMG channels in multi-parameter diagnostics. The launch reinforces vendor efforts to bundle neurophysiology modalities and software into unified platforms that simplify deployment across labs and ambulatory sites.


Research Methodology Framework and Report Scope
Market Definition and Coverage
This market covers the revenues generated from electromyography (EMG) devices used to record and analyze muscle electrical activity for diagnosis, monitoring, and related clinical or research use, across the major regions.
Scope exclusions: Excludes treatment-focused electrical stimulation therapies, general rehabilitation equipment without EMG measurement, and pure software services sold without an EMG device.
Segmentation Overview
- By Product Type
- Stationary EMG Systems
- Portable EMG Systems
- Wearable EMG Patches
- Integrated EMG-EEG Systems
- By Study Type
- Surface EMG
- Needle EMG
- High-density EMG
- Nerve Conduction Studies
- By Application
- Neurology Diagnostics
- Intra-operative Monitoring
- Orthopedics & Sports Medicine
- Pain Management & Rehabilitation
- Others
- By End User
- Hospitals
- Clinics
- Ambulatory Surgical Centers
- Sports Rehab Centers
- Home Care Settings
- Academic & Research Institutes
- By Geography
- North America
- United States
- Canada
- Mexico
- Europe
- Germany
- France
- United Kingdom
- Italy
- Spain
- Rest of Europe
- Asia-Pacific
- China
- Japan
- India
- South Korea
- Australia
- Rest of Asia-Pacific
- Middle East & Africa
- GCC
- South Africa
- Rest of Middle East & Africa
- South America
- Brazil
- Argentina
- Rest of South America
- North America
Data Sources, Market Sizing, and Validation
Desk Research
Desk research starts with mapping EMG testing and monitoring demand, and then matching that demand to how EMG devices are typically purchased and used. We rely on public and official sources such as the US FDA device databases, the US Centers for Disease Control and Prevention (CDC), the World Health Organization (WHO), and the OECD health statistics to anchor procedure drivers and care settings.
Next, we add broader context using peer reviewed neurology and clinical neurophysiology journals, trade association publications, hospital and ambulatory care statistics, and company filings and investor presentations to check product mix and channel commentary. A few paid subscriptions are used only to standardize company financials, track news and regulatory events, and cross-check patent activity for EMG sensing and signal processing. This list is not exhaustive, and we also used other public sources to collect data, validate assumptions, and clarify unclear points.
Primary Interviews and Surveys
Primary work is used to confirm what is actually counted as an EMG device sale in practice, and how pricing and replacement cycles move across care settings. We spoke with a mix of device manufacturers, distributors, hospital and clinic users, and neurodiagnostic professionals across APAC, EMEA, and the Americas, then used their inputs to test our usage rates, average selling prices, and adoption timing assumptions.
Distribution of primary research fieldwork respondents
| Company type | Respondent position | Region |
|---|---|---|
| Top tier: 26% | CXOs: 12% | APAC: 48% |
| Mid tier: 59% | Functional/Unit leaders: 39% | EMEA: 33% |
| Smaller Players: 15% | Managers: 49% | Americas: 19% |
Market-Sizing & Forecasting
Sizing uses a top-down demand pool approach where procedure and care-setting signals are translated into device need, then converted into value using realistic price bands. For EMG, the model is guided by variables such as neurology and musculoskeletal diagnostic volumes, installed base replacement timing, the mix shift toward portable and wearable systems, typical add-on sales for electrodes and related consumables, and the pace of uptake in ambulatory and sports rehabilitation settings.
Those totals are corroborated with selective bottom-up approximations, including sampling supplier revenues, running channel checks on system shipments, and applying ASP x unit ranges for key product groups to see if the implied volumes are consistent. When bottom-up pieces are missing for smaller countries, gaps are handled through proxy indicators like healthcare spend, specialist availability, and regional adoption patterns discussed in interviews, then normalized back to the global total.
For forecasting, we use multivariate regression with scenario checks so the forward path is not driven by one single growth assumption. Inputs are projected using a mix of historical series and expert consensus on trends such as diagnosis access expansion, technology upgrades (including integrated EMG setups), and reimbursement stability. We then stress-test outcomes for optimistic and conservative adoption curves.
Data Validation & Update Cycle
Validation is done through multiple checks that look for mismatches between model outputs and independent market signals, and then reworking assumptions until the variance is explainable. We review regional splits against care delivery footprints, compare implied unit growth with realistic replacement cycles, and flag any sudden ASP swings that do not match purchasing behavior described in interviews.
Before sign-off, the model and narrative go through step-by-step analyst reviews, and follow-up calls are triggered when a major output is sensitive to one assumption such as utilization or price. Reports are refreshed annually, with interim updates when material events occur, such as regulatory shifts or major product rollouts. Right before delivery, we complete a fresh pass so clients receive the most current view available at that time.
Mordor Intelligence's Electromyography Devices Market Size Measured Against Other Published Estimates
Published EMG device market numbers can differ even when the same end use is being discussed, because counted items and the year of measurement are not always aligned. Differences in whether consumables are bundled, how portable and wearable systems are treated, and how currency conversion is timed can all change the final value.
Evoked potential systems are kept outside Mordor Intelligence's EMG devices scope, which tends to reduce the total versus estimates that pool multiple neurodiagnostic modalities under one device bucket. Some sources also appear to assume faster ASP expansion for portable systems without tying it back to tender pricing or hospital budget cycles, and others are not clear on whether electrodes and recurring accessories are included in device revenue or treated as separate supply line items.
Benchmark comparison
| Source | Market Size | Gaps in Research Methodology |
|---|---|---|
| Mordor Intelligence | USD 1.26 B (2025) | |
| Global Consultancy A | USD 2.11 B (2024) | Uses a broader neurodiagnostic device lens in its segment framing and can bundle adjacent test systems with EMG, which inflates the addressable value relative to a device-only EMG definition. The base year is also earlier, and disclosed pricing logic by setting is limited, which can push ASP assumptions upward. |
| Industry Publisher B | USD 1.17 B (2024) | Shows a lower starting value that likely reflects a narrower product capture, with less clarity on whether portable and wearable EMG formats are fully counted across regions. Its slower growth profile suggests conservative adoption timing and limited adjustment for mix shift toward higher priced portable systems. |
The comparison shows that the spread is mostly explained by what gets counted as an EMG device sale and how pricing is carried forward year to year. By keeping the scope anchored to EMG specific systems and then checking the totals against procedure-related demand signals and realistic price bands, our estimate stays traceable to practical inputs that can be revisited and updated.


Key Questions Answered in the Report
What is the 2026 value of the electromyography devices market?
The electromyography devices market size reached USD 1.34 billion in 2026.
How fast is the market expected to grow through 2031?
It is forecast to post a 7.81% CAGR from 2027 to 2031.
Which product segment is growing the quickest?
Wearable EMG patches are projected to expand at 11.43% annually through 2031.
Why is Asia-Pacific considered the fastest expanding region?
Government funding in China, Japan, and India plus local manufacturing are driving a regional CAGR of 9.12%.
What key factor restrains adoption in emerging markets?
High capital costs for advanced consoles, often exceeding USD 80,000, limit uptake in budget-constrained hospitals.
How are vendors addressing data-security concerns?
Suppliers are embedding ISO 27001-compliant encryption and zero-trust frameworks following high-profile ransomware attacks.
Page last updated on:


 Your data is secure and never sold or shared.


