
Electroactive Polymer Market Size and Share
Market Overview
| Study Period | 2020 - 2031 |
|---|---|
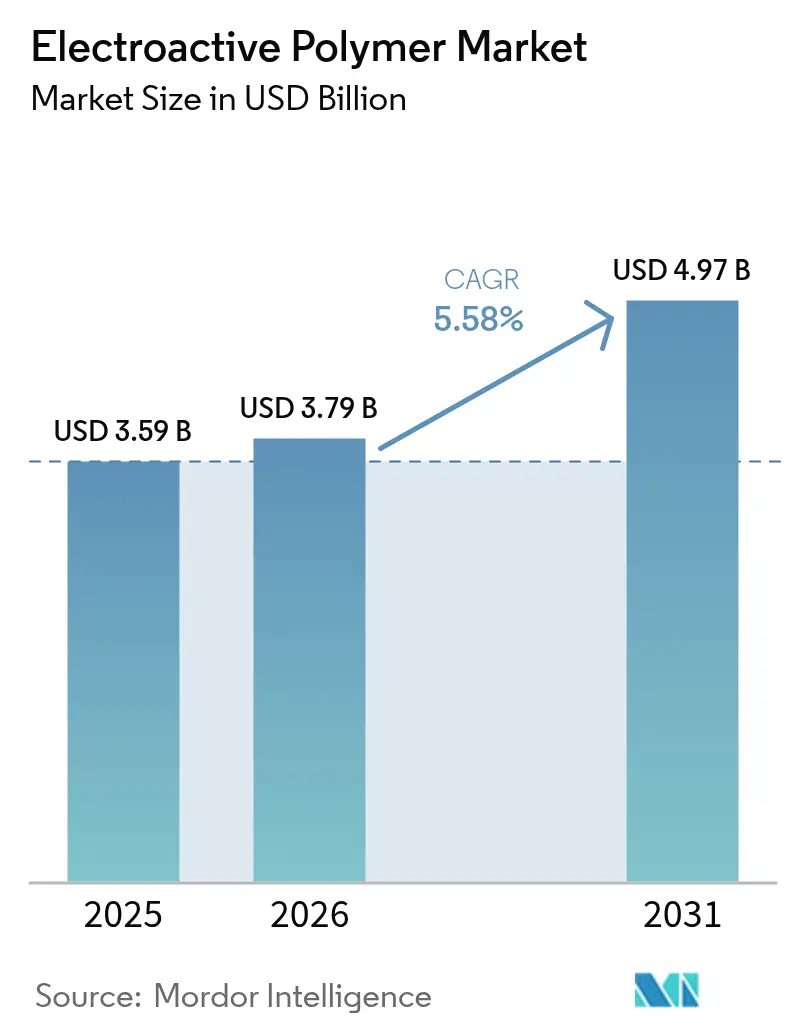
| Market Size (2026) | USD 3.79 Billion |
| Market Size (2031) | USD 4.97 Billion |
| Growth Rate (2026 - 2031) | 5.58 % |
| Fastest Growing Market | Asia Pacific |
| Largest Market | North America |
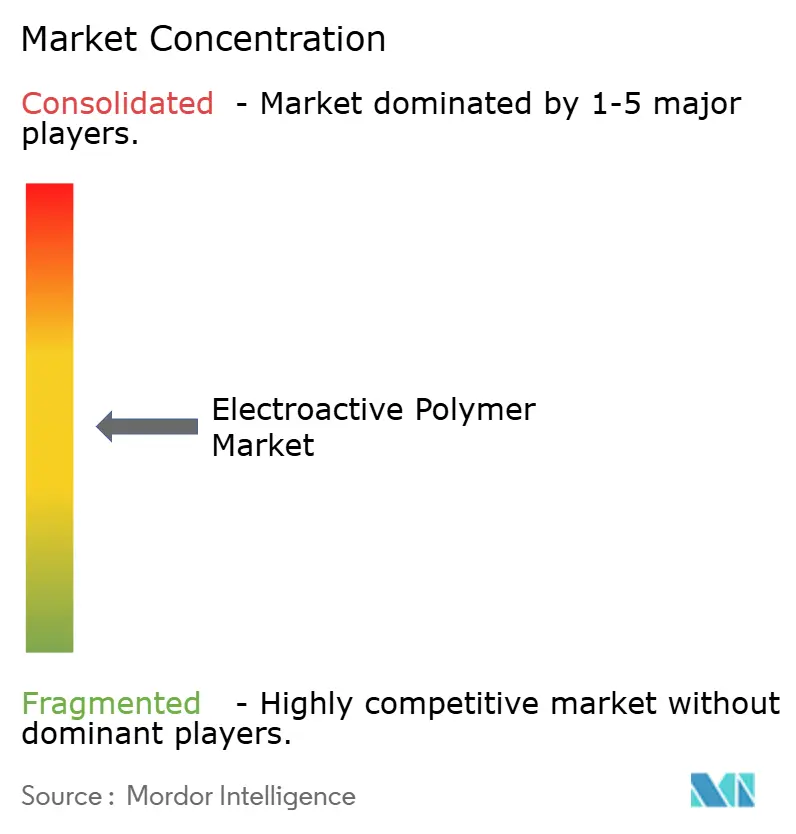
| Market Concentration | Medium |
Major Players *Disclaimer: Major Players sorted in no particular order Image © Mordor Intelligence. Reuse requires attribution under CC BY 4.0. | |
Electroactive Polymer Market Analysis by Mordor Intelligence
The Electroactive Polymer Market size was valued at USD 3.59 billion in 2025 and estimated to grow from USD 3.79 billion in 2026 to reach USD 4.97 billion by 2031, at a CAGR of 5.58% during the forecast period (2026-2031). Demand momentum stems from consumer electronics miniaturization, electric-vehicle lightweighting, remote healthcare monitoring, and defense-sector soft-robotics procurement. Conductive plastics, films, and actuator-grade materials dominate early adoption because they align with established production lines that favor cost-effective processing and rapid design cycles. Regional growth differentials mirror manufacturing footprints: North America leverages defense and medical spending, Asia-Pacific benefits from massive electronics output, and Europe catalyzes sustainable polymer innovation.
Key Report Takeaways
- By type, conductive plastics captured 40.68% of electroactive polymer market share in 2025 while inherently conductive polymers are forecast to expand at a 5.86% CAGR through 2031.
- By form, films held 43.72% share of the electroactive polymer market size in 2025; coatings are advancing at a 6.28% CAGR to 2031.
- By application, actuators and sensors accounted for 26.14% of the electroactive polymer market size in 2025, whereas battery materials are projected to grow at a 6.68% CAGR between 2026-2031.
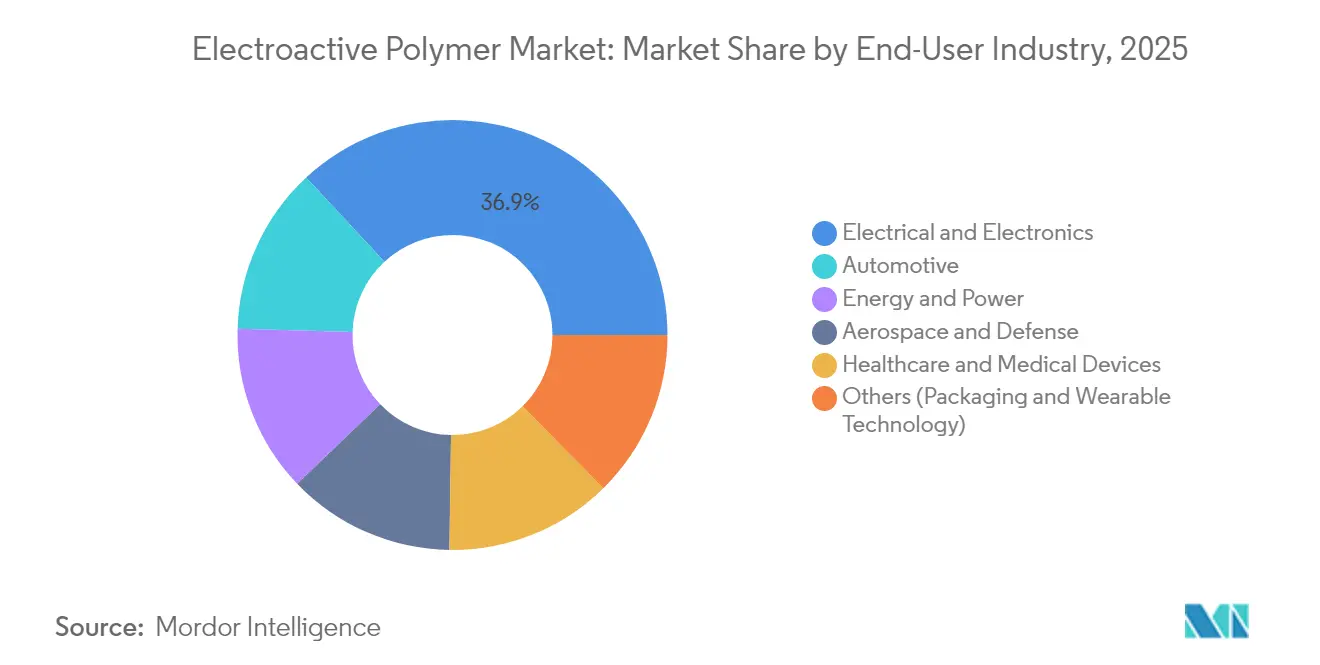
- By end-user industry, electrical and electronics generated 36.91% revenue in 2025, while healthcare and medical devices register the highest 6.17% CAGR over the forecast period.
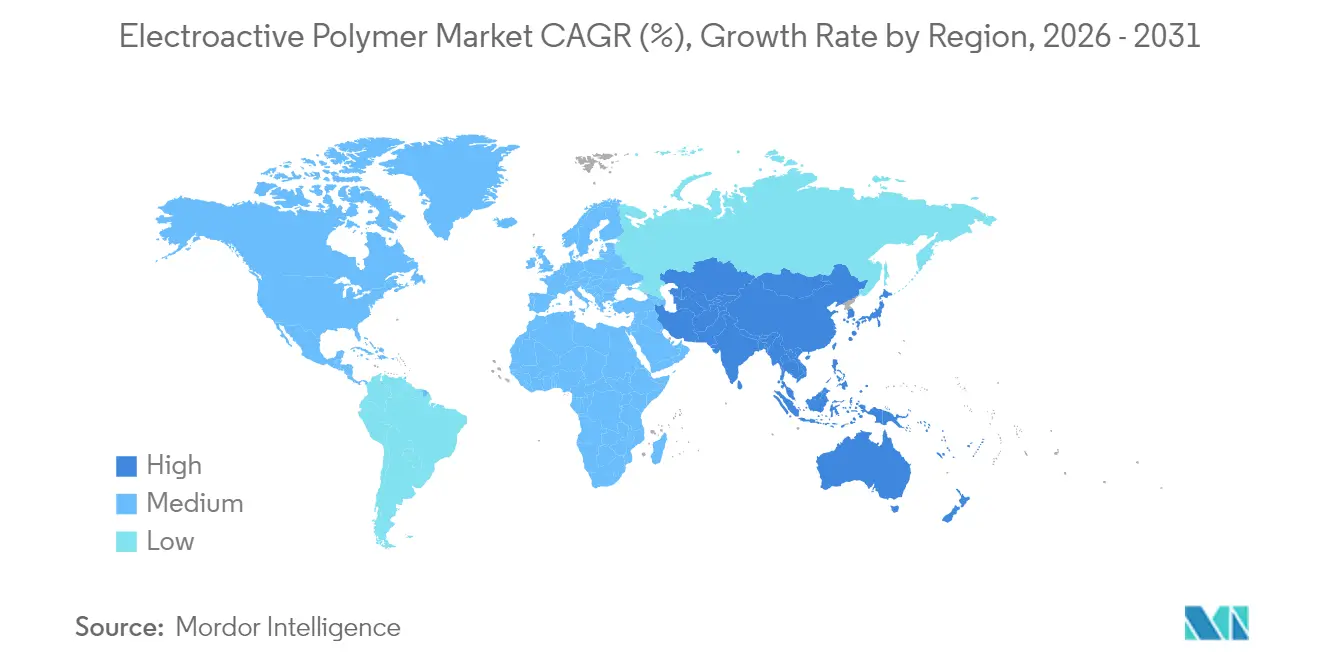
- By geography, North America led with 36.32% share in 2025; Asia-Pacific is expected to be the fastest-growing region at a 6.58% CAGR through 2031.
Note: Market size and forecast figures in this report are generated using Mordor Intelligence’s proprietary estimation framework, updated with the latest available data and insights as of 2026.
Market Trends and Insights
Drivers Impact Analysis of Electroactive Polymer Market*
| Driver | (~) % Impact on CAGR Forecast | Geographic Relevance | Impact Timeline |
|---|---|---|---|
| Expansion of consumer electronics manufacturing in Asia-Pacific | +1.2% | Asia-Pacific core, spill-over to North America | Medium term (2-4 years) |
| Lightweight conductive materials for EV platforms | +0.9% | Global, with concentration in North America & Europe | Medium term (2-4 years) |
| Adoption of electronic skin patches in remote healthcare | +0.7% | North America & Europe, expanding to Asia-Pacific | Long term (≥ 4 years) |
| Deployment of soft-robotic actuators in defense programs | +0.5% | North America, with selective adoption in Europe | Short term (≤ 2 years) |
| EU circular economy incentives for polymer recycling | +0.4% | Europe, with regulatory influence spreading globally | Long term (≥ 4 years) |
| Source: Mordor Intelligence | |||
Expansion of Consumer Electronics Manufacturing in Asia-Pacific
Asia-Pacific’s vast electronics factories elevate demand for flexible conductive polymers that fit high-volume roll-to-roll lines. Massive wearable-device output, projected near 800 million units in 2025, relies on thin films that embed sensors without adding weight or thermal lag. Concentrated production hubs like Shenzhen and Seoul create scale advantages yet heighten supply-chain risk for critical feedstocks such as high-purity aniline. Rapid migration to finer semiconductor nodes in automotive control units requires polymer interfaces capable of tolerating higher frequencies and tighter thermal budgets. OEMs are therefore investing in dedicated electroactive polymer lines to safeguard strategic component supply and accelerate design iterations.
Lightweight Conductive Materials for EV Platforms
Automakers pursuing lower curb weight and higher battery range substitute metallic components with conductive polymers that combine structural integrity and signal transmission. Syensqo’s Augusta plant, backed by a USD 178 million U.S. Department of Energy grant, underlines policy support for domestic polyvinylidene fluoride (PVDF) capacity. Such facilities are designed for more than 5 million EV battery packs annually, illustrating scale economies emerging within the electroactive polymer market. Integration breadth widens as solid-state battery prototypes seek polymer electrolytes that deliver ionic conductivity without flammable liquids. Every kilogram saved in commercial trucks directly raises payload capacity, amplifying the financial appeal of lightweight electroactive materials.
Adoption of Electronic Skin Patches in Remote Healthcare
Wearable medical devices increasingly incorporate self-healing electroactive films that recover 80% functionality within 10 seconds of damage. Digital health providers value these polymers for seamless muscle-fatigue analytics that keep chronic-care patients out of hospital wards. Machine-learning modules running at the sensor edge cut latency, encouraging physicians to trust real-time data transmitted from home environments. Demand accelerates further as insurers reimburse long-term monitoring kits that use compliant materials comfortable enough for multi-day wear. The technology’s underwater operability also sparks interest in rehabilitating divers and workers in humid industrial settings.
EU Circular-Economy Incentives for Polymer Recycling
Regulation (EU) 2024/1781 obliges manufacturers to design products for disassembly, pushing suppliers toward electroactive polymers that maintain conductivity after multiple melt-recycles[1]European Parliament and Council, “Regulation (EU) 2024/1781 establishing ecodesign requirements for sustainable products,” eur-lex.europa.eu. Digital product passports enhance chain-of-custody transparency, favoring producers able to certify recycled-content thresholds. Parallel battery rules require 30% recycled plastic by 2030, intensifying R&D into depolymerization pathways that retain electrical performance. Brands preparing global launches are standardizing on EU-compliant grades to avoid dual inventory. Although compliance raises near-term costs, it enables premium positioning with eco-label-sensitive customers.
Restraints Impact Analysis of Electroactive Polymer Market*
| Restraint | (~) % Impact on CAGR Forecast | Geographic Relevance | Impact Timeline |
|---|---|---|---|
| Environmental concerns for end-of-life disposal | -0.8% | Global, with stricter enforcement in Europe | Medium term (2-4 years) |
| High production costs of specialty EAP grades | -1.1% | Global, with acute impact in price-sensitive segments | Short term (≤ 2 years) |
| Bottlenecks in high-purity aniline feedstock supply | -0.6% | Global, with concentration in Asia-Pacific supply chains | Short term (≤ 2 years) |
| Source: Mordor Intelligence | |||
Environmental Concerns for End-of-Life Disposal
Mandatory recyclability targets under Europe’s packaging-waste directive stipulate 5% weight reduction by 2030[2]European Parliament, “Packaging and packaging waste,” europarl.europa.eu. Composite electroactive polymers that trap metallic flakes complicate mechanical recycling, forcing investment in chemical-recovery plants not yet widespread. Uncertainty over final-treatment liability deters some OEMs from adopting advanced grades despite performance benefits. Consumer scrutiny has shifted purchasing toward bio-derived alternatives such as polylactic-acid-based artificial muscles under laboratory evaluation. Until scalable circular-economy infrastructure matures, environmental compliance remains a drag on broader uptake.
High Production Costs of Specialty Electroactive Polymer Grades
Processing windows for high-conductivity polymers are narrow, and small batch volumes restrict economies of scale. Yield losses from out-of-spec resistivity add to unit cost, sometimes pricing materials at 10–20 times commodity conductive plastics. Automation and AI-guided synthesis, such as Argonne’s Polybot lab, are beginning to trim iteration cycles, but full factory retrofits require capital that mid-tier suppliers struggle to finance. Cost inflation dampens substitution potential in consumer electronics where bill-of-materials targets remain stringent.
*Our forecasts treat driver/restraint impacts as directional, not additive. The impact forecasts reflect baseline growth, mix effects, and variable interactions.
Electroactive Polymer Market Segment Analysis
By Type:
Conductive Plastics Maintain Scale AdvantageConductive plastics generated 40.68% of the electroactive polymer market size in 2025, underpinning mature supply chains that furnish antistatic housings, EMI shielding, and flexible circuits. Their thermoplastic nature supports regrind recycling, an attribute increasingly valued under circular-economy mandates. Inherently conductive polymers, though only a fraction of current revenue, deliver metallic-level conductivity via conjugated backbones and are charted for a 5.86% CAGR, making them the prime target for high-frequency microchips and next-gen sensor networks. Research breakthroughs in two-dimensional polyaniline crystals, demonstrating out-of-plane charge mobility bordering on metals, validate commercial roadmaps for transparent electrodes and printed logic layers. Inherently dissipative polymers occupy the middle ground where controlled surface resistivity prevents static build-up without full metallic conduction, aiding semiconductor clean-room infrastructure as global chip capacity expands.
Second-generation inherently conductive polymers still encounter synthesis bottlenecks such as humidity sensitivity during polymerization, but universities have recently reported golden-luster polyaniline that resists photodegradation. Scalable tons-per-year production remains aspirational, yet joint ventures between chemical majors and venture-funded startups are fast-tracking pilot plants. As these facilities achieve consistency, the electroactive polymer market will see differentiated performance tiers rather than a single dominant chemistry.




By Form:
Films Enable Flexible IntegrationFilms accounted for 43.72% share of the electroactive polymer market in 2025, favored for continuous roll-to-roll coating lines that slash unit cost while delivering uniform thickness under 20 µm. Product designers embed film layers into touch panels, OLED displays, and membrane switches, relying on anisotropic conductivity for precise signal routing. Coatings rise at a 6.28% CAGR as medical-device housings, smart fabrics, and industrial rollers demand surface conductivity without altering core substrate mechanics. Saarland University’s lightweight elastomer films illustrate dual-function self-sensing actuators that bend on low voltage while reporting positional feedback.
Granules and pellets feed injection-molded brackets in EV battery enclosures, where electromagnetic shielding must coexist with mechanical toughness. Fibers, spun via wet-extrusion or electrospinning, weave into smart garments that monitor hydration and vital signs during athletic training. Continuous improvement in annealing protocols reduces percolation thresholds, allowing thinner film stacks at equal resistance, a cost lever that appeals to high-volume electronics assemblers.
By Application:
Actuators Drive Premium DemandActuators and sensors represented 26.14% of the electroactive polymer market size in 2025 and anchor R&D investments for soft-robotic grippers, haptic interfaces, and artificial muscle prosthetics. Stamping techniques pioneered at MIT align polymer fiber orientation to permit omnidirectional flexing akin to human iris motion. Battery components, rising at a 6.68% CAGR, exploit PVDF binders and solid-polymer electrolytes to boost lithium-ion energy density while mitigating thermal runaway risks. Energy-harvesting modules transform stray vibration into micro-watts that trickle-charge IoT nodes, and piezoelectric variants gain attention in smart roadways measuring traffic loads.
Prosthetic-limb developers now integrate electroactive sheets that self-sense strain, feeding machine-learning controllers for natural gait. Automotive devices combine structural functions—such as dashboard backplates—with antenna signal paths, trimming harness weight. Each application cycle augments material data sets, accelerating future chemistry optimization across the electroactive polymer market.
By End-User Industry:
Electronics Retain Scale, Healthcare AcceleratesThe electrical and electronics sector commanded 36.91% revenue in 2025, embedding conductive films in smartphones, servers, and factory-automation controllers. Engineers embrace polymers to replace metal springs in low-profile tactile switches, preserving click feel while freeing design latitude. Healthcare and medical devices head toward a 6.17% CAGR alongside global chronic-care digitalization. Researchers at the University of Hong Kong have demonstrated organic electrochemical transistors that interpret bio-signals directly on flexible substrates, minimizing latency for neuromuscular diagnostics.
Automotive OEMs allocate electroactive plastics to radar absorbers, battery isolators, and interior touch surfaces unified under large infotainment panels. Aerospace and defense adoption—though volume-limited—sets upper-performance benchmarks for dielectric strength and radiation tolerance that mainstream sectors ultimately inherit. The still-fragmented electroactive polymer industry balances commodity electronics margin discipline with premium biomedical reimbursement, ensuring diversified revenue streams across economic cycles.
Geography Analysis
North America Electroactive Polymer Market
North America held 36.32% of the electroactive polymer market in 2025, propelled by defense budgets funding artificial-muscle exoskeletons and by medical-device makers clustering around regulatory-science hubs. Federally sponsored labs translate breakthroughs to industry under cooperative-research agreements, shortening commercialization timelines. Regional carmakers pivot toward U.S.-made battery materials to satisfy Inflation Reduction Act incentives, stabilizing local polymer supply contracts. Cross-border integration with Canadian chemical complexes gives producers access to competitively priced benzene derivatives, moderating feedstock volatility.
APAC Electroactive Polymer Market
Asia-Pacific is forecast to expand at a 6.58% CAGR, riding mass-production economics in consumer electronics and electric-vehicle powertrains. Chinese lithium-ion battery fabs concentrate more than three-quarters of global cell capacity, forming a gravitational pull for PVDF and separator polymer demand. Japanese and Korean firms specialize in high-purity aniline purification and 2D conductive-polymer research, exporting technology packages to Southeast Asian assembly corridors. Regional policymakers subsidize domestic semiconductor foundries, spurring demand for advanced static-dissipative polymers that safeguard wafer yield.
Europe Electroactive Polymer Market
Europe blends high engineering standards with stringent sustainability mandates. Regulation-driven recycled-content quotas accelerate investment in solvent-free film casting and enzymatic depolymerization lines, creating secondary raw-material markets. Automotive tier-ones in Germany and France employ electroactive plastics to integrate capacitive controls within curved dashboards, saving wiring harness weight. Collaborative R&D consortia pool university capabilities with mid-sized enterprises, focusing on bio-based monomers that preserve conductivity while reducing greenhouse-gas footprints.

Value Chain Analysis
The value chain begins with petrochemical and specialty feedstocks (including high-purity aniline for polyaniline routes and fluoropolymer precursors for PVDF-based battery binders), followed by compounding and polymerization into conductive plastics, inherently conductive polymers, and dielectric/elastomer systems. Conversion is concentrated in high-throughput film and laminate processes (roll-to-roll coating/lamination, extrusion, printing), then moves to module integration (printed sensors, haptic surfaces, actuator stacks) and OEM assembly across electronics, automotive interiors, batteries, and medical devices.
Industrialization partnerships are increasingly bridging the gap between resin supply and application-ready devices. Examples include Arkema (via Piezotech) and Alqio (Armor Group) collaborating in April 2026 to advance printed electronics production using piezoelectric/ferroelectric polymers and screen-printing/coating capabilities in La Chevroliere, France, and Covestro signing a May 2026 MoU with Jiangsu Genofort to industrialize ultra-flexible printed electronics haptic systems for automotive interiors using TPU film substrates. On the conversion side, Wacker Chemie initiated serial production of NEXIPAL Sense sensor laminates at Burghausen in September 2025 using roll-to-roll silicone rubber film processes, underscoring that scale-up and yield control in continuous manufacturing remain key cost and quality levers.
Competitive Landscape
The electroactive polymer market exhibits moderate fragmentation. Multinationals such as BASF, DuPont, and Arkema scale commodity conductive plastics through global plants, leveraging capex efficiency and captive feedstocks. Their sprawling distribution networks secure long-term supply obligations with smartphone OEMs and auto tier-ones. Conversely, start-ups concentrate on patented monomers or additive packages that impart stretchability, self-healing, or metal-level conductivity at sub-room-temperature processing.
Innovation speed accelerates thanks to AI-guided discovery platforms. Argonne National Laboratory’s open-source Polybot continuously tests recipe permutations, reducing iteration cycles from weeks to hours and sharing data that smaller firms can leverage without massive computational budgets. Strategic partnerships dominate recent deal flow: resin producers team with wearable-sensor start-ups to co-design polymers tailored to skin-contact biocompatibility, while automakers underwrite PVDF capacity to safeguard cathode-binder availability. Patenting activity increasingly covers processing know-how—such as solvent-exchange routes that lower viscosity for inkjet printing—rather than solely new chemical entities, reflecting a maturing industry focus on manufacturability.
Well-funded Chinese entrants invest in vertically integrated chains from aniline through polymerization to roll-to-roll coating, using domestic demand as a scale lever. European producers differentiate through bio-feedstock and closed-loop recycling, capturing premiums from eco-label-oriented electronics brands. U.S.-based SMEs pivot toward defense programs which value survivability under extreme conditions and award multi-year contracts ahead of full-rate production, giving them predictable cashflow to expand pilot lines.
Electroactive Polymer Industry Leaders
Solvay
Premix Group
3M
Avient Corporation
Parker Hannifin Corp
- *Disclaimer: Major Players sorted in no particular order
Electroactive Polymer Market Companies Covered in this Report
- 3M
- Arkema
- Avient Corporation
- BASF SE
- DuPont
- Kenner Material and System Co. Ltd.
- Merck KGaA
- NOVASENTIS Inc.
- Parker Hannifin Corp
- Premix Group
- Solvay
- The Lubrizol Corporation
- Wacker Chemie AG

Market Opportunities and Future Outlook
Whitespace is expanding where electroactive polymers move from materials qualification into manufacturable actuator and interface architectures. Automated fabrication approaches, including multi-material direct ink writing of PVC-gel artificial muscles (reported in July 2026), create a pathway to reduce labor-intensive actuator assembly and improve design freedom for soft-robotics and haptic modules. On the materials side, published 2026 research on solvent-free, high-permittivity polysiloxane capillary inks for stack dielectric elastomer actuators and electrocaloric thin-film work targeting sub-1 kV operation in solid-state heating/cooling point to opportunities for suppliers that can offer low-voltage, scalable formulations with consistent dielectric performance.
Sustainability-driven substitution is an additional opportunity area, especially where PVDF-linked environmental scrutiny pushes R&D toward fluorine-free transducers. Empa has highlighted development of fluorine-free polysiloxane transducers (July 2026), aligning with circular-economy constraints that are already shaping polymer selection in Europe. Commercial whitespace also exists at the device-integration layer, where companies pursuing stacked polymer actuator industrialization (for example, Datwyler) need qualified film substrates, conductive layers, and repeatable lamination/printing workflows that can meet automotive and medical reliability requirements without sacrificing flexibility.
Recent Industry Developments in Electroactive Polymer Market
- June 2026: Solvay and Orbia advanced plans for their PVDF capacity buildout in the southeastern United States, targeting operational production to support electric-vehicle battery supply chains. The move strengthens regional access to a critical battery-binder polymer and reduces reliance on longer, more volatile import lanes for fluoropolymer materials.
- February 2026: Premix highlighted the use of its carbon black-filled polypropylene PRE-ELEC compound in MRI-safe disposable ECG electrodes as a replacement for metal components. This application underscores how conductive plastics can unlock safer medical diagnostics and drive demand for tailored compounds with controlled conductivity and compatibility with high-volume processing.
- May 2025: Premix opened its first US manufacturing facility in Apple Creek, Dallas, North Carolina, supported by a USD 79 million investment from the US Department of Defense and the Department of Health and Human Services. The facility anchors localized production for critical supply chains and improves responsiveness for North American customers needing specialty conductive materials.


Electroactive Polymer Market Report Scope and Research Methodology
Market Definition and Coverage
This market covers revenue generated from electroactive polymer materials that change shape, size, or electrical behavior when a voltage or electric field is applied, and that are sold into industrial and commercial end uses.
Scope exclusions: custom lab-scale prototypes that are not commercially sold, and unrelated passive plastics without electroactive performance, are excluded from the market sizing.
Segments Covered in This Report
- By Type
- Conductive Plastics
- Inherently Conductive Polymers (ICPs)
- Inherently Dissipative Polymers (IDPs)
- By Form
- Films
- Fibers
- Coatings
- Granules / Pellets
- By Application
- Actuators and Sensors
- Energy Generation
- Automotive Devices
- Batteries
- Prosthetics
- Robotics
- Other Applications
- By End-User Industry
- Electrical and Electronics
- Automotive
- Healthcare and Medical Devices
- Energy and Power
- Aerospace and Defense
- Others (Packaging and Wearable Technology)
- By Geography
- Asia-Pacific
- China
- Japan
- South Korea
- India
- Australia and New Zealand
- Rest of Asia-Pacific
- North America
- United States
- Canada
- Mexico
- Europe
- Germany
- United Kingdom
- France
- Italy
- Spain
- Russia
- Rest of Europe
- South America
- Brazil
- Argentina
- Rest of South America
- Middle East and Africa
- Saudi Arabia
- United Arab Emirates
- South Africa
- Nigeria
- Rest of Middle East and Africa
- Asia-Pacific
Data Sources, Market Sizing, and Validation
Desk Research
Desk work starts with defining what is being counted, then mapping the value chain to avoid double counting across raw materials, compounds, and finished parts. Public sources such as USGS materials data, US International Trade Commission trade statistics, UN Comtrade, and patent databases are used to understand activity levels, product direction, and cross-border movements. For application pull signals, we also refer to sources such as IEEE and other peer-reviewed journals that discuss adoption in actuators, sensors, and electromagnetic shielding.
To connect these signals to revenue, we review company annual reports, investor presentations, and reputable press for capacity mentions, product mix, and demand commentary. Where available, paid subscription company financials and shipment-level import and export databases are used to cross-check regional intensity and typical pricing ranges in a practical way. The desk sources listed above are illustrative only, and many other public references were also used for data collection, clarification, and validation.
Primary Interviews and Surveys
Primary work was used to pressure-test what is included as electroactive polymer revenue, and to confirm how demand splits across uses such as ESD protection, EMI shielding, and actuation systems. We spoke with a mix of material suppliers, compounders, and downstream users, then checked regional patterns across APAC, EMEA, and the Americas so the assumptions did not lean too heavily on one manufacturing base.
Distribution of primary research fieldwork respondents
| Company type | Respondent position | Region |
|---|---|---|
| Top tier: 34% | CXOs: 16% | APAC: 42% |
| Mid tier: 44% | Functional/Unit leaders: 35% | EMEA: 33% |
| Smaller Players: 22% | Managers: 49% | Americas: 25% |
Market-Sizing & Forecasting
The core model uses a top-down approach that combines production and trade signals, end-use activity, and adoption rates to reconstruct a realistic demand pool for electroactive polymers by region. Once the demand pool is set, we corroborate results with selective bottom-up checks, such as sampled pricing ranges multiplied by plausible volumes for key applications, plus channel feedback on which forms are actually being purchased.
Inputs that matter in this market include the split between conductive plastics and inherently conductive or dissipative polymers, the mix of forms like films and fibers, and the share of demand coming from ESD and EMI uses versus actuators and sensors. We also track indicators such as electronics manufacturing output, automotive electrification intensity, and medical device development activity, since these are common pull areas for EAP-enabled components. Forecasting uses scenario analysis supported by simple multivariate relationships, with primary experts helping set ranges for adoption, price movement, and substitution risk. When volume detail is incomplete for a niche use case, the gap is handled by anchoring to the closest comparable application, then applying a conservative penetration curve before totals are rolled up.
Data Validation & Update Cycle
Outputs are checked against independent signals, including regional manufacturing strength, trade direction, and whether pricing assumptions align with what buyers report paying through the channel. If a region shows a jump that cannot be explained by known demand drivers, the underlying inputs are re-checked and the related assumptions are revisited with follow-up calls.
Before sign-off, the model and write-up go through multi-step analyst review to align calculation logic, unit consistency, and currency handling. The report is refreshed annually, and interim updates are made when material events occur, such as policy shifts affecting electronics supply chains or major capacity changes. Right before delivery, a final pass is completed so clients receive an updated view based on the latest available public information.
Mordor Intelligence's Electroactive Polymer Market Size Compared With Other Published Estimates
Different published market values can vary even when they all use the same market name, because they may count different product boundaries, use different base years, and apply different price and adoption assumptions. We also see gaps when some studies rely heavily on one data series, while another blends demand indicators with supplier-side checks.
The main gap comes from whether ESD and EMI material demand is counted only as electroactive polymer resin and compound revenue, or is expanded to include finished shielding parts. Mordor Intelligence counts revenue at the material level and then validates the split by type, form, and application through interviews and trade consistency checks.
Benchmark comparison
| Source | Market Size | Gaps in Research Methodology |
|---|---|---|
| Mordor Intelligence | USD 3.79 B (2026) | |
| Industry Research Publisher A | USD 3.52 B (2024) | Uses a different base year and forecast window, and it also mixes revenue and volume framing, which can shift implied pricing and the year-to-year build. |
| Global Consultancy B | USD 5.61 B (2024) | Likely applies a broader monetization scope that can pull in adjacent value from downstream components, which inflates the total versus a materials-only revenue view. |
The spread is mainly explained by how far downstream the counting goes and which year is used to anchor pricing and demand. By keeping assumptions tied to observable adoption signals and by using repeatable checks across type, form, and end use, our approach aims to stay transparent and easier to reconcile when users compare it with other published totals.


Key Questions Answered in the Report
What is the current Electroactive Polymer Market size?
The Electroactive Polymer Market size is USD 3.79 billion in 2026 and is projected to reach USD 4.97 billion by 2031.
What CAGR is expected for the electroactive polymer market through 2031?
The market is forecast to grow at a 5.58% CAGR during 2026-2031.
Which product type holds the largest electroactive polymer market share?
Conductive plastics lead with a 40.68% share in 2025.
Which application area is growing fastest in the electroactive polymer market?
Battery components show the highest growth, advancing at a 6.68% CAGR to 2031.
Page last updated on:


 Your data is secure and never sold or shared.


