Bio-based Polymers Market Size and Share
Market Overview
| Study Period | 2021 - 2031 |
|---|---|
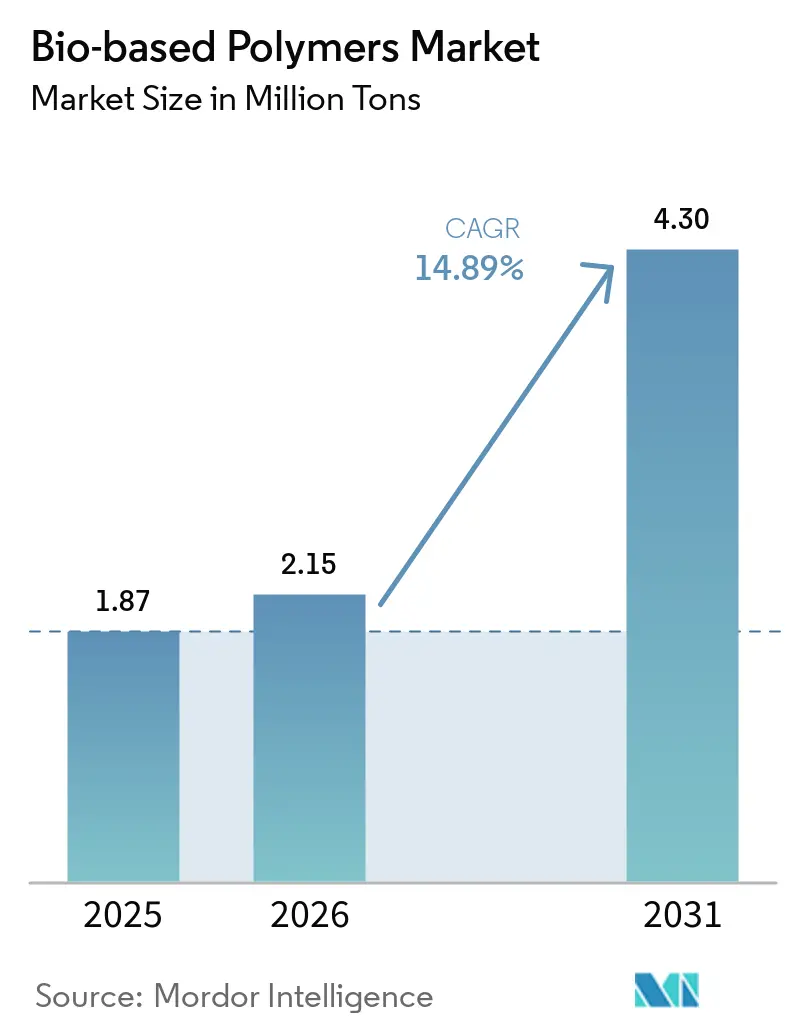
| Market Volume (2026) | 2.15 Million tons |
| Market Volume (2031) | 4.30 Million tons |
| Growth Rate (2026 - 2031) | 14.89% CAGR |
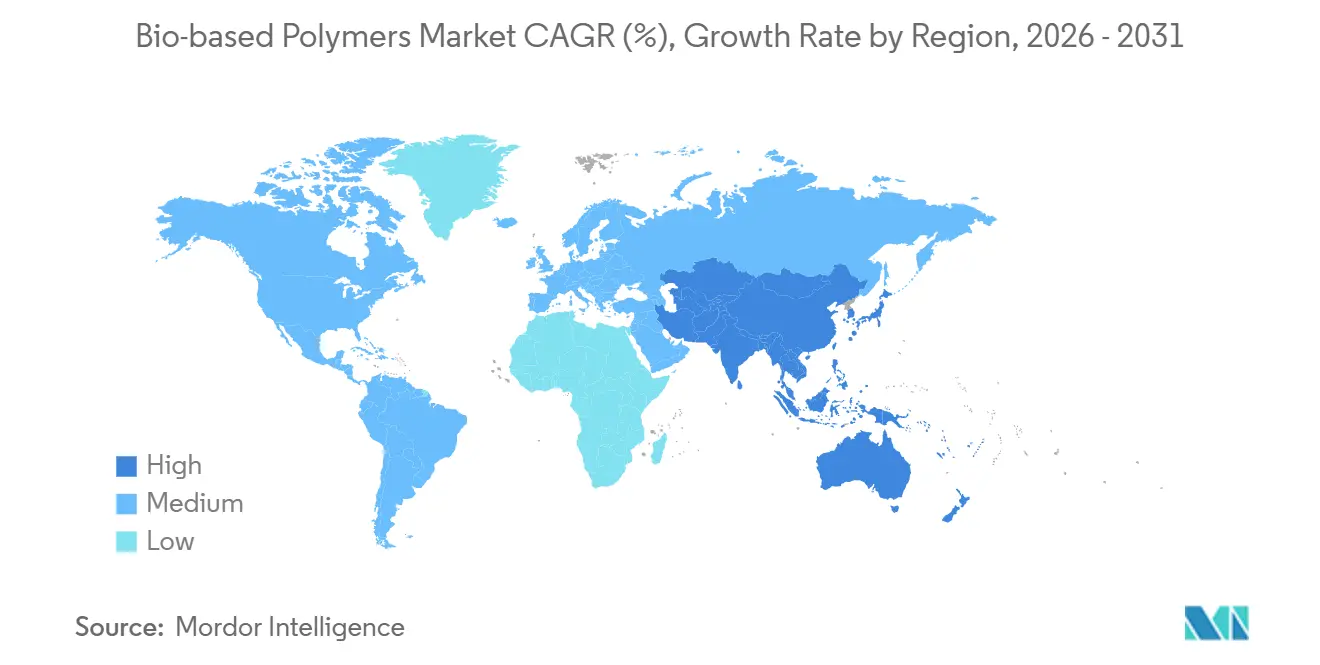
| Fastest Growing Market | Asia Pacific |
| Largest Market | Asia Pacific |
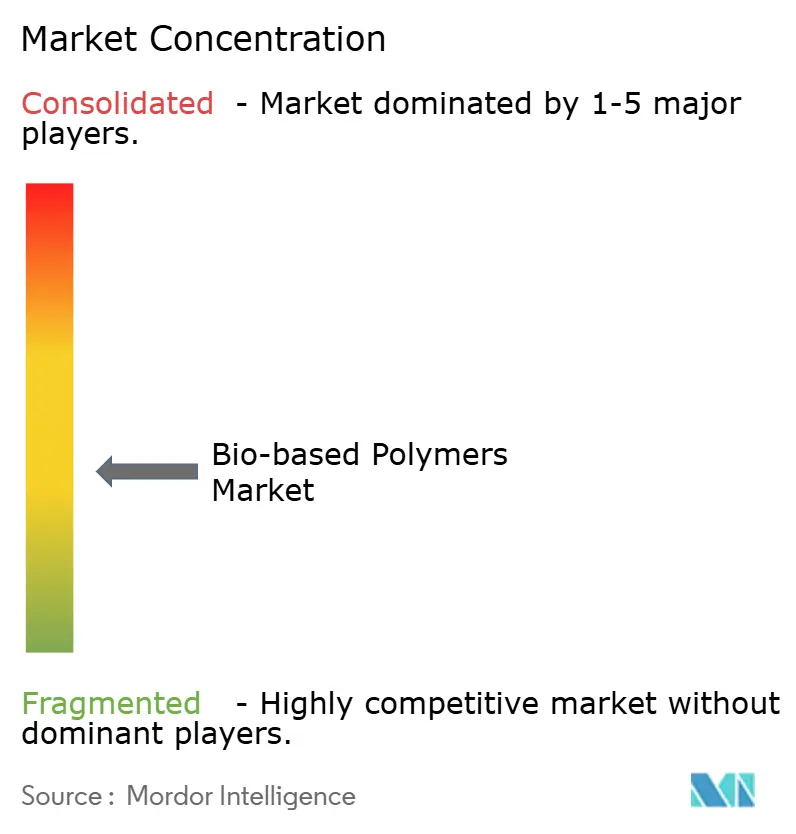
| Market Concentration | Medium |
Major Players *Disclaimer: Major Players sorted in no particular order Image © Mordor Intelligence. Reuse requires attribution under CC BY 4.0. | |
Bio-based Polymers Market Analysis by Mordor Intelligence
The Bio-based Polymers Market size is expected to increase from 1.87 million tons in 2025 to 2.15 million tons in 2026 and reach 4.30 million tons by 2031, growing at a CAGR of 14.89% over 2026-2031. Tightening single-use plastics rules across Europe, North America, and Asia-Pacific, together with corporate net-zero targets, are creating a durable pull for certified drop-in resins that run on existing extrusion lines. Mass-balance certification allows petrochemical hubs to swap fossil feedstocks for bio-attributed alternatives, accelerating commercial adoption in flexible packaging and automotive interiors. Operating costs for polylactic acid (PLA) have fallen by more than 20% as AI-driven fermentation controls optimize pH and energy inputs, while electric-vehicle battery packs now specify bio-polyurethane adhesive films that meet thermal-management and outgassing limits. At the same time, second-generation feedstocks such as agricultural residues and municipal-solid-waste gasification syngas are easing land-use concerns and insulating producers from volatility in food-grade sugar prices.
Key Report Takeaways
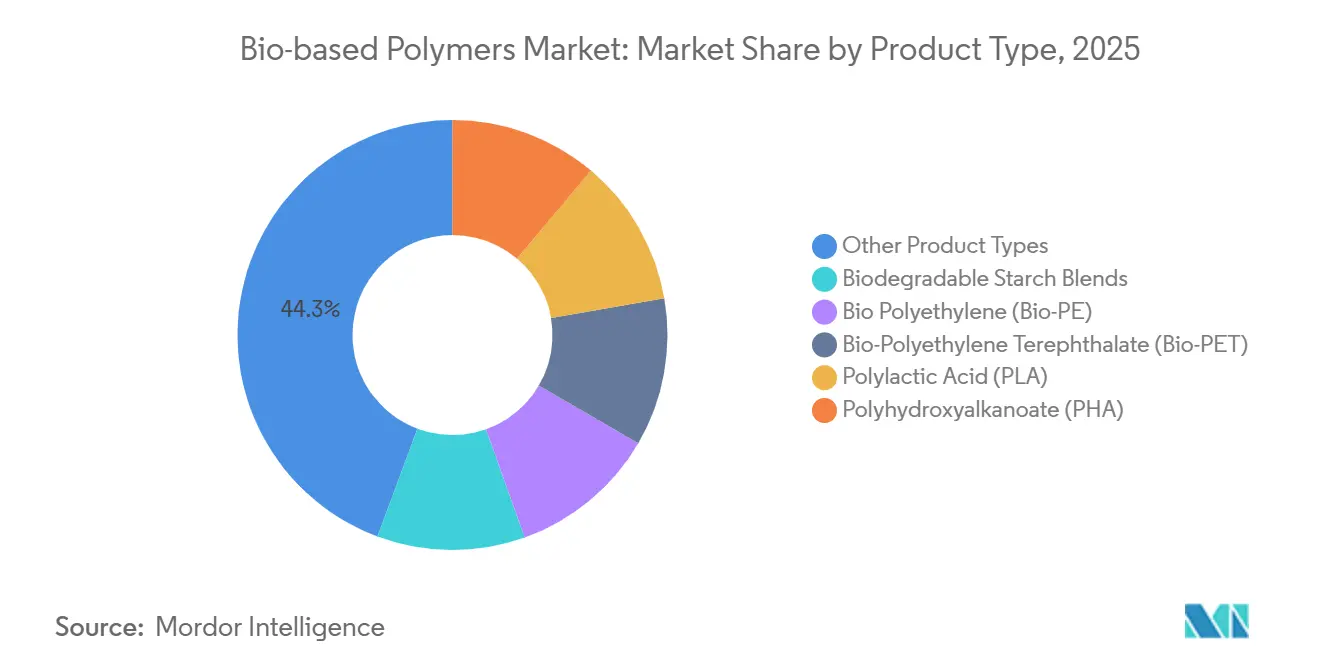
- By product type, other product types, such as polybutylene succinate and polybutylene adipate terephthalate, held 44.32% of the Bio-based Polymers market share in 2025. Polylactic acid is projected to expand at an 18.28% CAGR through 2031.
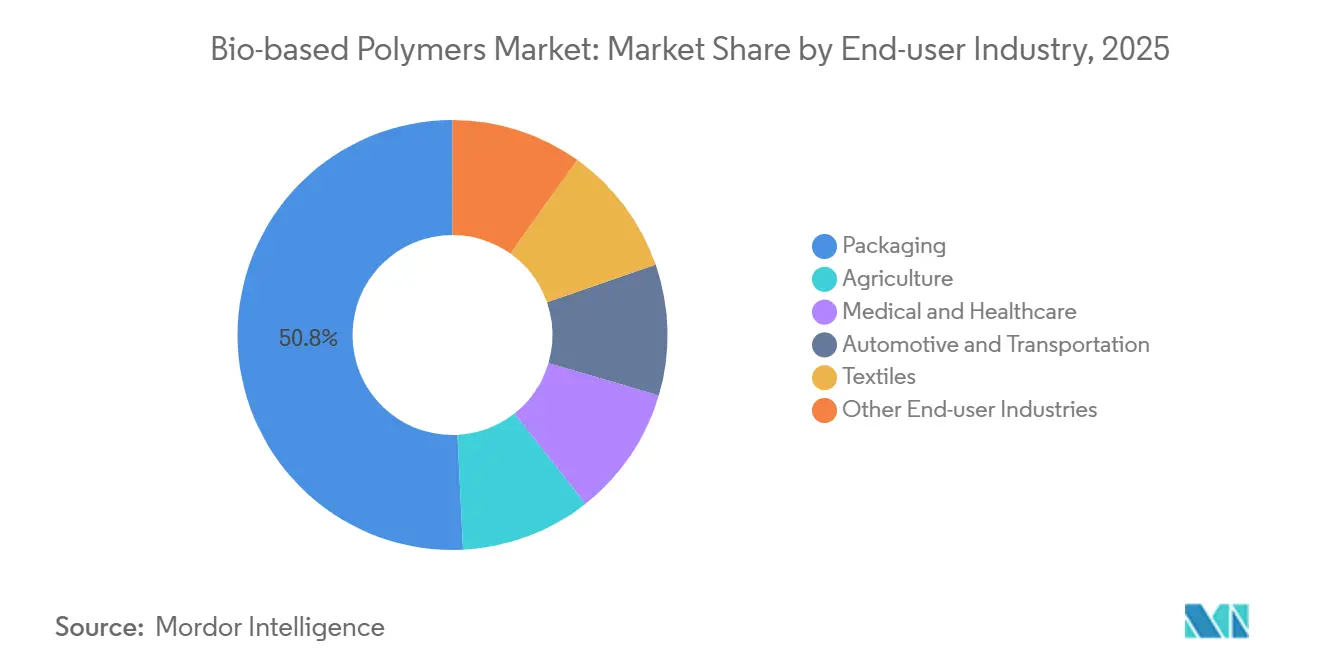
- By end-user industry, packaging led with a 50.78% revenue share in 2025 and is advancing at a 17.45% CAGR to 2031.
- By geography, Asia-Pacific accounted for 44.22% of the bio-based polymers market size in 2025 while recording the highest regional CAGR at 16.78% through 2031.
Note: Market size and forecast figures in this report are generated using Mordor Intelligence’s proprietary estimation framework, updated with the latest available data and insights as of 2026.
Global Bio-based Polymers Market Trends and Insights
Drivers Impact Analysis*
| Driver | (~) % Impact on CAGR Forecast | Geographic Relevance | Impact Timeline |
|---|---|---|---|
| Rising consumer demand for sustainable materials | +3.2% | Global, with peak intensity in EU & North America | Medium term (2-4 years) |
| Corporate net-zero and renewable-carbon sourcing pledges | +4.1% | Global, led by multinational CPG and automotive OEMs | Long term (≥ 4 years) |
| Mass-balance certified drop-in resins adoption | +2.8% | North America & EU, early adoption in APAC | Short term (≤ 2 years) |
| EV-battery thermal-management films spur demand for bio-adhesive layers | +1.9% | APAC core (China, South Korea), spill-over to North America | Medium term (2-4 years) |
| AI-driven biorefinery process intensification cuts PLA OPEX more than 20% | +2.5% | Global, with early deployment in North America & EU | Long term (≥ 4 years) |
| Source: Mordor Intelligence | |||
Rising Consumer Demand for Sustainable Materials
Brand owners are embedding minimum bio-content thresholds in product roadmaps as they compete for millennial and Gen-Z loyalty, with Unilever reporting a 12% willingness-to-pay premium for certified packaging in 2025[1]Unilever, “Sustainable Living Report 2025,” unilever.com. Retail chains such as Carrefour now require 15% bio-attributed polymers in private-label rigid containers by 2027, which effectively redirects EUR 2 billion in annual resin procurement away from fossil incumbents. This demand split is moving commodity shopping bags toward starch blends while cosmetics jars migrate to high-clarity PLA grades. Certified compostable package placements grew 18% year-on-year in 2025, yet limited municipal composting coverage, below 30% in Europe, risks a perception gap that could dilute consumer trust. Compliance hinges on ISO 14855 biodegradability tests that converters must pass before making end-of-life claims on the label.
Corporate Net-Zero and Renewable-Carbon Pledges
More than 100 multinational companies have set targets to source 50% of polymer inputs from renewable or recycled feedstocks by 2030, driven by Scope 3 accounting under the Science Based Targets initiative. Procter & Gamble disclosed a USD 500 million offtake deal for sugarcane-based bio-polyethylene, insulating the supply chain from anticipated carbon-border levies. Automotive OEMs follow suit; Volkswagen now deducts supplier scores when resin carbon intensity exceeds 1.5 kg CO₂-eq per kg, effectively mandating bio-based or mechanically recycled alternatives in interior parts. Financial incentives such as EU Renewable Energy Directive credits and California Low Carbon Fuel Standard credits narrow the price gap between bio-PE and virgin PE to below USD 200 per ton in Western Europe[2]European Commission, “Packaging and Packaging Waste Regulation,” europa.eu.
Mass-Balance Certified Drop-In Resins Adoption
ISCC PLUS and RSB chain-of-custody rules let producers allocate renewable feedstocks to specific polymer grades without physical segregation, retaining incumbent mechanical properties while enabling bio-claims. BASF processed 190,000 tons of bio-naphtha and biomethane in 2025, producing Ccycled polyamides that met stringent automotive flame-retardancy norms. Commercialization cycles have collapsed from seven years to under 18 months because converters no longer need to requalify tooling. Covestro reports a 5-8% price premium for mass-balance polycarbonates that deliver identical heat resistance compared with fossil grades. Verification costs of USD 15,000-25,000 per line remain a hurdle for smaller Asian processors, but revised RSB accounting now excludes indirect land-use change emissions, steering investment toward waste-derived inputs.
EV-Battery Thermal-Management Films Adoption
Multi-layer thermal interface films in lithium-ion battery packs are shifting to bio-based polyurethane adhesives derived from castor oil polyols that exhibit lower outgassing and superior peel strength at sub-zero temperatures. CATL added three qualified bio-adhesive grades to its supplier list in 2025, aligning with a target to cut Scope 3 emissions 25% before its Hungary gigafactory ramps in 2027. LG Energy Solution and Covestro are co-developing bio-polycarbonate films certified UL 94 V-0 that carry 40% lower cradle-to-gate footprints than fossil equivalents. This niche is forecast to consume 15,000-20,000 tons of bio-based polymers annually by 2030, commanding USD 8-12 per kg due to strict traceability. EU Battery Regulation carbon-footprint rules, effective 2024, further tilt material selection toward low-emission resins.
Restraints Impact Analysis*
| Restraint | (~) % Impact on CAGR Forecast | Geographic Relevance | Impact Timeline |
|---|---|---|---|
| Limited composting and recycling infrastructure | -2.7% | Global, acute in APAC & MEA, moderate in North America | Medium term (2-4 years) |
| Pigment and additive impurities hamper closed-loop mechanical recycling | -1.4% | Global, with highest impact in EU due to circular-economy mandates | Long term (≥ 4 years) |
| Volatile CO₂-credit pricing clouds CCU-polymer project finance | -1.1% | North America & EU, limited impact in APAC | Short term (≤ 2 years) |
| Source: Mordor Intelligence | |||
Limited Composting and Recycling Infrastructure
Fewer than 200 industrial composting facilities in the United States reach the 58°C thermophilic conditions required for PLA degradation within 180 days. India’s single-use-plastics ban exempts certified compostables, yet just 12 of over 4,000 municipalities have contracted composting services, so most bio-bags still land in dumpsites. California’s Attorney General sued converters in 2025 for labeling PBAT films “compostable” without verified end-of-life routes, underlining the reputational risk. Building a 50,000-ton aerobic digestion plant costs USD 25-40 million, a capital that many waste firms lack. Mechanical recycling of PLA and PHA remains limited because lower melt stability contaminates PET streams, trimming recycled-resin tensile strength by up to 18%. The EU Packaging and Packaging Waste Regulation now mandates separate collection streams for compostables by 2028, but municipalities claim a funding gap of EUR 3-5 billion.
Pigment and Additive Impurities Hamper Mechanical Recycling
Colorants and stabilizers accumulate during re-extrusion, shifting the melt-flow index and creating haze that brand owners reject. An academic study showed PLA recycled five times lost 12% impact strength and gained 4.2 yellowness units due to titanium-dioxide agglomeration. Design-for-recycling protocols ask converters to cap additive loads below 2 wt% and avoid pigments that degrade under 200°C, but vibrant brand colors conflict with these limits. Eastman’s methanolysis depolymerization purges contaminants yet uses 40% more energy than conventional recycling and remains uneconomic for resins priced below USD 2,000 per ton. Europe’s proposed phthalate restriction, finalized in 2025, forces reformulation of flexible bio-films and could stall recycling-infrastructure alignment by two to three years.
*Our forecasts treat driver/restraint impacts as directional, not additive. The impact forecasts reflect baseline growth, mix effects, and variable interactions.
Segment Analysis
By Product Type: PBS & PBAT Retain Leadership, PLA Drives Incremental Growth
Other product types (Polybutylene Succinate (PBS), Polybutylene Adipate Terephthalate (PBAT), and more) together held 44.32% of the bio-based polymers market in 2025 because they run on existing LDPE blown-film lines and meet EN 13432 industrial compostability that demands 90% biodegradation within 180 days at 58°C. Farmers in the Mediterranean and East Asia favor these resins in mulch films, avoiding USD 150 per hectare retrieval labor and landfill fees. BASF’s Ecovio and Mitsubishi Chemical’s BioPBS grades, therefore, anchor stable volume streams. The bio-based polymers market size for PLA is expanding fastest, with an 18.28% CAGR through 2031, supported by NatureWorks’ 75,000-ton Thai plant and the Corbion-TotalEnergies 100,000-ton French unit that started late 2024. PLA gains ground in high-clarity clamshells and cups, commanding USD 300-500 per ton premiums despite lower heat-deflection temperatures.
Bio-PE and bio-PET demand is being propelled by Braskem’s 200,000-ton sugarcane-ethanol facility and Indorama’s pilot line in Thailand. Because they match the drop-in performance of fossil analogs, converters avoid qualification delays, a critical edge in beverage bottles where CO₂ barrier performance is non-negotiable. PHA demand remains low due to costs above USD 4,000 per ton, although Danimer Scientific’s Kentucky expansion now targets marine-degradable fishing gear banned under new ocean-plastic laws. Starch blends, usually compounded with PBAT to fight moisture ingress, dominate single-use cutlery where price points near USD 1,300 per ton outweigh brittleness below 5°C. Regulatory access hinges on ISO 17088 and ISO 16620 certifications that verify compostability and bio-carbon content, favoring multinationals that can fund audits.


By End-User Industry: Packaging Holds Majority, Automotive and Medical Accelerate
Packaging took 50.78% of the 2025 demand for the Bio-based Polymers market and is projected to grow at 17.45% through 2031. EU rules now require 10% bio-content in food-contact films by 2030, while California’s SB 54 adds producer fees on fossil plastics, pushing converters toward PBAT and PLA blends that meet FDA 21 CFR 177.1520 food-contact norms. Rigid trays and closures lean on high-flow PLA grades that cycle as fast as polystyrene. Automotive applications are expanding as OEMs chase lighter vehicles; flax-fiber reinforced bio-polyamide panels shed 20% mass versus glass-filled nylon and slash carbon footprints 35%, aligning with Volkswagen supplier scorecards.
Medical and healthcare devices adopt PLA and PHA for absorbable sutures and screws that dissolve from six months to three years, eliminating removal surgeries. Corbion’s PURASORB resins, cleared under FDA 510(k), logged double-digit growth in 2025. Agriculture uses PBS mulch films validated under ISO 17556 soil-biodegradation tests, removing USD 100-200 per hectare in plastic retrieval costs. Textiles emerge as a frontier, with Toray blending bio-PET into athletic wear to meet brand commitments on recycled or renewable content. Other segments, such as consumer electronics and 3D printing rely on stringent UL 94 fire tests and ASTM D6866 bio-content verification.
Geography Analysis
Asia-Pacific controlled 44.22% of the 2025 volume for the bio-based polymers market and is on track for a 16.78% CAGR through 2031. China funnels CNY 50 billion (USD 7 billion) in subsidies into renewable chemicals, while India enforces a single-use plastics ban that exempts certified compostables. Japan’s Green Innovation Fund awarded JPY 200 billion (USD 1.4 billion) to bio-chemical value chains, financing Mitsubishi Chemical and Kaneka pilots. South Korea mandates 30% bio-content in public procurement by 2027, guaranteeing 25,000 tons in captive demand. Regional uptake hinges on compliance with China’s GB/T 20197 and India’s IS 17088 standards, where only 40% of local converters have secured certification, handing early share to multinationals.
In North America, the US Inflation Reduction Act’s 45Z clean-fuel credit indirectly improves PLA and bio-PE margins by boosting demand for fermentation intermediates. California’s SB 54 obliges 25% bio-content or recycled content in single-use packaging by 2032, spurring Starbucks and McDonald’s to roll out PLA cold cups nationwide. Canada’s federal plastics registry tracks bio-based placements, but uneven composting infrastructure outside Ontario and British Columbia restricts end-of-life value capture. Mexico’s automotive suppliers deploy bio-polyamides in dashboards to satisfy USMCA rules-of-origin, sourcing Tenite cellulosics from Eastman’s Tennessee plant.
Europe’s Bio-based Polymers market size benefits from a mature industrial composting network, especially in Italy, which processes 60% of the country’s bio-packaging waste. The EU Packaging Regulation mandates that all packaging be recyclable or compostable by 2030 and sets a 10% bio-content floor for food-contact uses. Germany’s DIN CERTCO and Austria’s TÜV Austria oversee EN 13432 certification, while France’s AGEC law bans fossil-based single-use plastics in quick-service restaurants. The United Kingdom exempts ISCC-certified bio-polymers from its GBP 200-per-ton plastic-tax if they contain at least 30% renewable content.
The Rest of World segment, led by Brazil and the United Arab Emirates offers specific growth nodes. Braskem exports bio-PE from its sugarcane-based plant, and Masdar City hosts pilots for CO₂-derived polyols in partnership with Covestro.

Competitive Landscape
The Bio-based Polymers market remains moderately fragmented. Integrated majors leverage existing steam crackers to co-process bio-naphtha, enabling drop-in Ccycled grades without new capital outlay. Patent filings in carbon-capture-derived polyols rose 35% between 2024-2025, with BASF and Covestro alone accounting for 18% of grants. Barriers for new entrants include certification expenses, feedstock volatility, and the capital intensity of fermentation or depolymerization technology. Yet niche opportunities remain in bio-composites for electric-vehicle exteriors, absorbable medical implants, and agricultural films that biodegrade in soil.
Bio-based Polymers Industry Leaders
BASF
Braskem
Corbion
NatureWorks LLC
Novamont S.p.A.
- *Disclaimer: Major Players sorted in no particular order

Recent Industry Developments
- March 2026: Synthomer introduced Suncryl Bio, a series of bio-based, silicone-free release coatings for pressure-sensitive applications. The series included three products: Suncryl HP 114 BIO, featuring 50% bio-based polymer content; Suncryl HP 98 Bio, with 28% bio-based polymer content; and Suncryl EU 127 Bio, containing 26% bio-based polymer content.
- February 2026: Balrampur Chini Mills Limited (BCML) announced that its PLA vertical, Balrampur Bioyug, secured its inaugural institutional order from the Lucknow Cantonment Board (LCB). The order encompasses a range of eco-friendly products: compostable garbage bags in two sizes, 300 ml PLA bottles, 3D-printed compostable PLA pens, and PLA folders.


Global Bio-based Polymers Market Report Scope
Bio-based materials are derived from plants and are biodegradable. Similarly, bio-based polymers are also derived from plants such as corn, sugarcane, vegetable oil, soybeans, cellulose, and others. These polymers are also known as next-generation polymers, which are used to reduce the use of fossil fuels. Cellulose and starch were the first bio-based polymers invented and used in textiles, packaging, construction, and other applications.
The Bio-based Polymers market is segmented by type, end-user industry, and geography. By type, the market is segmented into biodegradable starch blends, bio polyethylene (Bio-PE), bio-polyethylene terephthalate (Bio-PET), polylactic acid (PLA), polyhydroxyalkanoate (PHA), and other product types (polybutylene succinate (PBS), polybutylene adipate terephthalate (PBAT), and more). By end-user industry, the market is segmented into agriculture, medical and healthcare, packaging, automotive and transportation, textiles, and other end-user industries. The report also covers the market size and forecasts for the bio-based polymers market in 11 countries across major regions. The report offers market sizes and forecasts for each segment based on volume (tons).
| Biodegradable Starch Blends |
| Bio Polyethylene (Bio-PE) |
| Bio-Polyethylene Terephthalate (Bio-PET) |
| Polylactic Acid (PLA) |
| Polyhydroxyalkanoate (PHA) |
| Other Product Types (Polybutylene Succinate (PBS), Polybutylene Adipate Terephthalate (PBAT), etc.) |
| Agriculture |
| Medical and Healthcare |
| Packaging |
| Automotive and Transportation |
| Textiles |
| Other End-user Industries |
| Asia-Pacific | China |
| India | |
| Japan | |
| South Korea | |
| Rest of Asia-Pacific | |
| North America | United States |
| Canada | |
| Mexico | |
| Europe | Germany |
| United Kingdom | |
| France | |
| Italy | |
| Rest of Europe | |
| Rest of the World | South America |
| Middle East and Africa |
| By Product Type | Biodegradable Starch Blends | |
| Bio Polyethylene (Bio-PE) | ||
| Bio-Polyethylene Terephthalate (Bio-PET) | ||
| Polylactic Acid (PLA) | ||
| Polyhydroxyalkanoate (PHA) | ||
| Other Product Types (Polybutylene Succinate (PBS), Polybutylene Adipate Terephthalate (PBAT), etc.) | ||
| By End-user Industry | Agriculture | |
| Medical and Healthcare | ||
| Packaging | ||
| Automotive and Transportation | ||
| Textiles | ||
| Other End-user Industries | ||
| By Geography | Asia-Pacific | China |
| India | ||
| Japan | ||
| South Korea | ||
| Rest of Asia-Pacific | ||
| North America | United States | |
| Canada | ||
| Mexico | ||
| Europe | Germany | |
| United Kingdom | ||
| France | ||
| Italy | ||
| Rest of Europe | ||
| Rest of the World | South America | |
| Middle East and Africa | ||


Key Questions Answered in the Report
How fast is demand for bio-based polymers expected to grow between 2026-2031?
Global volume is projected to rise at a 14.89% CAGR, moving from 2.15 million tons in 2026 to 4.30 million tons by 2031.
Which product type currently leads adoption?
Polybutylene succinate and polybutylene adipate terephthalate together held 44.32% share in 2025 due to compatibility with existing blown-film lines.
What drives packaging applications toward bio-based options?
EU and California regulations impose bio-content quotas and producer fees on fossil plastics, prompting converters to shift to certified compostable PBAT and PLA blends.
Why is Asia-Pacific the largest regional market?
Policy incentives in China, India, Japan, and South Korea, coupled with new capacity build-outs, give the region a 44.22% volume share and the fastest 16.78% CAGR.
How are automotive manufacturers using bio-based polymers?
OEMs integrate flax-fiber reinforced bio-polyamides and bio-polyurethane adhesive films to meet lightweighting and carbon-reduction goals without sacrificing performance.
Page last updated on:


