
Electric Vehicle Battery Coolant Market Size and Share
Market Overview
| Study Period | 2019 - 2031 |
|---|---|
| Market Size (2026) | USD 2.06 Billion |
| Market Size (2031) | USD 2.57 Billion |
| Growth Rate (2026 - 2031) | 4.50 % |
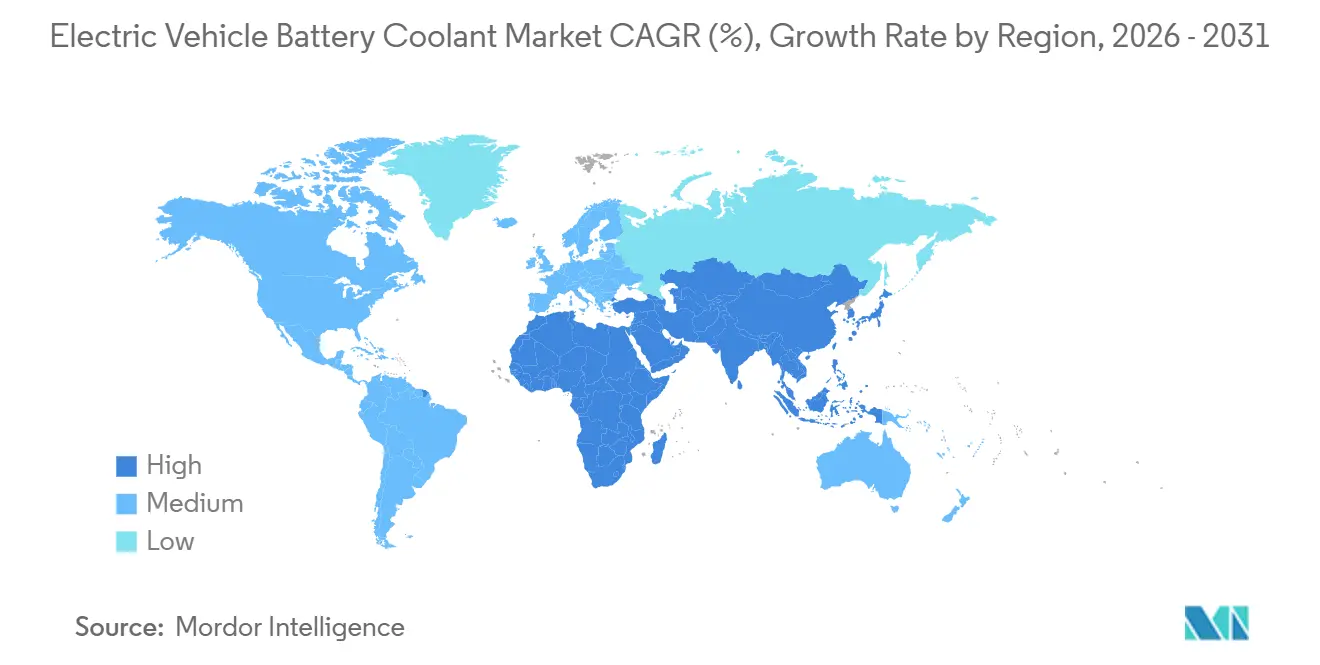
| Fastest Growing Market | Middle East and Africa |
| Largest Market | Asia Pacific |
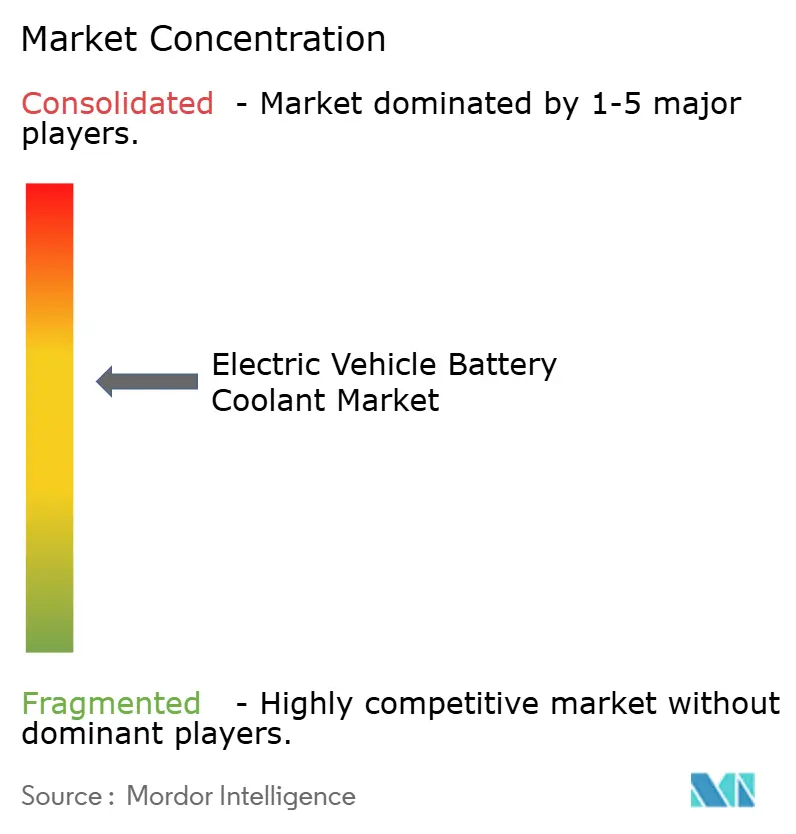
| Market Concentration | Medium |
Major Players *Disclaimer: Major Players sorted in no particular order Image © Mordor Intelligence. Reuse requires attribution under CC BY 4.0. | |
Electric Vehicle Battery Coolant Market Analysis by Mordor Intelligence
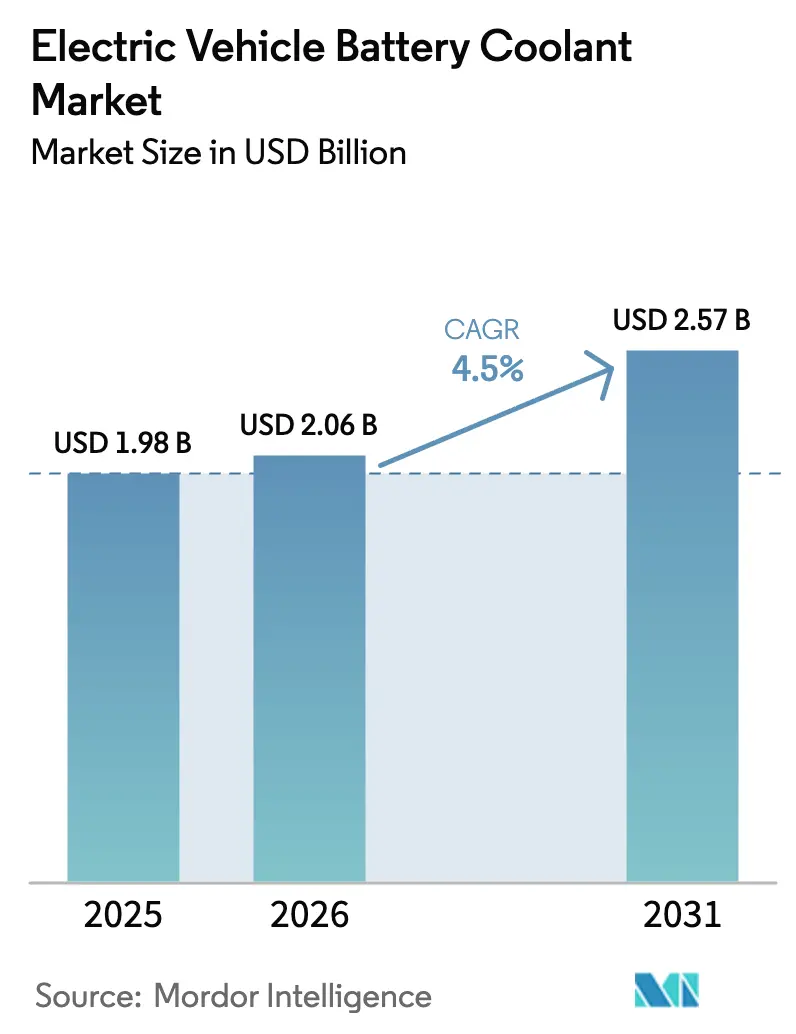
The electric vehicle battery coolant market size was valued at USD 1.98 billion in 2025 and estimated to grow from USD 2.06 billion in 2026 to reach USD 2.57 billion by 2031, at a CAGR of 4.50% during the forecast period (2026-2031). The moderate growth trajectory reflects broad OEM reliance on established water-glycol chemistries even as global EV deliveries accelerate. Commercial momentum now centers on premium-priced dielectric and nanofluid formulations that support 800-volt platforms, ultra-fast charging, and stringent thermal-runaway regulations. Asia-Pacific drives nearly half of worldwide revenue on the back of China’s volume leadership and GB 38031 safety mandate, while the Middle East and Africa emerge as the fastest-growing region as Gulf fleets electrify under extreme heat. Competitive intensity is rising as lubricant majors use refinery-scale glycol procurement to defend price leadership, whereas niche suppliers commercialize immersion-cooling and graphene-nanofluid technologies to secure high-margin contracts. Feedstock volatility and the long-term promise of solid-state batteries temper value-creation expectations but do not derail near-term demand for purpose-built fluids that protect battery warranties and enable ten-minute charging.
Key Report Takeaways
- By coolant type, water-based blends held 56.10% of the electric vehicle battery coolant market share in 2025, while advanced nanofluids are forecast to expand at a 7.18% CAGR through 2031.
- By propulsion type, battery electric vehicles commanded 73.12% revenue share in 2025; fuel cell electric vehicles exhibit the highest projected 10.36% CAGR to 2031.
- By vehicle type, passenger cars captured 59.18% share of the electric vehicle battery coolant market size in 2025, whereas off-highway EVs are advancing at a 6.85% CAGR through 2031.
- By distribution channel, original equipment manufacturer (OEM) supply routes controlled 81.20% of revenue in 2025, but the aftermarket is poised for a 7.52% CAGR as warranty periods expire.
- By end-use application, battery packs absorbed 87.45% of 2025 revenue; motors and power electronics are projected to grow at a 5.41% CAGR to 2031.
- By geography, Asia-Pacific dominated with a 46.13% share in 2025, while the Middle East and Africa region is projected to grow at a 6.15% CAGR through 2031.
Note: Market size and forecast figures in this report are generated using Mordor Intelligence’s proprietary estimation framework, updated with the latest available data and insights as of January 2026.
Market Trends and Insights
Drivers Impact Analysis of Electric Vehicle Battery Coolant Market*
| Driver | (~) % Impact on CAGR Forecast | Geographic Relevance | Impact Timeline |
|---|---|---|---|
| Accelerating EV Production | +0.8% | China, Europe, North America | Medium term (2-4 years) |
| Shift Toward Liquid-Cooled Batteries | +0.6% | North America, Europe, China | Medium term (2-4 years) |
| Fast-Charging Infrastructure Expands | +0.5% | Europe, China, North America | Medium term (2-4 years) |
| Stringent Rules on Thermal-Runaway | +0.4% | China, Europe, wider Asia-Pacific | Short term (≤ 2 years) |
| 800-V Architectures Drive Demand | +0.4% | Europe, North America, South Korea | Long term (≥ 4 years) |
| Two/Three-Wheeler EV Boom | +0.3% | India, Indonesia, Vietnam, Thailand | Short term (≤ 2 years) |
| Source: Mordor Intelligence | |||


Accelerating Global EV Production Volumes
In 2025, global production of light-duty electric vehicles (EVs) experienced significant growth, driving a corresponding increase in coolant demand proportional to the installed battery capacity. Coolants are essential for maintaining battery performance, with each unit of capacity requiring a specific volume of fluid. However, despite the rise in production, revenue growth has not kept pace. This is primarily due to a majority of platforms continuing to use low-margin glycol blends. A prominent EV manufacturer, BYD, exemplifies this trend by relying on legacy coolants, highlighting the gap between production volume and revenue generation. Consequently, suppliers are shifting their focus from sheer volume growth to enhancing product attributes such as thermal conductivity and dielectric strength. This shift is particularly evident in European and North American markets, where original equipment manufacturers (OEMs) are willing to invest in premium fluids that enable rapid charging. This has created a divided market landscape, where unit expansion and value creation are increasingly decoupled.
OEM Shift Toward Liquid-Cooled Battery Packs
To meet range and charging expectations, automakers have largely moved away from air-cooled packs. General Motors’ Ultium platform circulates glycol-water through cold plates, enabling high-performance DC charging with a slight increase in material costs per vehicle[1]“Ultium Platform Overview 2024,” General Motors, gm.com. Tesla’s 4680 structural pack uses coolant channels between cylindrical cells, achieving reduced mass and an extended cycle life. Ford and Volkswagen adopt similar designs, while BASF clinches a proprietary blend contract for MEB-based models. Liquid cooling has evolved into a warranty hedge, ensuring consistent demand throughout industry cycles.
Expansion of Fast-Charging Infrastructure
In 2024, Europe saw significant growth in ultra-fast charging sites, reflecting advancements in charging infrastructure. These sites feature high-performance dispensers that generate heat flux surpassing traditional coolant limits. Porsche's Taycan employs advanced dielectric fluid technology to achieve rapid charging within minutes. Similarly, BYD's Han sedan leverages innovative graphene-nanofluid solutions to reduce charging times, highlighting the ongoing competition between infrastructure development and coolant efficiency.
Stringent Safety Rules on Thermal-Runaway Mitigation
China’s GB 38031 and Europe’s UN ECE R100 mandate that a cell in thermal runaway must not propagate for five minutes, driving adoption of flame-inhibited water-glycol coolants [2]“GB 38031-2020 Safety Requirements for EV Power Storage Systems,” Ministry of Industry and Information Technology, miit.gov.cn. Shell’s phosphate-enhanced E-Thermal Fluid G pushes auto-ignition to 320°C versus 180°C for base propylene glycol. Regulatory recalls, such as South Korea’s Kona Electric campaign, trigger immediate fluid replacement surges independent of new-vehicle sales.
Restraints Impact Analysis of Electric Vehicle Battery Coolant Market*
| Restraint | (~) % Impact on CAGR Forecast | Geographic Relevance | Impact Timeline |
|---|---|---|---|
| High Cost of Specialized Coolants | −0.3% | India, Southeast Asia, South America | Short term (≤ 2 years) |
| Volatile Glycol Prices | −0.2% | Middle East-dependent regions | Short term (≤ 2 years) |
| No Universal Conductivity Standard | −0.2% | China, Europe, North America | Medium term (2-4 years) |
| Solid-State Cuts Thermal Load | −0.2% | Japan, Europe, North America | Long term (≥ 4 years) |
| Source: Mordor Intelligence | |||
High Unit Cost of Specialized EV Coolants
Dielectric and nanofluid products are significantly more expensive than glycol, limiting their adoption in price-sensitive markets. Engineered Fluids’ BitCool is priced at a level justified primarily in racing or immersion-cooling applications, where warranty risks are heightened. OEMs are unlikely to accept such a premium unless the fluid can demonstrably reduce charge time significantly or extend battery life substantially—benefits currently validated only in lab settings. While BASF is making strides with its G40 EV at a comparatively lower price, it still leads to an increase in total vehicle material costs in markets where affordability heavily influences purchasing decisions.
Volatile Glycol Feed-Stock Prices
In 2024, spot prices for ethylene and propylene glycols—key components making up a significant portion of finished coolant costs—experienced a sharp increase due to outages in Saudi Arabia. This surge tightened supplier margins on short-term contracts. Producers faced a dilemma: absorb the losses or implement mid-year price hikes, which would likely lead to the dissatisfaction of OEMs bound to fixed vehicle MSRPs. Highlighting the impact, Shell’s 2024 annual filing revealed a notable decline in gross margin attributed to raw material volatility. In response, the company is hastening its bio-based glycol pilot projects in Texas and São Paulo.
*Our forecasts treat driver/restraint impacts as directional, not additive. The impact forecasts reflect baseline growth, mix effects, and variable interactions.
Electric Vehicle Battery Coolant Market Segment Analysis
By Coolant Type:
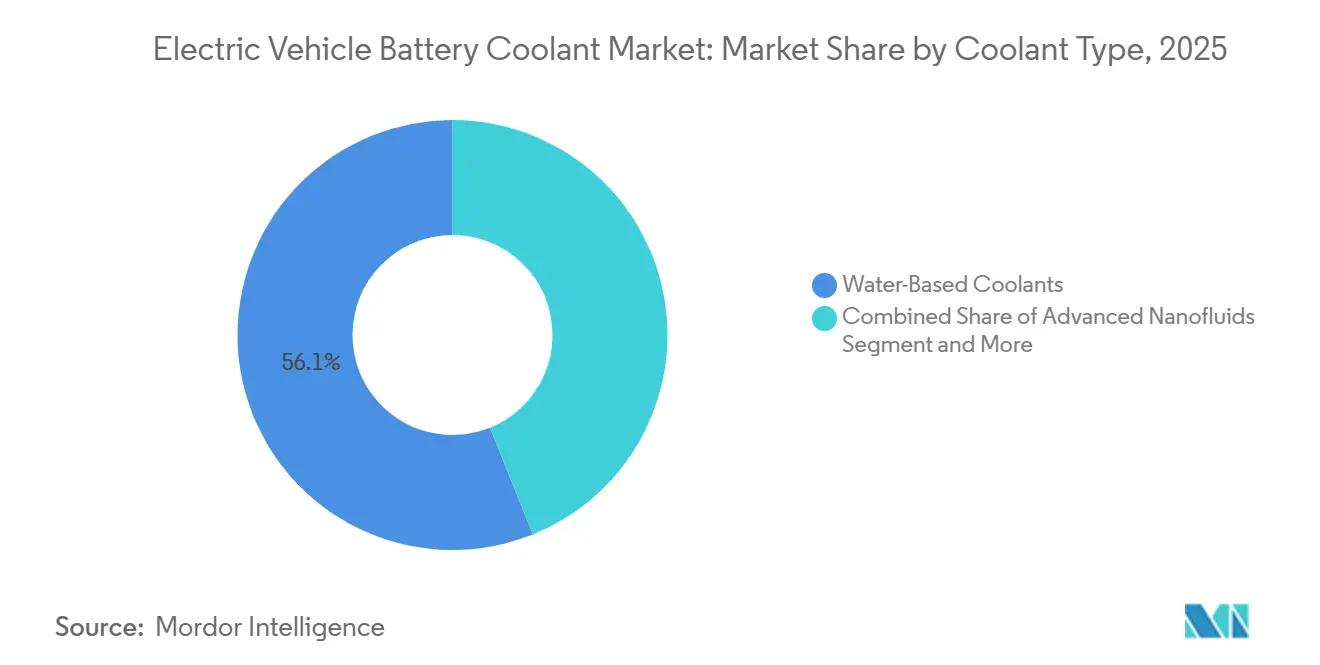
Glycol Blends Anchor Volume, Nanofluids Chase PerformanceWater-based blends secured 56.10% of 2025 revenue as automakers favored mature supply chains and low price points. Dielectric fluids captured a notable share serving 800-volt architectures, while advanced nanofluids are set for a 7.18% CAGR as graphene additives raise thermal conductivity and carve a premium niche [3]“Graphene Nanofluid Thermal Conductivity Study,” IEEE, ieee.org. The electric vehicle battery coolant market size for nanofluids is projected to climb significantly by 2031, underscoring performance-led adoption. Longer-term uptake hinges on stabilizer chemistries that prevent particle agglomeration over ten-year duty cycles.
Secondarily, the electric vehicle battery coolant market faces a glide path where incremental nanoparticle adoption into glycol matrices boosts conductivity without breaching OEM filter-clog risk thresholds. Suppliers offering validated 3,000-hour dispersion data stand to win early contracts, but extended durability proof remains the gating factor for full-scale rollouts.


By Propulsion Type:
BEVs Dominate, FCEVs Demand Exotic FluidsBattery electric vehicles accounted for 73.12% of 2025 demand, equating to an electric vehicle battery coolant market size that grows in line with global electric vehicle (EV) deliveries. Fuel cell electric vehicles, though niche, will post the highest 10.36% CAGR as hydrogen trucks and buses demand dielectric fluids. This dynamic secures outsized margins for specialty chemical suppliers even as absolute liters remain modest. Plug-in hybrids shrink over the horizon period, reinforcing battery electric vehicle (BEV) primacy in coolant volume.
Inherent stack voltage and higher waste-heat generation make fuel cell electric vehicles (FCEVs) reliant on fluorocarbon-based dielectrics, positioning early movers with patent-protected formulations to capture a disproportionate share of future contracts.
By Vehicle Type:
Passenger Cars Lead, Off-Highway Electrification AcceleratesPassenger cars delivered 59.18% revenue in 2025, translating to a significant electric vehicle battery coolant market size. Off-highway electric vehicles (EVs), though only a nominal share of volume, generate above-average consumption per unit because a mining truck’s pack holds greater than 25 L of fluid. Forecast 6.85% CAGR reflects tightening European Stage V rules and California’s off-road zero-emission mandates, driving adoption of sealed dielectric loops that can withstand dust and vibration.
Two-wheeler liquid cooling remains confined to premium scooters in urban India and Vietnam, but rising ambient temperatures and warranty extensions could propel broader uptake after 2028.
By Distribution Channel:
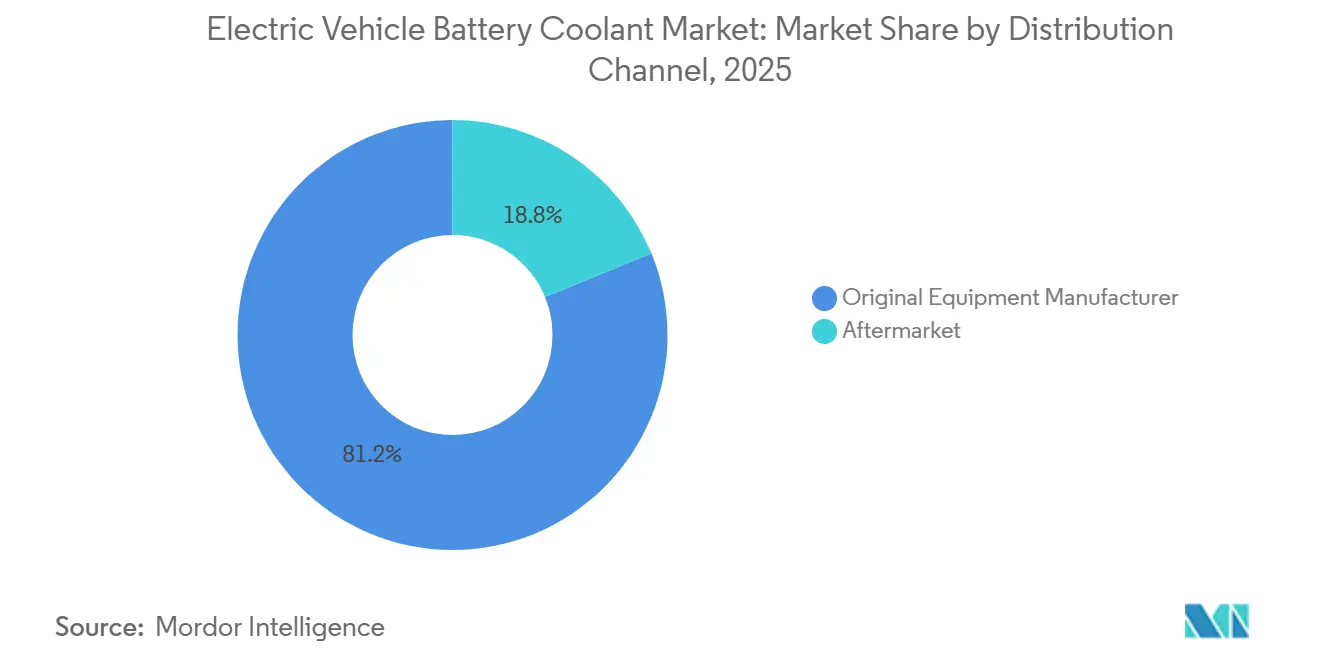
OEM Lock-In Dominates, Aftermarket AwakensOriginal equipment manufacturer (OEM) channels captured 81.20% of 2025 revenue, underpinning supplier strategies focused on multi-year homologation contracts that include initial factory fill. As the global electric vehicle (EV) fleet matures, aftermarket demand should grow 7.52% annually, driven by 10-year service intervals and independent workshops stocking universal fluids that undercut dealership prices.
Fleet operators introduce a third channel layer. Amazon, through its in-house servicing of Rivian vans, demonstrates how large-scale buyers can strategically bypass retail mark-ups, leverage their purchasing power, and significantly influence supplier margins in the process.
By End-Use Application:
Battery Packs Absorb Majority, Power Electronics Heat UpBattery packs consumed 87.45% of 2025 coolant revenue; however, silicon-carbide inverter penetration elevates power-electronics loops to a 5.41% CAGR. With the increasing adoption of dual-loop architectures, the role of electronics-focused fluids in the electric vehicle battery coolant market is expected to grow significantly.
These fluids are becoming critical as integrated thermal systems gain prominence, offering a solution that effectively balances conductivity and resistivity within a single formulation. This shift highlights a competitive landscape where formulators are striving to develop advanced solutions that cater to the evolving needs of electric vehicle platforms.
Geography Analysis
APAC Electric Vehicle Battery Coolant Market
Asia-Pacific generated 46.13% of 2025 revenue, anchored by China’s significant electric vehicle (EV) sales and the GB 38031 rule that mandates liquid cooling for packs above 50 kWh. BYD sources low-cost glycol from Sinopec, squeezing foreign suppliers on price, while India’s FAME-II policy pushes liquid cooling into premium two-wheelers that tackle summer temperatures above 40 °C. Japan remains a niche dielectric hub for fuel-cell buses, and South Korea’s GS Caltex secures captive demand from Hyundai-Kia 800-volt models.
Europe and North America Electric Vehicle Battery Coolant Market
Europe delivered a notable share of global revenue in 2025 as CO₂ fleet penalties and PFAS-free rules raised per-liter costs and favored suppliers with compliant chemistries. Volkswagen’s significant regional electric vehicle (EV) sales underpin a BASF supply pact that guarantees volume but dictates tight conductivity limits. North America added a significant share; the Inflation Reduction Act content rules channel OEMs to domestic glycol plants in Texas and Ontario, accelerating reshoring investments while protecting margins against import volatility.
MEA and South America Electric Vehicle Battery Coolant Market
The Middle East and Africa, though only a nominal share of the 2025 volume, post a 6.15% CAGR as Gulf taxi electrification demands high-temperature-stable coolants. Saudi funding of Lucid’s Jeddah plant seeds a regional blending opportunity for early movers. South America contributes 3% of revenue, with Brazil’s ethanol heritage spurring bio-based propylene glycol that trims fossil reliance and supports local value chains.

Regulatory Landscape
EV battery coolants sit at the intersection of battery-safety rules and coolant-specific conductivity and compatibility requirements. In China, GB 29743.2-2025, implemented in October 2025, formalizes EV-coolant performance expectations, including a maximum electrical conductivity limit of 100 µS/cm and expanded indicator sets (including multi-metal compatibility for common aluminum alloys). This tightens qualification pathways for low-electrical-conductivity coolant (LECC) suppliers.
Globally, standardization is advancing but remains fragmented across OEM specifications and test methods. ASTM has published EV-relevant coolant conductivity guidance (ASTM D8566 cites a 100 µS/cm limit for fresh coolants in battery EV applications), while ISO and SAE documents continue to frame battery thermal management and environmental testing practices (including SAE J3073). The uneven harmonization keeps validation workloads high and raises the importance of third-party testing and documentation during OEM homologation cycles.
Value Chain Analysis
The value chain starts with upstream feedstocks (ethylene/propylene glycol or base oils for dielectric fluids), additive packages (corrosion inhibitors, stabilizers, anti-foaming agents, and conductivity-control chemistries), and increasingly specialized inputs for advanced fluids, such as nanoparticle dispersions for nanofluids. Formulators blend and run quality control against tight conductivity and material-compatibility targets, then supply OEM factory-fill programs and Tier-1 thermal system integrators. OEM channels dominate volumes because coolant selection is locked during platform validation and pack warranty sign-off.
Downstream, validation and certification create a bottleneck that ties suppliers to test houses, engineering partners, and regulator-aligned certification routes. BASF has positioned production of its low-electrical-conductivity coolants in Shanghai, with certification referenced to bodies such as SGS and RATTC under China’s Ministry of Transport framework, while Shell has highlighted collaborations with HORIBA MIRA for thermal-fluid testing. As architectures move toward integrated thermal loops spanning the battery, motor, and power electronics, coolant suppliers, Tier-1s, and OEMs increasingly co-develop specifications. This pattern favors firms with global labs and repeatable quality systems, keeping switching costs high.
Competitive Landscape
The top five suppliers—ExxonMobil, Shell, TotalEnergies, BASF, and Valvoline—command a notable share, characterizing the electric vehicle battery coolant market as moderately concentrated. Shell secures volume through multi-year original equipment manufacturer (OEM) contracts, sacrificing margin for scale, whereas BASF pursues vertical integration to embed proprietary additives that support significant price premiums.
Engineered Fluids and XING Mobility disrupt with immersion-cooling and graphene-nanofluid patents, targeting segments where traditional glycol cannot meet ten-minute charging or 150 °C silicon-carbide junction limits. Castrol’s dual-function ON EV Transmission Fluid exemplifies consolidation of inverter and drivetrain cooling into a single product, reducing loop complexity and boosting per-liter value capture.
Regional challengers, notably GS Caltex in South Korea and Prestone in North America's aftermarket, leverage captive OEM ties or universal-spec formulations to erode incumbent share. Bio-based glycol initiatives from Valvoline and Braskem portend ESG-led differentiation as regulators tighten cradle-to-grave carbon accounting.
Electric Vehicle Battery Coolant Industry Leaders
Exxon Mobil Corporation
BASF SE
Shell plc
Castrol Limited (BP p.l.c.)
Valvoline Inc.
- *Disclaimer: Major Players sorted in no particular order
Electric Vehicle Battery Coolant Market Companies Covered in this Report
- Exxon Mobil Corporation
- BASF SE
- Shell plc
- Castrol Limited (BP p.l.c.)
- Valvoline Inc.
- TotalEnergies SE
- FUCHS SE
- Prestone Products Corporation
- Arteco NV
- Dober
- GS Caltex Corporation
- Engineered Fluids
- XING Mobility
- Motul S.A.

Market Opportunities and Future Outlook
A major whitespace is opening as the industry shifts from conventional glycol-water toward low-electrical-conductivity coolants and dielectric fluids that can operate safely around high-voltage components and fast-charging heat flux. China’s rollout of GB 29743.2-2025, implemented in October 2025, provides a clear compliance pull for LECC products. Suppliers with localized manufacturing and certification pathways have a faster route into new-platform approvals, and BASF’s GLYSANTIN ELECTRIFIED production footprint in Shanghai is an example of capacity aligned to that regulatory and OEM qualification environment.
Another opportunity comes from single-circuit, multi-component thermal management, where one fluid supports the battery pack, motor, and power electronics to simplify vehicle plumbing and reduce part counts. Shell’s EV-Plus Thermal Fluid positioning as an all-in-one thermal management solution designed for sub-ten-minute charging reflects how product roadmaps are targeting higher value-per-liter applications rather than commodity glycol supply. Suppliers that combine fluid chemistry with testing partnerships and documented durability in mixed-metal and low-conductivity environments are best positioned to win integrated-loop design work.
Recent Industry Developments in Electric Vehicle Battery Coolant Market
- July 2026: Hyundai WIA announced a 500 billion won investment to advance thermal management technology for future vehicles. The rollout includes upgrades for coolant production lines at its Slovakia plant and thermal management components at its Chennai, India plant, expanding in-house cooling capability and localizing supply for EVs.
- November 2025: Shell plc announced EV-Plus Thermal Fluid as an all-in-one thermal management solution for BEV powertrains enabling rapid charging. The development supports sub-10-minute charging and safety improvements in BEV cooling.
- November 2025: Castrol Limited (BP p.l.c.) / Lion Smart partnered to develop a battery module with direct battery-cooling technology for high-performance EVs. The collaboration advances direct battery-cooling technology for high-performance EVs.


Electric Vehicle Battery Coolant Market Report Scope and Research Methodology
Market Definition and Coverage
This market covers coolants used to control battery temperature in electric vehicles, including fluids used in indirect cooling loops and in direct-contact approaches where applicable. Values are captured at the coolant product level across OEM fill and the aftermarket, for all major EV propulsion categories.
Scope exclusions: We exclude cabin HVAC refrigerants, thermal interface pads and gels, and hardware like pumps, cold plates, radiators, and heat exchangers.
Segments Covered in This Report
- By Coolant Type
- Water-Based Coolants
- Dielectric Fluids (Non-conductive Oils)
- Advanced Nanofluids
- By Propulsion Type
- Battery Electric Vehicles (BEVs)
- Hybrid Electric Vehicles (HEVs)
- Plug-in Hybrid Electric Vehicles (PHEVs)
- Fuel Cell Electric Vehicles (FCEVs)
- By Vehicle Type
- Two-Wheelers
- Three-Wheelers
- Passenger Cars
- Commercial Vehicles
- Off-Highway EVs
- By Distribution Channel
- Original Equipment Manufacturer (OEM)
- Aftermarket
- By End-Use Application
- Battery Packs
- Motors and Power Electronics
- By Geography
- North America
- United States
- Canada
- Rest of North America
- South America
- Brazil
- Argentina
- Rest of South America
- Europe
- Germany
- United Kingdom
- France
- Italy
- Spain
- Rest of Europe
- Asia-Pacific
- China
- India
- Japan
- South Korea
- Rest of Asia-Pacific
- Middle East and Africa
- United Arab Emirates
- Saudi Arabia
- South Africa
- Turkey
- Rest of Middle East and Africa
- North America
Data Sources, Market Sizing, and Validation
Desk Research
Desk work was used to anchor the model to observable EV activity and coolant demand drivers, and then to keep assumptions realistic by geography. We relied on public sources such as the International Energy Agency (EV outlook and stock), U.S. DOE and NREL publications on battery thermal management, the European Commission and UNECE policy releases, and national vehicle registration statistics where available.
On the supply side, we referenced sources such as UN Comtrade trade flows for relevant chemical categories, EPA and ECHA chemical guidance (including safety and environmental restrictions that can reshape formulations), and peer-reviewed journals that describe conductivity targets and temperature bands needed for battery safety. We also screened company filings, investor presentations, and trusted press for capacity additions and product positioning, and used paid subscriptions for company financials and patent databases to reduce the risk of missing smaller but fast-growing chemistry activity. The sources listed here are illustrative, and other public and paid references were used for data collection, cross-checks, and clarification.
Primary Interviews and Surveys
Primary discussions helped us map EV build activity to coolant value by validating usage rates, service intervals, and pricing movement by chemistry before final assumptions were set. We spoke with a mix of coolant formulators, distributors, and vehicle and component ecosystem participants across APAC, EMEA, and the Americas to test regional differences, then reconciled the gaps we saw against desk indicators.
Distribution of primary research fieldwork respondents
| Company type | Respondent position | Region |
|---|---|---|
| Top tier: 32% | CXOs: 17% | APAC: 49% |
| Mid tier: 47% | Functional/Unit leaders: 24% | EMEA: 29% |
| Smaller Players: 21% | Managers: 59% | Americas: 22% |
Market-Sizing & Forecasting
Sizing starts with a top-down demand pool build, where EV production, EV parc, and battery-pack thermal design choices are translated into coolant consumption and replacement needs, and then into value using observed price ranges. In practice, we split demand into OEM fill and aftermarket replacement, and then apply region-specific adoption for liquid cooling and direct-contact dielectric fluids, followed by conversion into USD.
To keep totals grounded, results are corroborated with selective bottom-up checks such as sampled supplier revenue exposure to EV coolants, channel checks on common pack-coolant volumes per vehicle, and ASP-by-chemistry spot ranges that are adjusted for concentration and packaging mix. Key inputs used in the model include BEV and PHEV build volumes, average pack size trends that influence heat loads, the share of liquid-cooled battery systems, drain and refill intervals, and chemistry mix shifts between glycol-based and dielectric fluids, which can move price points even when volumes stay steady. Where direct company disclosures were not available, gaps were handled by using proxy shares from trade flows, patent activity direction, and interview-led ranges that were stress-tested.
Forecasting uses scenario analysis supported by multivariate regression on EV sales growth and cooling-system penetration, with separate assumptions for premium high-voltage platforms that tend to drive more advanced coolant requirements. We also applied conservative price progression logic by region so that inflation, raw material swings, and formulation changes do not get double-counted in growth.
Data Validation & Update Cycle
Outputs were validated through stepwise checks that compare the modeled coolant demand against independent EV signals, including vehicle builds, battery deployment trends, and regional aftermarket intensity indicators. Any large variance that could not be explained by a clear change in chemistry mix, service interval, or geography was flagged for analyst review, and then re-tested with follow-up outreach to relevant respondents.
Before sign-off, we run internal consistency checks across related markets in the EV thermal ecosystem, and a second analyst reviews the spreadsheet logic to catch unit or currency handling issues. Reports refresh annually, with interim updates when major events occur such as sharp EV volume revisions, regulatory changes affecting formulations, or sudden pricing shifts. Right before delivery, a fresh pass is performed so clients receive an updated view aligned to the latest available evidence.
Mordor Intelligence's Electric Vehicle Battery Coolant Market Size Versus Other Published Estimates
It is normal to see different market values for EV battery coolants because publishers may start from different EV demand signals, and they may also treat pricing and currency timing in different ways. Even when the topic label looks the same, the details often change, like whether the estimate leans more toward OEM fill versus aftermarket, or whether advanced dielectric coolants are counted consistently.
The spread is usually driven by refresh cadence and what is used as the current price base, since coolant ASPs can move with raw material costs and shifts in chemistry mix. In this study, FX timing and year-specific ASP checks were refreshed close to the valuation year, and that update cycle is a key reason the 2025 total differs in places, a modeling choice applied by Mordor Intelligence.
Benchmark comparison
| Source | Market Size | Gaps in Research Methodology |
|---|---|---|
| Mordor Intelligence | USD 1.98 B (2025) | |
| Trade Journal A | USD 2.07 B (2024) | Uses a 2024 base and does not clearly separate OEM fill from replacement demand, which can shift value when EV parc growth and service intervals are blended. |
| Industry News Desk B | USD 2.12 B (2024) | Reports a single 2024 estimate with limited visibility on currency conversion timing and chemistry mix assumptions, which can inflate or compress ASPs versus a year-specific pricing build. |
Looking at the three figures together, the biggest differences come from how current-year pricing is handled and whether replacement demand is modeled separately from first fill. By keeping the model tied to EV volume indicators, coolant penetration, and a clear ASP-by-chemistry logic, we can explain each step and repeat the sizing as new EV and pricing data becomes available without changing the scope midstream.


Key Questions Answered in the Report
What is the current value of the electric vehicle battery coolant market?
The market stands at USD 2.06 billion in 2026 and is projected to reach USD 2.57 billion by 2031.
Which coolant type leads global revenue?
Water-based glycol blends held a 56.10% share because they offer mature supply chains and low cost.
Why are dielectric coolants gaining traction?
800-volt architectures and ten-minute fast charging demand non-conductive fluids that prevent electrical arcing while dissipating high heat loads.
Which region is expanding the fastest?
The Middle East and Africa register a 6.15% CAGR as Gulf countries electrify taxi and bus fleets under extreme ambient temperatures.
Page last updated on:





