Electric Propulsion Systems Market Size and Share
Market Overview
| Study Period | 2019 - 2031 |
|---|---|
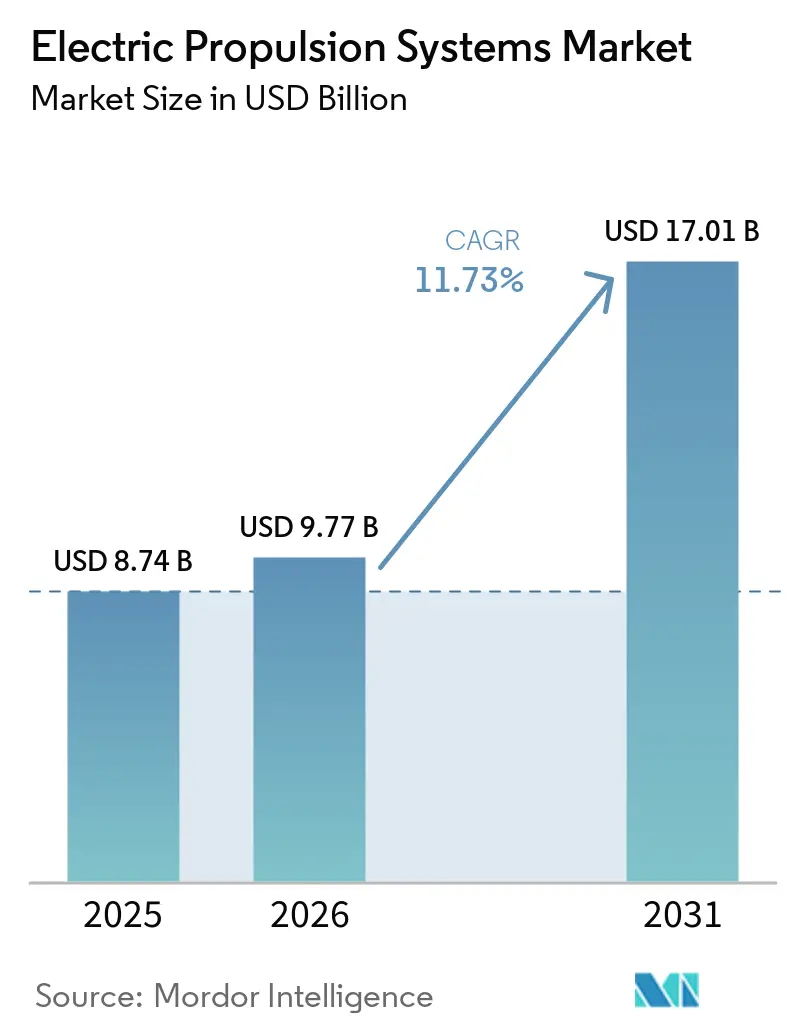
| Market Size (2026) | USD 9.77 Billion |
| Market Size (2031) | USD 17.01 Billion |
| Growth Rate (2026 - 2031) | 11.73% CAGR |
| Fastest Growing Market | Asia Pacific |
| Largest Market | North America |
| Market Concentration | Medium |
Major Players *Disclaimer: Major Players sorted in no particular order Image © Mordor Intelligence. Reuse requires attribution under CC BY 4.0. | |
Electric Propulsion Systems Market Analysis by Mordor Intelligence
The electric propulsion systems market size is expected to grow from USD 8.74 billion in 2025 to USD 9.77 billion in 2026 and is forecast to reach USD 17.01 billion by 2031, at a 11.73% CAGR over 2026-2031. Decarbonization mandates in shipping and aviation, the miniaturization of Hall-effect thrusters for small satellites, and naval lifecycle-cost optimization collectively reshape the propulsion cost curve across air, sea, land, and space platforms. Market expansion is further amplified by battery energy density gains exceeding 400 Wh/kg, Integrated Full Electric Propulsion (IFEP) retrofits that reduce vessel operating expenditure by more than 15%, and regulatory certainty provided by FAA and EASA guidance on eVTOLs' EMI compliance. Supply-chain pressure around high-voltage batteries and noble-gas propellants, however, continues to temper short-term shipments despite strong order pipelines.
Key Report Takeaways
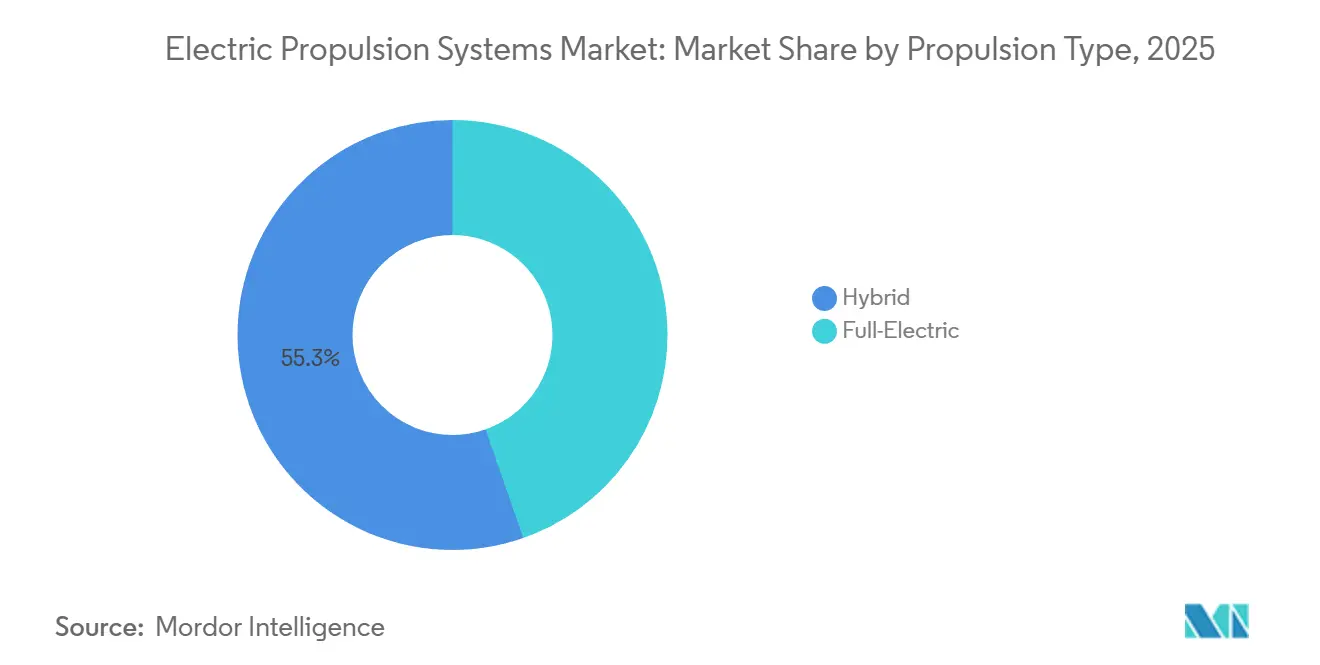
- By propulsion type, hybrid architectures accounted for 55.34% of the electric propulsion systems market share in 2025. Full-electric systems are projected to expand at a 12.65% CAGR between 2026 and 2031.
- By platform, airborne applications led with a 46.38% revenue share in 2025; space propulsion is projected to accelerate at a 13.58% CAGR through 2031.
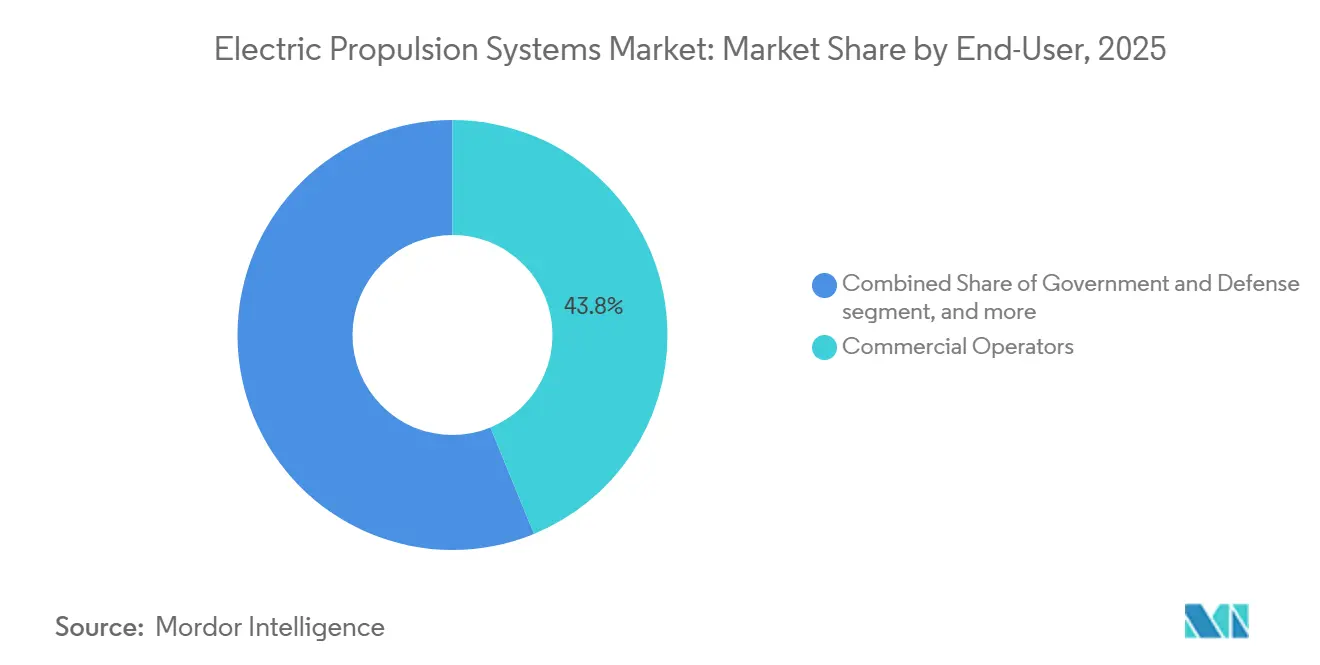
- By end user, commercial operators accounted for 43.81% of the electric propulsion systems market size in 2025, while government and defense spending is projected to rise at an 11.92% CAGR through 2031.
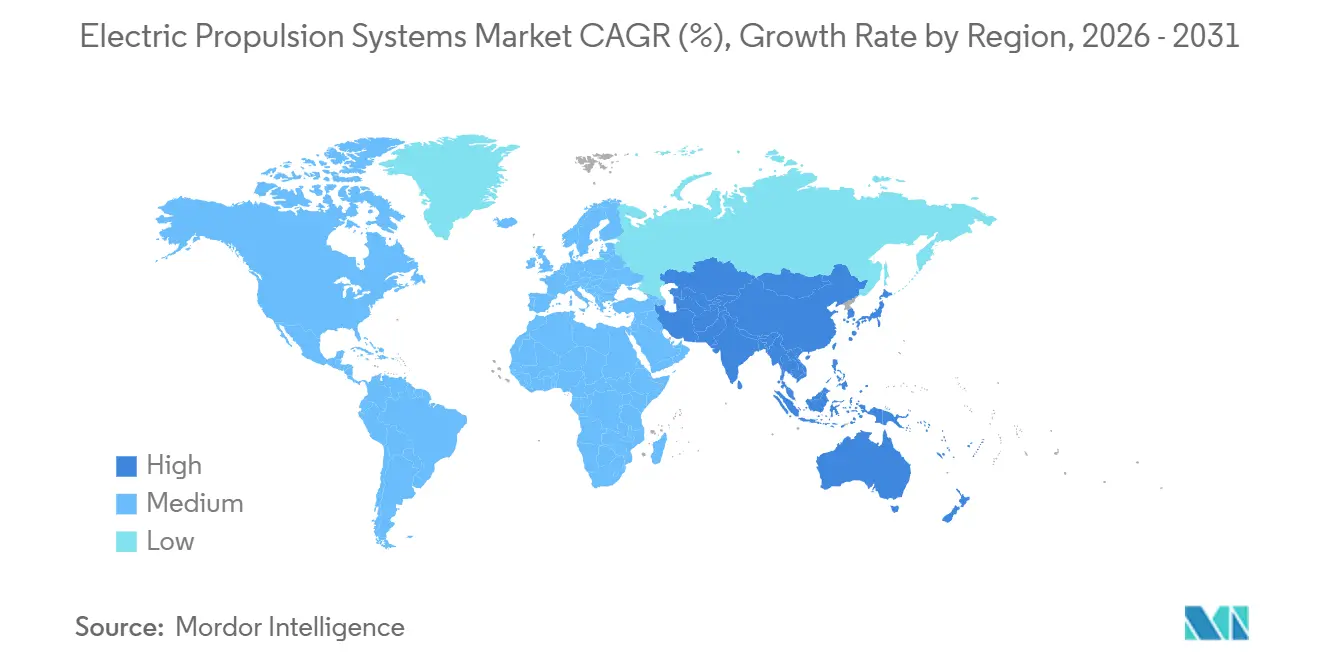
- By geography, North America accounted for 39.27% of the 2025 revenue, whereas Asia-Pacific is forecasted to advance at a 12.38% CAGR through 2031.
Note: Market size and forecast figures in this report are generated using Mordor Intelligence’s proprietary estimation framework, updated with the latest available data and insights as of January 2026.
Global Electric Propulsion Systems Market Trends and Insights
Drivers Impact Analysis*
| Driver | (~) % Impact on CAGR Forecast | Geographic Relevance | Impact Timeline |
|---|---|---|---|
| Fleet-level decarbonization mandates | +2.8 % | Global, strongest in EU and North America | Medium term (2-4 years) |
| Rapid miniaturization of Hall-effect thrusters for New-Space small-sat constellations | +2.1 % | Global, led by North America and Asia-Pacific | Short term (≤2 years) |
| Naval IFEP retrofits unlocking lifetime OPEX savings greater than 15% | +1.9 % | North America, Europe, India, Japan | Long term (≥4 years) |
| Megawatt-class hybrid-electric demonstrators entering commercial flight tests | +1.7 % | North America, spill-over to Europe | Medium term (2-4 years) |
| Arctic shipping corridors favouring ice-class podded electric drives | +1.3 % | Europe (Norway, Russia), Canada | Long term (≥4 years) |
| On-orbit servicing demand driving sub-kW EP thrusters | +1.2 % | Global, concentrated in North America | Medium term (2-4 years) |
| Source: Mordor Intelligence | |||
Fleet-Level Decarbonization Mandates (IMO CII, ICAO LTAG)
The IMO’s revised Carbon Intensity Indicator requires annual efficiency gains to rise from 13.625% in 2027 to 21.500% by 2030, forcing operators to accelerate electric and hybrid retrofits to avoid D- and E-rated vessels, which face port restrictions and insurance penalties.[1]International Maritime Organization, “Marine Environment Protection Committee MEPC 83 Amendments to MARPOL Annex VI,” imo.org ICAO’s Long-Term Aspirational Goals likewise embed electricity and hydrogen into aviation’s 2050 net-zero pathway. Carbon-price exposure under the EU Emissions Trading System and prospective ICAO fuel-levy schemes is redirecting capex toward electric propulsion, raising order volumes well above replacement rates for legacy powertrains.
Rapid Miniaturization of Hall-Effect Thrusters for New-Space Constellations
Sub-100 W Hall-effect thrusters now enable 3U CubeSats to perform orbit raising and station-keeping, enabling high-density constellations for broadband and Earth observation. Busek’s BIT-3 RF ion thruster produces 1.5 mN within a 3U footprint and removes high-pressure xenon tanks.[2]Busek Co. Inc., “BIT-3 RF Ion Thruster,” busek.com Exotrail’s exoMG™ line scales to 1,500 W, providing operators with propellant flexibility as xenon prices rose by more than 40% during 2020-2023. Lower unit costs, now under USD 50,000, maintain constellation economics despite a rising launch cadence.
Naval IFEP Retrofits Unlocking Lifetime OPEX Savings Which are Greater Than 15 %
Medium-voltage direct-current architectures, silicon-carbide power converters, and high-temperature superconducting motors enable navies to break the mechanical link between gas turbines and propellers, allocating power where it is most efficient at any given moment. The US Navy’s roadmap projects cumulative fuel and maintenance savings of over 15% over a 30-year hull life, a figure that underpins budget justification for selective electric-propulsion upgrades on Arleigh Burke-class destroyers. France’s PA-NG carrier will employ all-electric drive fed by K22 nuclear reactors, signaling that IFEP is moving from research vessels to front-line capital ships. India and the United Kingdom are co-engineering similar systems for future Landing Platform Dock vessels, broadening supplier pipelines for medium-voltage switchgear and superconducting motors. Beyond cost relief, navies cite lower acoustic signatures that sharpen anti-submarine warfare performance and enable stealthier littoral operations.
Megawatt-Class Hybrid-Electric Demonstrators Entering Flight Tests
NASA and GE Aerospace have completed ground runs of a megawatt-class hybrid system that couples a GE Passport core to high-voltage batteries and a 1 MW electric motor, validating thermal management and electromagnetic shielding ahead of its first flight in the late 2020s. The program aims for a 30% fuel-burn reduction on single-aisle routes, positioning hybrid propulsion as a near-term step while battery energy density continues to improve. Boeing’s ecoDemonstrator and Airbus’s EcoPulse testbeds pursue parallel architectures, generating data for FAA Advisory Circular 21.17-4 and EASA VTOL MOC-4 compliance reviews. Early results show silicon-carbide inverters trimming inverter losses by double-digit percentages, a gain that directly enlarges battery-only cruise envelopes. Successful flight campaigns will shorten certification paths for regional hybrid aircraft entering service after 2028.
Restraints Impact Analysis*
| Restraint | (~) % Impact on CAGR Forecast | Geographic Relevance | Impact Timeline |
|---|---|---|---|
| Grid-scale battery supply crunch delaying high-voltage aviation packs | −1.4 % | Global, acute in North America and Europe | Short term (≤2 years) |
| Xenon and krypton price spikes raising satellite EP BOM by greater than 12% | −1.1 % | Global, concentrated in North America and Europe | Medium term (2-4 years) |
| Electromagnetic interference (EMI) certification gaps for eVTOL propulsion in urban airspace | −0.9 % | North America, Europe, Japan, China | Short term (≤2 years) |
| Shipyard skill shortages for full-electric retrofit projects | −0.7 % | Europe, North America, South Korea | Medium term (2-4 years) |
| Source: Mordor Intelligence | |||
Grid-Scale Battery Supply Crunch
Automotive manufacturers secure the majority of lithium-ion cell output, forcing aerospace integrators to queue for limited high-voltage packs that must exceed 400 Wh/kg and pass stringent RTCA DO-311A abuse tests.[3]Bloomberg News, “Battery Supply Chain Constraints Delay Aviation Electrification,” bloomberg.com Cell suppliers are reluctant to retool for low-volume aviation formats without USD 100 million-plus gigafactory upgrades, which can extend lead times to three years or more. Solid-state pioneers QuantumScape and Factorial Energy have signed development MoUs with airframers. Yet, their commercial lines remain at pilot scale, keeping eVTOL and short-haul hybrids on a 2027-2028 service horizon. The bottleneck also inflates qualification costs, as every chemistry change triggers fresh thermal-runaway and electromagnetic-compatibility testing cycles. Until parallel aerospace-grade production ramps up, propulsion programs will prioritize certification milestones based on battery availability rather than aerodynamic readiness.
Xenon Price Volatility Threatens Satellite Propulsion Economics
Russia-Ukraine supply disruptions lifted xenon and krypton prices by more than 40% between 2020 and 2023, adding over 12% to the electric-propulsion bills of materials for communications-satellite primes. Operators are now exploring iodine propellant, which offers higher storage density and lower cost; however, its long-duration flight heritage is limited to recent 1,500-hour demonstrations by Exotrail’s exoMG™ thruster. Iodine’s corrosive nature demands Hastelloy or niobium feed systems, which lift thruster mass even as they cut tank pressure; thus, swap decisions hinge on mission length and delta-V budgets. Regulatory frameworks for iodine handling at launch sites are still evolving, which adds uncertainty to ground processing and slows constellation procurement cycles. Until a robust on-orbit track record is established, satellite builders must weigh propellant savings against potential in-service risk premiums charged by insurers.
*Our forecasts treat driver/restraint impacts as directional, not additive. The impact forecasts reflect baseline growth, mix effects, and variable interactions.
Segment Analysis
By Propulsion Type: Hybrid Architectures Bridge the Energy-Density Gap
Hybrid systems held 55.34% value share in 2025, reflecting operator preference for gas-turbine or diesel generators coupled with batteries and electric motors to balance range, payload, and zero-emission capability. NASA’s Electrified Powertrain Flight Demonstrator exemplifies the concept with a megawatt-class configuration, targeting 30% fuel savings on single-aisle aircraft. Marine operators echo the pattern: Ponant’s Le Commandant Charcot uses batteries for silent polar maneuvering and LNG engines for transits, illustrating how hybrids meet both endurance and emissions goals.[4]Ponant, “Le Commandant Charcot Hybrid LNG-Electric Vessel,” ponant.com
Full-electric adoption, although smaller, is growing at a 12.65% CAGR, thanks to urban air mobility, short-sea ferries, and space platforms where mission profiles align with battery density or where infrastructure provides continuous power. Siemens’ Mireo Plus B regional train recharges at station stops, while mining firms deploy battery haul trucks to cut underground ventilation costs. In orbit, Hall-effect and ion thrusters remain inherently electric, and miniaturization now allows 3U CubeSats to perform maneuvers once reserved for larger buses. The electric propulsion systems market size for full-electric solutions is expected to accelerate as battery costs decline and zero-emission regulations become more stringent.


By Platform: Space Propulsion Gains Momentum on Constellation Economics
Airborne platforms held 46.38% of 2025 revenue, but space systems are on track for a 13.58% CAGR through 2031, as Starlink, OneWeb, and Kuiper plan to launch more than 40,000 satellites, requiring electric thrusters for orbit raising and station keeping. On-orbit servicing further enlarges demand, with Mission Extension Pods extending satellite life at a fraction of replacement cost.
Terrestrial and marine platforms are expected to sustain steady growth through rail electrification and the decarbonization of ferries. Norway’s public ferry network achieves 60-80% cost reductions per voyage with battery-powered vessels. Naval programs increasingly specify IFEP to lower acoustic signatures for anti-submarine missions, an attribute that conventional shaft lines cannot deliver. The electric propulsion systems market size for terrestrial and marine applications is projected to sustain steady growth through 2031 as rail and ferry electrification expands.
By End User: Defense Procurement Intensifies
Commercial operators generated 43.81% of the 2025 revenue, leveraging carbon-pricing avoidance and fuel savings. Government and defense spending, however, is climbing at an 11.92% CAGR as navies retrofit destroyers with selective electric propulsion and carriers adopt all-electric architectures to maximize mission flexibility.
OEMs and system integrators capture value through certification and turnkey integration. Collins Aerospace supplies electric power systems, while Thales Alenia partners with Sitael to incorporate Hall-effect thrusters into satellite buses. Defense programs often favor open architectures, giving niche thruster specialists direct access to prime contracts.

Geography Analysis
North America held 39.27% of the 2025 value, underpinned by FAA certification pipelines and US Navy IFEP roadmaps. Battery shortages and delays in eVTOL EMI compliance, though, restrain near-term deliveries. Canada’s Coast Guard icebreakers choose Azipod drives that reduce polar fuel use by up to 15%. Mexico’s rail projects and new battery plants diversify regional demand.
Asia-Pacific is forecasted to expand at a 12.38% CAGR through 2031. China operates the world’s largest electrified rail network, India targets 100% broad-gauge electrification by 2030, and Japan advances marine electric-propulsion R&D. South Korean yards invest in LNG-carrier electrification but face workforce gaps as engineers migrate to the semiconductor industry.
Europe combines Green Deal incentives, Arctic shipping growth, and ferry electrification. Norway’s battery ferries slash per-voyage fuel costs, while France’s PA-NG carrier and Airbus’s CityAirbus NextGen showcase cross-segment electrification. South America, and the Middle East and Africa regions remain smaller but are gaining traction in mining and offshore support, where diesel volatility tilts economics toward electric.

Competitive Landscape
Market concentration is moderate. Aerospace primes, including General Electric Company, Safran SA, Airbus SE, Rolls-Royce plc, and Northrop Grumman Corporation, compete with space-propulsion specialists such as Busek, ENPULSION, and Exotrail, as well as marine integrators like Daihatsu Diesel and Collins Aerospace. Certification speed, battery pack sourcing, and EMI compliance have a significant impact on competitive positioning.
Northrop Grumman leads in on-orbit servicing, fielding the only flight-proven Mission Extension Vehicles.[5]Northrop Grumman, “Mission Extension Vehicles,” northropgrumman.com ENPULSION and Exotrail disrupt the market with iodine propulsion, which lowers bill-of-materials costs by more than 12%, challenging xenon-based incumbents.
Vertical integration accelerates. GE and Safran develop motors, power electronics, and thermal management in-house to control margins and timelines, while niche players defend technical moats around thruster miniaturization and ice-class pods. Patent intensity in silicon-carbide and gallium-nitride devices signals power-electronics efficiency as a future differentiator.
Electric Propulsion Systems Industry Leaders
General Electric Company
Safran SA
Airbus SE
Northrop Grumman Corporation
Rolls-Royce plc
- *Disclaimer: Major Players sorted in no particular order

Recent Industry Developments
- December 2025: Belrise Industries and Plasan Sasa entered into a strategic agreement to collaborate on the ATEMM all-terrain electric vehicle platform for India's military market.
- May 2025: Wärtsilä announced it will provide the electric propulsion system for the first battery-powered, zero-emission high-speed passenger ferries in the US.
- February 2025: ZeroAvia secured its first commercial agreement for a standalone electric propulsion system, with Jetcruzer International purchasing the company's 600kW system. The propulsion system will support Jetcruzer International's ongoing development of electric aircraft.


Research Methodology Framework and Report Scope
Market Definitions and Key Coverage
Our study defines the electric propulsion systems market as all integrated hardware and control electronics that use externally supplied or on-board electricity to accelerate a working fluid or convert motor torque into thrust across airborne, marine, space, and selected terrestrial platforms. According to Mordor Intelligence, components span thrusters, motors, power-processing units, batteries, and associated thermal or propellant management subsystems.
Scope exclusion: purely mechanical drive trains or chemical propulsion modules without an electric energy input are kept outside this assessment.
Segmentation Overview
- By Propulsion Type
- Hybrid
- Full-Electric
- By Platform
- Airborne (e-Aircraft and eVTOL)
- Terrestrial (Rail, Commercial EV, Mining)
- Marine (Commercial, Naval, Cruise)
- Space (Satellites, Deep-Space, In-Orbit Services)
- By End-User
- Government and Defense
- Commercial Operators
- OEM/System Integrators
- By Geography
- North America
- United States
- Canada
- Mexico
- Europe
- United Kingdom
- France
- Germany
- Italy
- Rest of Europe
- Asia-Pacific
- China
- India
- Japan
- South Korea
- Rest of Asia-Pacific
- South America
- Brazil
- Rest of South America
- Middle East and Africa
- Middle East
- Saudi Arabia
- United Arab Emirates
- Rest of Middle East
- Africa
- South Africa
- Rest of Africa
- Middle East
- North America
Detailed Research Methodology and Data Validation
Primary Research
Structured interviews were held with propulsion engineers at satellite bus integrators, naval architects overseeing IFEP retrofits, battery-cell suppliers, and aviation certification specialists across North America, Europe, and Asia-Pacific. These conversations validated price-performance assumptions, typical replacement cycles, and likely regulatory inflection points, giving us confidence to refine model drivers revealed during desk work.
Desk Research
Mordor analysts first mapped supply, demand, and installed base data from open datasets such as NASA's Space Science Data Coordinated Archive, EASA and FAA fleet registries, the International Maritime Organization's GISIS ship database, and UN Comtrade trade codes for HS 8412 and 8803, which track pumps, thrusters, and aircraft parts. Industry literature from the IEEE Aerospace & Electronic Systems Society, the International Astronautical Congress, and peer-reviewed journals on Hall-effect thrusters supplied recent efficiency benchmarks. Company 10-Ks, investor decks, and patent analytics extracted via Questel enriched cost curves and design-win counts. We supplemented these with D&B Hoovers financials to gauge revenue splits for key subsystem producers. The sources cited are illustrative; numerous additional public records informed dataset completion and cross-checks.
Market-Sizing & Forecasting
The baseline value pool was derived through a top-down reconstruction of historical deliveries and retrofits, using production outputs, vessel launch manifests, logged flight hours, and satellite mass-class launches; these were then priced with region-weighted average selling prices. Selective bottom-up roll-ups of thruster shipments and e-aircraft demonstrator orders acted as a reasonableness test before finalizing totals. Key variables like battery energy density progression, Hall-thruster specific impulse, IMO carbon-intensity rules, and commercial satellite launch cadence feed a multivariate regression that projects demand to 2030. Where supplier counts were partial, we bridged gaps with channel checks and disclosed backlog figures.
Data Validation & Update Cycle
Outputs move through variance screens versus historical trade values, peer unit economics, and prior report editions, followed by senior analyst review. Models refresh annually, while material events such as xenon price spikes or certification milestones trigger interim updates; a final pass is completed just before report release.
Why Mordor Intelligence's Electric Propulsion Systems Baseline Commands Reliability
Published numbers often diverge because firms mix broader propulsion categories, apply differing ASP progressions, or freeze exchange rates at arbitrary points. By isolating only electricity-enabled thrust systems, using live currency conversions, and revisiting variables with each update, Mordor delivers a balanced, decision-ready baseline.
Benchmark comparison
| Market Size | Anonymized source | Primary gap driver |
|---|---|---|
| USD 8.74 B (2025) | Mordor Intelligence | - |
| USD 8.25 B (2024) | Global Consultancy A | Includes hybrid chemical-electric units and applies static 2022 FX rates |
| USD 5.45 B (2024) | Regional Consultancy B | Excludes marine platforms and uses vendor list prices without volume discounts |
| USD 10.17 B (2024) | Trade Journal C | Aggregates electric motors for EVs, inflating totals beyond propulsion-specific scope |
These comparisons show that once scope creep and pricing biases are stripped out, Mordor's disciplined approach yields the most transparent, reproducible baseline for planners weighing electrification bets.


Key Questions Answered in the Report
What is the expected value of electric-propulsion shipments by 2031?
Global deliveries are projected to reach USD 17.01 billion by 2031.
How much fuel and maintenance savings can naval IFEP retrofits deliver?
IFEP can cut lifetime operating expenditure by more than 15% per hull.
Which region is forecasted to see the fastest demand growth?
Asia-Pacific is expected to log a 12.38 % CAGR through 2031 on the back of rail electrification and naval modernization.
What battery-energy density is considered the tipping point for regional all-electric aviation?
Pack densities of roughly 400 Wh/kg unlock viable sub-1,000 km routes for 20 to 50-seat aircraft.
Why are satellite operators exploring iodine instead of xenon propellant?
Iodine costs less and packs more densely, lowering thruster bill-of-materials by around 12% despite added materials challenges.
How do noble-gas price spikes affect electric-propulsion budgets?
Xenon and krypton volatility has raised satellite propulsion hardware costs by more than 12%, pushing buyers to diversify propellants.
Page last updated on:


