
Elastography Imaging Market Size and Share
Market Overview
| Study Period | 2020 - 2031 |
|---|---|
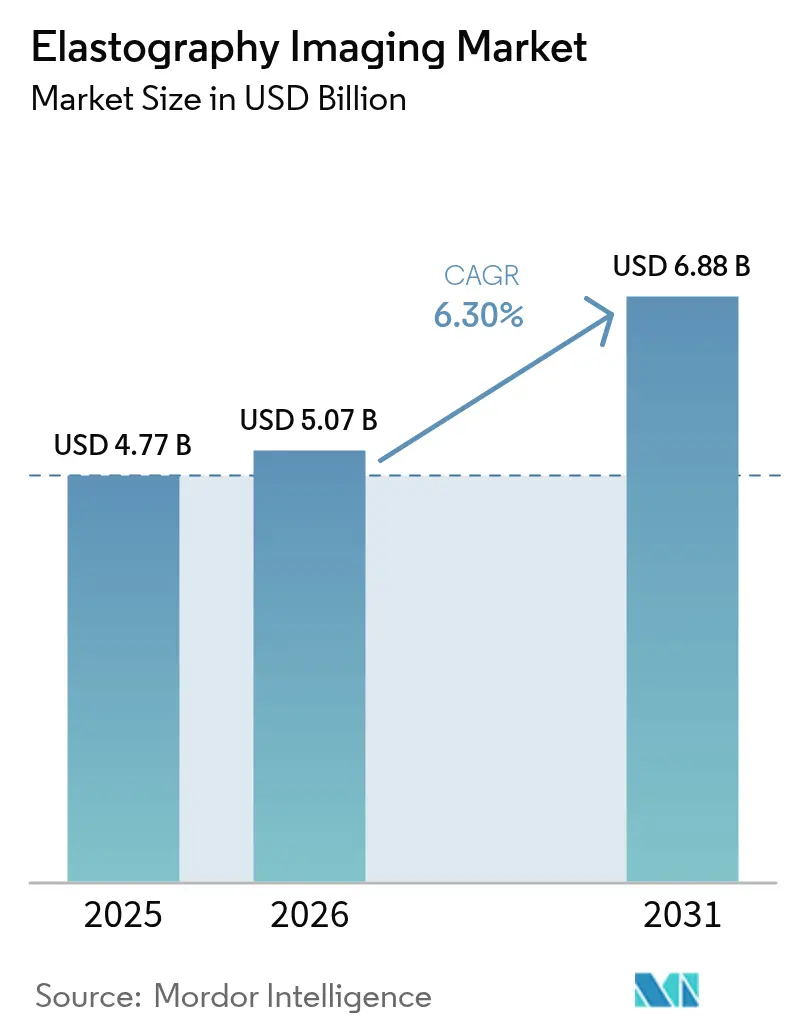
| Market Size (2026) | USD 5.07 Billion |
| Market Size (2031) | USD 6.88 Billion |
| Growth Rate (2026 - 2031) | 6.30 % |
| Fastest Growing Market | Asia Pacific |
| Largest Market | North America |
| Market Concentration | Medium |
Major Players *Disclaimer: Major Players sorted in no particular order Image © Mordor Intelligence. Reuse requires attribution under CC BY 4.0. | |
Elastography Imaging Market Analysis by Mordor Intelligence
elastography imaging market size in 2026 is estimated at USD 5.07 billion, growing from 2025 value of USD 4.77 billion with 2031 projections showing USD 6.88 billion, growing at 6.30% CAGR over 2026-2031. Growing clinical validation for non-alcoholic steatohepatitis (NASH) staging, rising cardiovascular and oncological use-cases, and strong demand for point-of-care ultrasound platforms are shaping growth trajectories. Artificial-intelligence-enabled automation shortens exam times by as much as 75%, easing the operator-dependency barrier in primary-care settings. Commercially viable handheld shear-wave probes priced below USD 4,000 are widening access in resource-limited facilities, especially across Asia-Pacific. M&A activity focused on clinical AI—such as GE HealthCare’s purchase of Intelligent Ultrasound—signals a pivot from hardware to software-led differentiation. Unfavorable reimbursement policies for elastography CPT codes and supply-chain shortages of high-frequency piezo crystals remain near-term restraints.
Key Report Takeaways
- By modality, ultrasound dominated with 62.30% revenue share in 2025; magnetic resonance led growth at a 7.19% CAGR through 2031.
- By technology type, shear-wave captured 45.10% of 2025 revenue; strain techniques recorded the fastest 7.55% CAGR to 2031.
- By imaging technique, 2-D retained 65.05% share in 2025, while 3-D/4-D is projected to expand at 7.02% CAGR.
- By portability, cart systems held 70.55% of 2025 revenue; handheld devices are advancing at an 7.79% CAGR.
- By application, radiology led with 38.10% share in 2025, but cardiology shows an 8.02% CAGR to 2031.
- By end-user, hospitals accounted for 68.10% revenue in 2025; ambulatory surgical centers are growing at 7.60% CAGR.
- By geography, North America commanded 40.75% share in 2025, whereas Asia-Pacific is the fastest region at an 8.12% CAGR.
Note: Market size and forecast figures in this report are generated using Mordor Intelligence’s proprietary estimation framework, updated with the latest available data and insights as of 2026.
Market Trends and Insights
Drivers Impact Analysis of Elastography Imaging Market*
| Driver | ( ~ ) % Impact on CAGR Forecast | Geographic Relevance | Impact Timeline |
|---|---|---|---|
| Rising incidence of chronic diseases & breast cancer | +1.8% | North America, Europe | Medium term (2-4 years) |
| Shift toward minimally invasive surgeries | +1.2% | Global developed markets | Long term (≥ 4 years) |
| Adoption of elastography for NASH fibrosis staging | +1.5% | North America, Europe, Asia-Pacific | Short term (≤ 2 years) |
| AI-enabled point-of-care ultrasound elastography | +1.1% | Global, early in North America | Medium term (2-4 years) |
| Robotic-Assisted Elastography-Guided Biopsy Platforms | +0.7% | North America & Europe | Long term (≥ 4 years) |
| Commercial Rollout Of Handheld Shear-Wave Probes | +0.9% | Global, with strong growth in Asia-Pacific | Short term (≤ 2 years) |
| Source: Mordor Intelligence | |||
Rising incidence of chronic diseases & breast cancer
Escalating metabolic-dysfunction-associated steatotic liver disease prevalence drives routine liver stiffness measurement adoption, where two-dimensional shear-wave elastography achieves 94% accuracy at a 14.4 kPa cutoff [1]Armandi, A. et al., “Liver Stiffness Cutoff of 14.4 kPa Detects Advanced Fibrosis with 94% Accuracy,” BMC Gastroenterology, bmcgastroenterology.biomedcentral.com. Combining ultrasound-guided attenuation parameters with shear-wave data stratifies MASLD patients by life-threatening event risk. Breast elastography now supports dense-breast screening, distinguishing malignant microcalcifications with 88% sensitivity and 86.7% specificity at a 62 kPa threshold. Growing oncology adoption bolsters equipment utilization in radiology suites. The dual-organ demand profile solidifies elastography as a preferred non-invasive alternative to biopsy.
Shift toward minimally invasive surgeries
Shear-wave elastography predicts rotator-cuff tendon quality before repair, enabling surgeons to tailor operative strategy more accurately. Robotic systems incorporate 3-D ARFI imaging to guide prostate procedures with agreement levels comparable to multiparametric MRI. AI-enhanced elastography automatically pinpoints biopsy targets, lowering sampling errors and procedure times. Strategic acquisitions, such as Hologic’s USD 350 million Sonata buy-out, highlight the commercial appeal of ultrasound-guided, fibroid-specific minimally invasive platforms. The technology’s intraoperative role is widening from liver to musculoskeletal and gynecological interventions.
Adoption of elastography for NASH-related fibrosis staging
FDA approval of Resmetirom accelerated vibration-controlled transient elastography uptake for therapy monitoring. Studies combining the ELF test with elastography deliver an AUROC of 0.829 for advanced fibrosis detection, outperforming biochemical markers. Two-dimensional shear-wave imaging attains 100% sensitivity for significant fibrosis at a 7 kPa threshold, providing cost-effective alternatives to MR elastography. Samsung’s S-Shearwave Imaging shows 0.94 diagnostic accuracy for advanced fibrosis in biopsy-controlled trials. The ability to measure liver stiffness and steatosis simultaneously underpins comprehensive NASH management pathways.
AI-enabled point-of-care ultrasound elastography
Siemens Healthineers’ Auto Point functionality cuts liver exam time by 75% without compromising accuracy. Philips Auto ElastQ reaches 99% measurement reproducibility and shortens study duration by 60%. AI-guided novice echocardiography improves correct view acquisition rates to 88% versus 76% with conventional techniques. GE HealthCare and NVIDIA collaborate on autonomous ultrasound, signaling a pipeline for fully automated elastography data acquisition. AI deepens standardization, expanding eligibility beyond specialized imaging centers.
Restraints Impact Analysis of Elastography Imaging Market*
| Restraint | (~) % Impact on CAGR Forecast | Geographic Relevance | Impact Timeline |
|---|---|---|---|
| Unfavorable Reimbursement Frameworks | -1.3% | North America & Europe | Short term (≤ 2 years) |
| High Capital Cost Of MRI-Based Systems | -0.8% | Global, particularly emerging markets | Medium term (2-4 years) |
| Operator-Dependence Limiting Reproducibility | -0.9% | Global, with higher impact in resource-limited settings | Long term (≥ 4 years) |
| Supply-Chain Shortage Of High-Frequency Piezo Crystals | -0.6% | Global, with manufacturing concentrated in Asia | Short term (≤ 2 years) |
| Source: Mordor Intelligence | |||
Unfavorable reimbursement frameworks
Medicare restricts CPT 76981/76982 coverage to advanced hepatic fibrosis in defined chronic liver diseases, limiting broader screening uses. Aetna deems elastography investigational outside liver applications, stalling cardiology and musculoskeletal reimbursement. Prior-authorization hurdles lengthen administrative cycles and discourage routine ordering. The absence of standardized payment for cardiac elastography delays guideline endorsements. Evidence-based coverage expansions are expected only after large-scale outcome studies demonstrate cost savings.
High capital cost of MRI-based systems
Full-body MR elastography platforms require USD 1.5–3 million outlays, burdening smaller centers [2]RSNA, “Economic Analysis of MR Elastography,” radiology.rsna.org . Yet two-dimensional shear-wave systems match diagnostic performance for significant fibrosis at a fraction of that cost. Operational complexity demands specialized technologists and dedicated scanner time slots. Limited availability extends patient wait times in hepatology clinics. Emerging handheld ultrasound devices under USD 4,000, like Butterfly iQ3, intensify cost pressure on premium MR options.
*Our forecasts treat driver/restraint impacts as directional, not additive. The impact forecasts reflect baseline growth, mix effects, and variable interactions.
Elastography Imaging Market Segment Analysis
By Modality:
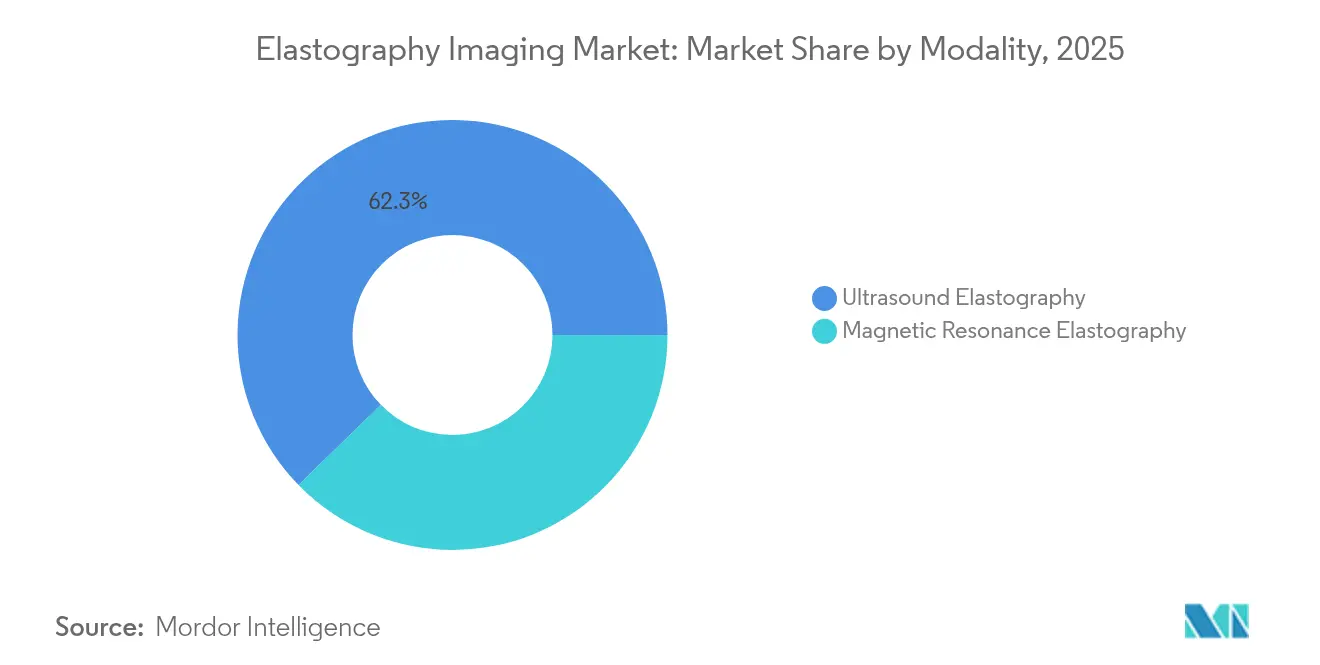
Ultrasound Dominance Drives Clinical IntegrationUltrasound elastography captured 62.30% revenue in 2025, reflecting superior workflow integration and lower cost relative to MR platforms. That share equates to USD 2.97 billion of the elastography imaging market size in 2025. MR elastography advances at a 7.19% CAGR, underpinned by gold-standard accuracy for fibrosis staging, but uptake is limited to tertiary centers due to high acquisition costs. Continuous R&D delivers conformable ultrasound electronics for non-planar monitoring, while AI automation enhances repeatability across operator skill levels.
MR elastography’s precision sustains demand in complex hepatology practices, yet capital barriers spur hybrid purchasing strategies where ultrasound handles routine follow-up and MR is reserved for equivocal cases. Equipment vendors integrate AI reconstruction to shorten MR scan times and reduce per-exam cost. The balancing act between clinical gold-standard status and economic realities shapes long-term modality mix.



By Technology Type:
Shear-Wave Precision Meets Strain AccessibilityShear-wave techniques represented 45.10% of 2025 sales, underlining their quantitative advantage and lower operator bias. Strain elastography’s 7.55% CAGR owes to software upgrades that convert existing scanners at minimal cost—a value proposition compelling in community hospitals. The elastography imaging market share leadership of shear-wave is reinforced by guideline endorsements for liver fibrosis and thyroid nodule assessment.
Transient elastography holds a niche in NASH monitoring, whereas ARFI benefits interventional radiology by providing real-time stiffness cues during needle placement. Hybrid solutions that fuse shear-wave with ARFI emerge to satisfy oncology procedural guidance. Diagnostic performance gains from machine-learning-based stiffness estimation continue to blur boundaries among technology types.
By Imaging Technique:
2-D Efficiency Versus 3-D InnovationTwo-dimensional elastography commanded 65.05% revenue in 2025, favored for high-throughput examinations. Three-dimensional and four-dimensional formats are projected at 7.02% CAGR as volumetric analysis proves valuable for complex lesions and cardiac mechanics. Portable devices such as Butterfly iQ3 introduce 3-D fan-sweep modes, accelerating democratization of advanced imaging.
Real-time 4-D elastography enhances myocardial strain assessment, aiding early heart-failure detection. Flexible polymer ultrasound arrays now enable 3-D elastography on curved anatomy like knees and neonatal heads, opening new research avenues. The interplay of computational cost and diagnostic yield drives site-specific adoption decisions.
By Portability:
Cart Systems Stability Amid Handheld DisruptionCart systems consolidated 70.55% revenue in 2025. Multi-transducer support and higher computing power keep them indispensable for multi-specialty hospitals. Yet handheld devices expand at 7.79% CAGR, propelled by emergency medicine, critical care, and rural outreach programs. Handheld unit shipments exceed 30% of total ultrasound volumes in several Southeast Asian markets.
Cloud-connected handhelds facilitate remote mentorship and AI post-processing, further eroding historical performance gaps versus cart consoles. Enterprise imaging networks are integrating handheld data to maintain consistent reporting formats, easing credentialing concerns. As price points fall, secondary and primary care sites become first-time elastography purchasers.
By Application:
Radiology Leadership Amid Cardiology AccelerationRadiology retained 38.10% share in 2025, equal to USD 1.82 billion of the elastography imaging market. Cardiology, at an 8.02% CAGR, accelerates on the back of AI-guided strain protocols that simplify novice scans. Heart-failure programs adopt left-ventricular stiffness metrics for risk stratification, supporting reimbursement petitions.
Urology applications capitalize on 3-D ARFI to localize prostate lesions while reducing biopsy core counts. Vascular elastography evaluates carotid plaque stability, augmenting Doppler findings to refine intervention decisions. Obstetrics & gynecology extend use into fibroid therapy guidance post Hologic-Gynesonics transaction, marking cross-disciplinary fertilization.

By End-User:
Hospital Dominance Amid Outpatient ExpansionHospitals generated 68.10% of 2025 spending, reflecting their need for comprehensive imaging suites and multidisciplinary usage. Ambulatory surgical centers grow at 7.60% CAGR as reimbursement incentivizes outpatient liver and thyroid biopsy services. Diagnostic imaging centers integrate ultrasound elastography into routine abdominal studies to differentiate simple steatosis from progressive fibrosis.
Specialty clinics such as hepatology and cardiology see rising elastography adoption to monitor chronic conditions within their own settings, reducing patient referrals and improving retention. Point-of-care programs in emergency departments address trauma and sepsis triage with quick stiffness evaluations that flag occult organ injury.
Geography Analysis
North America Elastography Imaging Market
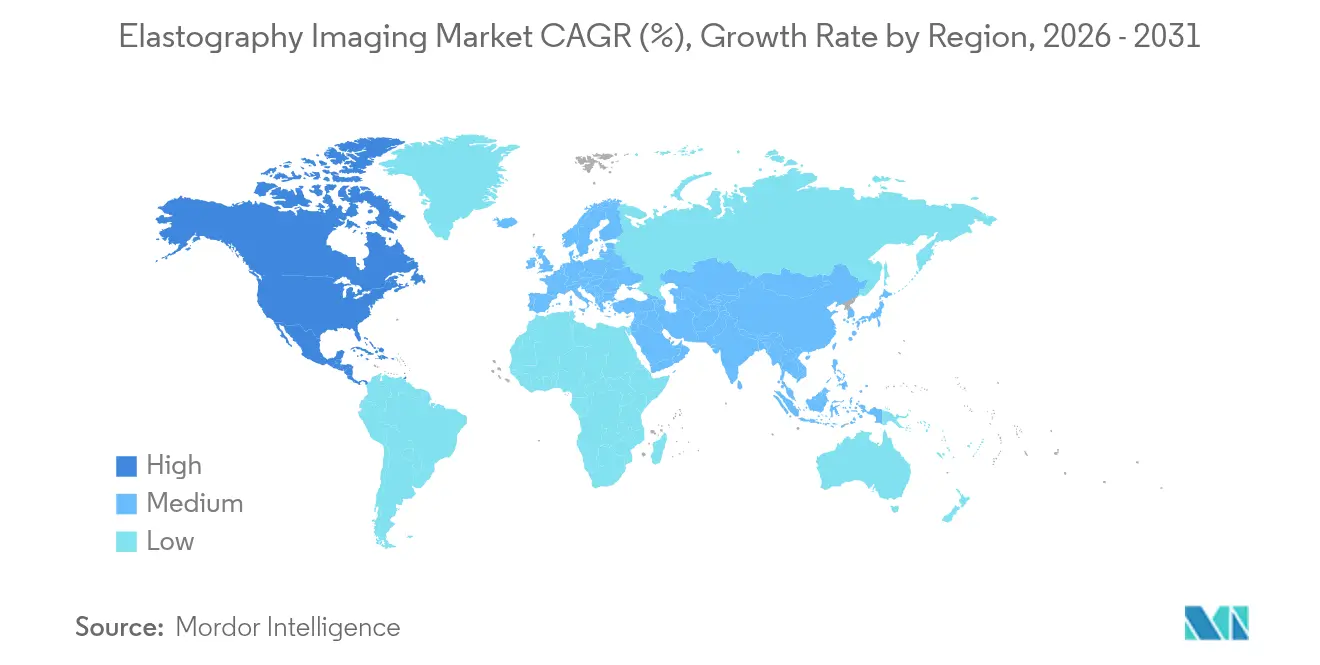
North America dominated revenue with a 40.75% share in 2025. Favorable reimbursement for liver elastography and rapid AI software clearance create a receptive regulatory environment. The United States initiated multi-center trials measuring elastography endpoints in NASH drug development, anchoring demand among hepatologists.
Europe Elastography Imaging Market
Europe maintains stable adoption as national health systems emphasize cost-effectiveness; portable devices offer lower total cost of ownership for district hospitals. The region’s imaging societies publish harmonized protocols, improving cross-country comparability and vendor neutrality.
APAC Elastography Imaging Market
Asia-Pacific delivers an 8.12% CAGR, fueled by expanding healthcare spending, large diabetic populations, and domestic manufacturing of affordable ultrasound chips. China’s NMPA issued updated Class III imaging guidelines in 2024, expediting domestic product registrations and spurring local competition. India’s point-of-care programs incorporate handheld elastography to screen fatty-liver disease in primary care.
MEA and South America Elastography Imaging Market
The Middle East and Africa witness incremental adoption through private hospital groups investing in premium diagnostic services. South America shows steady growth as public health campaigns emphasize non-invasive cirrhosis detection, particularly in Brazil and Argentina.

Regulatory Landscape
Elastography imaging systems and related software are regulated primarily as medical devices. In the United States, ultrasound-based elastography functions and upgrades are commonly pursued through the FDA 510(k) pathway. Recent clearances show ongoing predicate-based commercialization for elastography capabilities, including Sonic Incytes Velacur (510(k) K233977, September 2024) and Quality Electrodynamics SureWave Elastography (510(k) K242006, February 2025), supporting routes for both hardware and software-enabled stiffness quantification.
In Europe, manufacturers operate under the Medical Device Regulation (MDR), where alignment to harmonized standards supports presumption of conformity for safety and performance of electrically powered systems. In June 2026, the Official Journal of the European Union updated the MDR harmonized standards list, including EN 60601-1:2006/A13:2024, which increases the emphasis on maintaining current test evidence and technical documentation. Discussions aimed at reducing MDR/IVDR burden (including a 2025 proposal referenced by EU bodies) also factor into compliance planning for vendors with broad ultrasound portfolios.
Value Chain Analysis
The elastography imaging value chain covers (i) component inputs (ultrasound transducers and materials, beamforming and signal-processing electronics, and compute hardware for on-device or cloud inference), (ii) system integration (cart and handheld ultrasound platforms and, separately, MR elastography ecosystems), (iii) software development and validation (stiffness quantification, automation, and workflow tools), and (iv) downstream distribution through direct hospital sales, channel partners, and procurement pathways such as GPO-linked contracting in the United States. Market dynamics in this report are shaped by the installed base of ultrasound systems, which accounts for 62.30% of 2025 revenue for the ultrasound modality, and can be expanded through software and compatible probe offerings. This supports faster commercialization cycles than capital-intensive MR deployments.
Key friction points remain upstream and compliance-related. Supply-chain shortages of high-frequency piezo crystals constrain probe availability, while AI-assisted stiffness mapping increases documentation, validation, and post-market monitoring requirements under regimes such as EU MDR. Manufacturers also manage concentration risks in specialized modules, for example ARFI-related capabilities, and in validated algorithms that must be maintained across software revisions without disrupting performance claims. As a result, quality systems, verification testing, and long-term service agreements remain central to the value chain.
Competitive Landscape
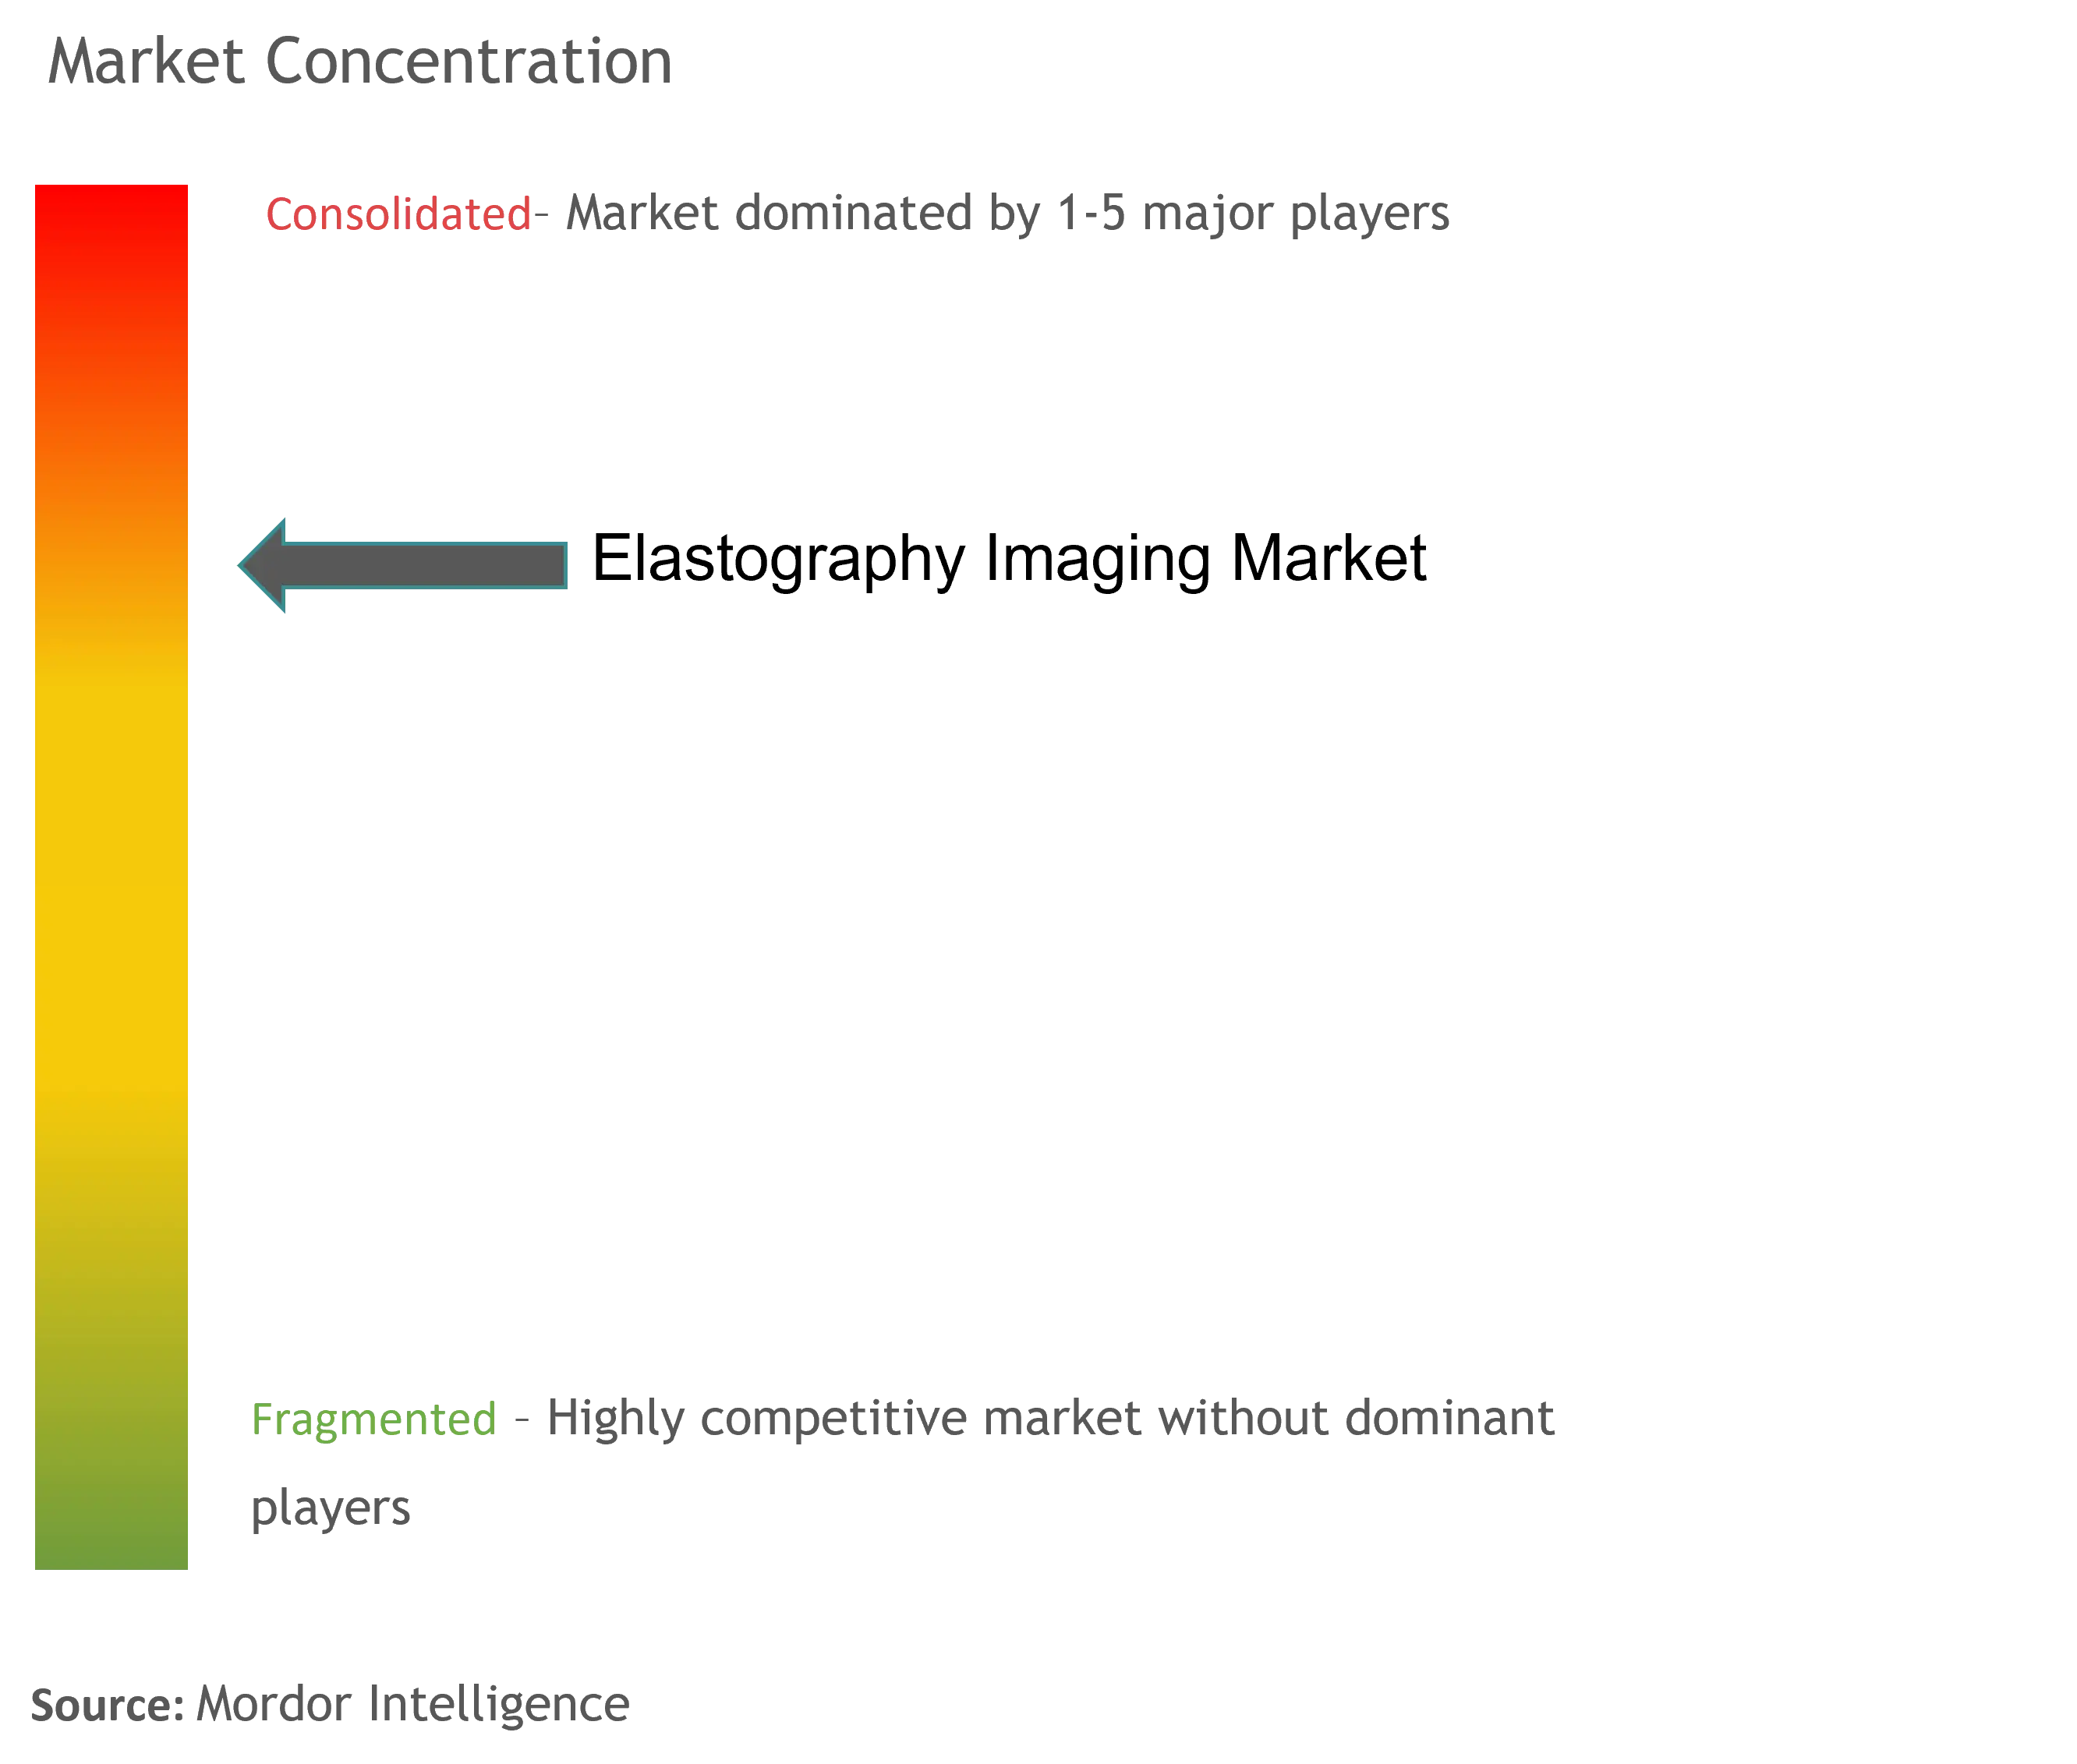
Market concentration is moderate as diversified imaging multinationals compete with specialty vendors. GE HealthCare integrated Intelligent Ultrasound’s ScanNav AI into Voluson SWIFT systems to alleviate sonographer workflow burden. Philips Elevate software, launched at ECR 2025, reduces liver study times by 60% through automated presets [3]Philips, “ECR 2025 Innovations,” philips.com.
Butterfly Network generated USD 65.9 million in 2023 revenue and targets USD 500 million by 2030, underscoring investor confidence in semiconductor-based handheld ultrasound. Samsung Medison’s acquisition of Sonio affirms a build-and-buy approach to AI augmentation. Vendors differentiate via automated quality control, cloud connectivity, and transducer ergonomics.
Supply-chain risk management becomes strategic as piezo crystal shortages spur exploration of CMUT and PMUT alternatives. Open-architecture software ecosystems emerge, enabling third-party AI modules that extend system life cycles. Competitive success hinges on balancing imaging performance, workflow simplification, and price positioning for diverse care settings.
Elastography Imaging Industry Leaders
Canon Medical Systems Corporation
GE Healthcare
Koninklijke Philips N.V.
Fujifilm Holdings Corporation
Mindray Medical International Limited
- *Disclaimer: Major Players sorted in no particular order
Elastography Imaging Market Companies Covered in this Report
- Canon
- Esaote
- FUJIFILM
- GE Healthcare
- Supersonic Imagine
- Hologic
- Koninklijke Philips
- Mindray
- Resoundant Inc.
- Samsung Medison Co. Ltd.
- Siemens Healthineers
- Hitachi
- Butterfly Network Inc.
- Clarius Mobile Health Corp.
- Echosens SA
- BK Medical ApS
- Terason Corporation
- Verasonics Inc.
- Shenzhen Wisonic Medical Tech.
- Alpinion Medical Systems
- Ultrasonix Medical Corp.

Market Opportunities and Future Outlook
A key whitespace is multiparametric liver assessment on portable and point-of-care platforms that combine stiffness with steatosis-related metrics in a single workflow. This approach improves clinical usefulness for MASLD/MASH pathways and follow-up monitoring. Recent FDA clearances support packaging in this direction, including Sonic Incytes Velacur ONE (August 2025) with AI-guided acquisition and added measurements such as attenuation and VDFF (Velacur Determined Fat Fraction), and E-Scopics Hepatoscope with expanded capabilities cleared in May 2026. These clearances create concrete commercial stepping stones for vendors to bundle elastography into broader liver disease management features, rather than positioning stiffness measurement strictly as a stand-alone add-on.
Standardization and automation also create near-term differentiation as purchasers prioritize reproducibility and reduced operator dependence. Alignment to recognized standards such as IEC 63412-1, referenced alongside newer device clearances, supports common performance language across sites and can simplify multi-site rollouts for hospital networks. Payer constraints remain a gating factor for non-liver indications, including policies that treat non-liver uses as investigational, which creates opportunity for vendors and clinical groups to focus evidence generation and workflow integration on reimbursed liver use-cases. That evidence base can then support expansion into cardiology and other applications.
Recent Industry Developments in Elastography Imaging Market
- July 2026: Philips introduced the Alturion ultrasound system for high-volume clinical environments after receiving FDA 510(k) clearance and CE mark. The platform launch strengthens Philips presence in workflow-optimized ultrasound, where elastography and automation features can be packaged into standardized protocols across large provider networks.
- November 2025: Canon Medical Systems received FDA 510(k) clearance for Aplio i-series Software Version 9.0, adding Auto Tune Shear Wave to automate elasticity measurement settings. This software-led upgrade supports faster site adoption of consistent shear-wave measurements across installed Aplio fleets without requiring full system replacement.
- September 2024: Sonic Incytes received FDA 510(k) clearance (K233977) for Velacur, an AI/ML-enabled ultrasound system supporting elastography. The clearance expanded the set of regulated point-of-care options for liver assessment and underscored the growing role of AI-guided acquisition in reducing operator dependency.


Elastography Imaging Market Report Scope and Research Methodology
Market Definition and Coverage
The elastography imaging market is defined as the revenue generated from elastography-capable imaging solutions that measure tissue stiffness to support clinical diagnosis and monitoring, across ultrasound and MR based approaches, and sold into healthcare settings.
Scope exclusions: We exclude pure software-only analytics that do not enable elastography acquisition and also exclude general imaging systems sold without elastography functionality enabled.
Segments Covered in This Report
- By Modality
- Ultrasound Elastography
- Magnetic Resonance Elastography
- By Technology Type
- Strain Elastography
- Shear-Wave Elastography
- Transient Elastography
- Acoustic Radiation Force Impulse (ARFI)
- By Imaging Technique
- 2-D Imaging
- 3-D / 4-D Imaging
- By Portability
- Cart / Trolley-based Systems
- Portable / Handheld Systems
- By Application
- Radiology
- Cardiology
- Urology
- Vascular
- Obstetrics & Gynecology
- Orthopedic & Musculoskeletal
- Rheumatology
- Physical Medicine & Rehabilitation
- By End-User
- Hospitals
- Ambulatory Surgical Centers
- Diagnostic Imaging Centers
- Specialty Clinics
- By Geography
- North America
- United States
- Canada
- Mexico
- Europe
- Germany
- United Kingdom
- France
- Italy
- Spain
- Rest of Europe
- Asia-Pacific
- China
- Japan
- India
- Australia
- South Korea
- Rest of Asia-Pacific
- Middle East & Africa
- GCC
- South Africa
- Rest of Middle East & Africa
- South America
- Brazil
- Argentina
- Rest of South America
- North America
Data Sources, Market Sizing, and Validation
Desk Research
Desk research is used to set the starting facts and the guardrails of the model, so the market is not sized in a vacuum. We refer to public health statistics and clinical adoption signals to understand where elastography is used the most, and how quickly the patient pool is changing.
Typical sources include such as CDC disease burden tables, WHO and IARC cancer statistics, NIH and PubMed indexed clinical literature on elastography use, FDA device clearances and recalls, and OECD health spending indicators. We also review company filings, investor decks, product brochures, and pricing references reported in reputed press, followed by selected use of paid databases for company financials and intelligence and patent databases to confirm product launches and technology focus. These sources are not exhaustive, and many other public documents were checked for data collection, cross-checks, and clarification.
Primary Interviews and Surveys
Primary work is used to pressure test the desk assumptions and convert activity signals into a realistic demand picture. We speak with clinicians, radiology and ultrasound department leaders, procurement teams, and channel partners across major regions, and then we reconcile differences in utilization, replacement cycles, and average selling prices by modality.
Distribution of primary research fieldwork respondents
| Company type | Respondent position | Region |
|---|---|---|
| Top tier: 36% | CXOs: 12% | APAC: 41% |
| Mid tier: 48% | Functional/Unit leaders: 33% | EMEA: 34% |
| Smaller Players: 16% | Managers: 55% | Americas: 25% |
Market-Sizing & Forecasting
Sizing is built using a top-down approach where clinical demand pools and installed base signals are reconstructed by region and then translated into equipment and upgrade revenue, before being summed into the total market. To keep this grounded, the output is corroborated with selective bottom-up checks such as sampled ASP times unit volumes for elastography enabled systems, distributor channel feedback on shipments, and a limited roll up of supplier revenue where disclosures are clear.
Key inputs we track include liver disease and oncology diagnostic volumes, share of ultrasound systems that ship with elastography enabled, MR elastography adoption in tertiary hospitals, average selling price ranges by modality and portability, replacement and upgrade cycles, and reimbursement and guideline changes that influence procedure growth. When a local data series is missing, proxy indicators (for example, imaging equipment imports and hospital capex trends) are used, and then adjusted after expert feedback.
Forecasting is done through scenario analysis supported by light multivariate regression on procedure and equipment drivers, followed by analyst judgment so the curve stays realistic. Assumptions are updated by region because adoption speed and pricing progression differ noticeably between mature and developing healthcare systems.
Data Validation & Update Cycle
Validation is handled through multiple checks so the final numbers are not dependent on one input. We compare market totals against independent signals like imaging equipment shipment trends, public financial disclosures where available, and hospital procurement patterns discussed in interviews, and then outliers are revisited until the logic is consistent.
Before sign-off, the model goes through stepwise analyst review where drivers, math, and currency conversion timing are checked separately. Reports are refreshed annually, and interim updates are triggered when there are material events such as reimbursement changes, major regulatory actions, or visible shifts in modality adoption. Right before delivery, a final pass is completed so clients receive the most current view.
Mordor Intelligence's Elastography Imaging Market Size Compared With Other Published Estimates
Different publishers often show different elastography imaging market values because they do not always count the same things, and they also start from different base years. The gap usually comes from how ultrasound versus MR elastography is treated, whether upgrades and enabled software are counted as revenue, and how regional adoption is projected when public data is thin.
In this study, the spread mainly links back to scope and timing choices, such as using 2026 as the current sized year, keeping the market tied to elastography enabled imaging revenue, and validating utilization and ASP assumptions with hospital side feedback. This is why the 2026 total differs across sources, and it is the modeling choice used by Mordor Intelligence.
Benchmark comparison
| Source | Market Size | Gaps in Research Methodology |
|---|---|---|
| Mordor Intelligence | USD 5.07 B (2026) | |
| Industry Research Publisher A | USD 2.28 B (2024) | Uses a 2024 base year and a narrower monetization lens that can undercount elastography-enabled upgrades and higher-end system mix, which shifts the measured total downward versus later-year sizing. |
| Market Analytics Firm B | USD 3.84 B (2024) | Runs a longer forecast horizon and applies faster adoption assumptions across more end-user settings, which can inflate near-term value when procedure growth and pricing progression are not constrained by region-specific utilization checks. |
The table shows that the main differences are not just about growth rate, but about what is counted and when it is counted. When scope is kept consistent to elastography enabled imaging revenue and assumptions are tied back to procedure and purchasing signals, the result becomes easier to trace and repeat during updates.


Key Questions Answered in the Report
What is the current Global Elastography Imaging Market size?
The market is valued at USD 5.07 billion in 2026 and is forecast to reach USD 6.88 billion by 2031.
Who are the key players in Global Elastography Imaging Market?
Canon Medical Systems Corporation, GE Healthcare, Koninklijke Philips N.V., Fujifilm Holdings Corporation and Mindray Medical International Limited are the major companies operating in the Global Elastography Imaging Market.
Why is Asia-Pacific the fastest-growing region?
Healthcare investment, rising chronic-disease prevalence, and affordable handheld devices drive an 8.12% regional CAGR.
Which modality leads global revenue?
Ultrasound elastography accounts for 62.30% of 2025 revenue due to cost advantages and workflow integration.
Page last updated on:


 Your data is secure and never sold or shared.


