
Market Overview
| Study Period | 2020 - 2031 |
|---|---|
| Forecast Data Period | 2026 - 2031 |
| Base Year Market Size (2025) | USD 2.21 Billion |
| Market Size (2026) | USD 2.31 Billion |
| Market Size (2031) | USD 2.85 Billion |
| Growth Rate (2026 - 2031) | 4.32 % |
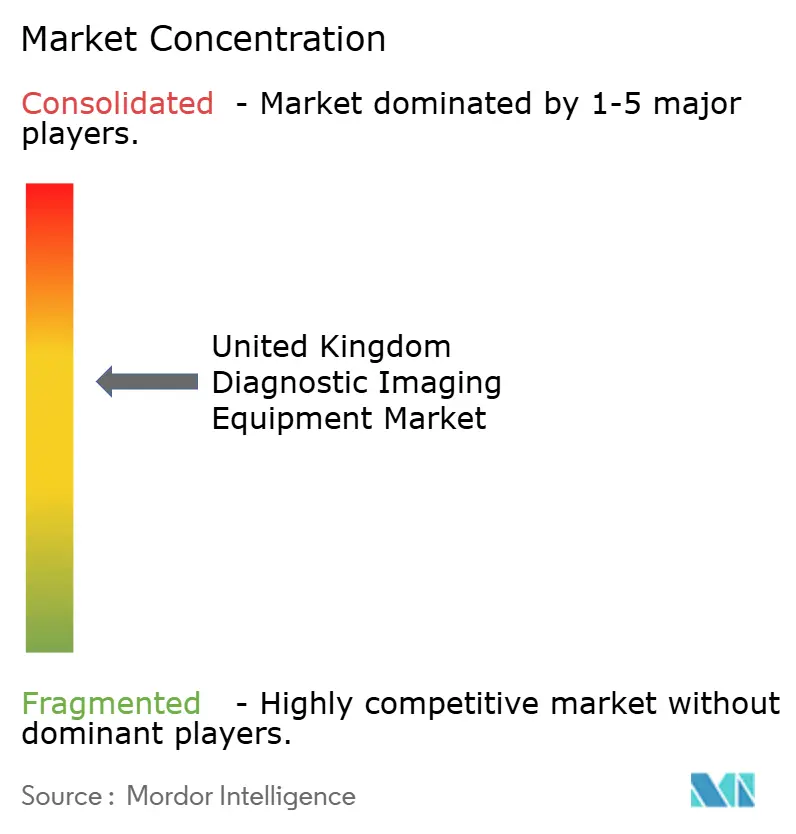
| Market Concentration | Medium |
Major Players *Disclaimer: Major Players sorted in no particular order Image © Mordor Intelligence. Reuse requires attribution under CC BY 4.0. | |
United Kingdom Diagnostic Imaging Equipment Market Analysis by Mordor Intelligence
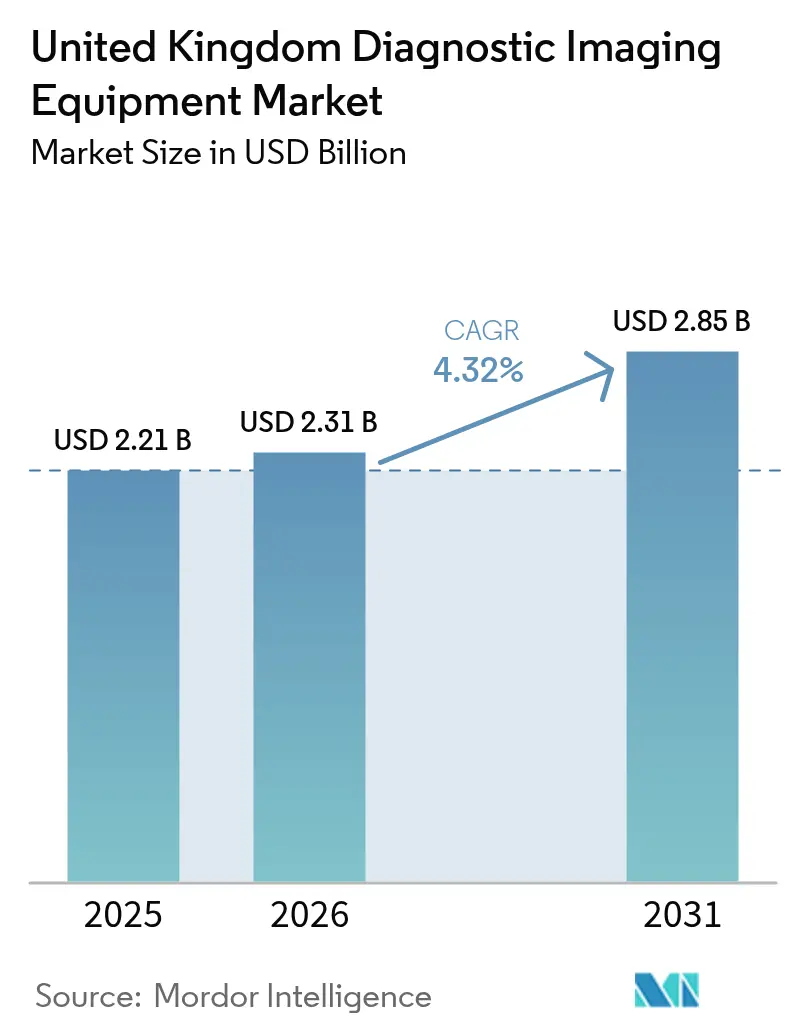
The United Kingdom Diagnostic Imaging Equipment Market size is expected to grow from USD 2.21 billion in 2025 to USD 2.31 billion in 2026 and is forecast to reach USD 2.85 billion by 2031 at 4.32% CAGR over 2026-2031. Stable growth rests on NHS capital injections, notably the USD 29 billion modernization fund that underwrites rapid scanner replacement and the roll-out of 160 Community Diagnostic Centres, each configured for high-throughput MRI, CT, and ultrasound workflows.[1]HM Treasury, “Chancellor Announces Record Investment to Rebuild NHS,” gov.uk An aging population, chronic disease prevalence, and guideline-driven screening programs combine to lift annual imaging volumes well above the 45 million procedures conducted in 2024, locking in structural demand. Brexit-related supply chain friction simultaneously spurs on-shore manufacturing such as Siemens Healthineers’ GBP 250 million Oxford MRI plant, curbing import risk and anchoring next-generation R&D. Technology adoption tilts toward AI-enabled scanners and managed-equipment-service (MES) contracts that accelerate refresh cycles while easing up-front capital strain. Workforce shortages, with 30% radiologist vacancies, amplify interest in workflow automation that maintains throughput without proportional staff additions.
Key Report Takeaways
- By modality, X-ray held 33.84% of United Kingdom diagnostic imaging equipment market share in 2025, whereas MRI is projected to expand at a 5.63% CAGR through 2031.
- By portability, fixed systems commanded 80.12% share of the United Kingdom diagnostic imaging equipment market size in 2025; mobile and hand-held solutions are set to rise at a 5.78% CAGR to 2031.
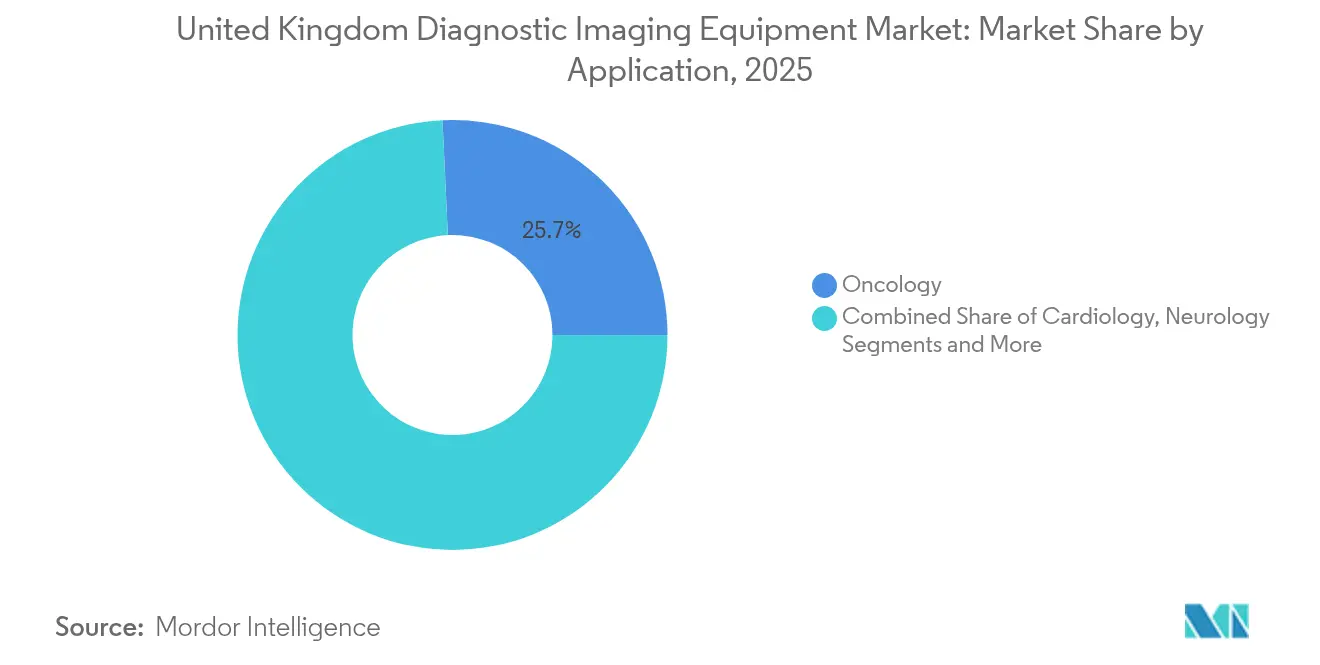
- By application, oncology led with 25.74% revenue share in 2025, while cardiology is pacing the market with a 5.49% CAGR to 2031.
- By end-user, hospitals dominated with 70.22% share in 2025, yet diagnostic imaging centres record the quickest ascent, growing at 5.37% CAGR over the forecast window.
Note: Market size and forecast figures in this report are generated using Mordor Intelligence’s proprietary estimation framework, updated with the latest available data and insights as of 2026.
United Kingdom Diagnostic Imaging Equipment Market Trends and Insights
Drivers Impact Analysis*
| Driver | (~) % Impact on CAGR Forecast | Geographic Relevance | Impact Timeline |
|---|---|---|---|
| Rising Prevalence of Chronic Diseases | +0.8% | National, concentrated in urban centers | Long term (≥ 4 years) |
| Growing Adoption of Advanced Imaging Technologies | +0.7% | National, early adoption in teaching hospitals | Medium term (2-4 years) |
| Government Capital Funding to Modernise NHS Imaging Fleet | +1.2% | National, prioritizing underserved regions | Short term (≤ 2 years) |
| Managed-Equipment-Service (MES) Model Shortening Replacement Cycles | +0.6% | National, concentrated in large NHS trusts | Medium term (2-4 years) |
| AI-Enabled Workflow Tools Boosting Utilisation Rates | +0.5% | National, pilot programs in major hospitals | Long term (≥ 4 years) |
| Hand-Held Ultrasound Uptake in Primary/Community Settings | +0.4% | National, rapid expansion in rural areas | Short term (≤ 2 years) |
| Source: Mordor Intelligence | |||
Rising Prevalence of Chronic Diseases
Escalating cardiovascular, oncologic, and metabolic disorders fuel multi-modality imaging demand, with chronic cases now accounting for the fastest-growing share of the 47 million NHS scans projected for 2025. Cancer screening expansions extend imaging intensity across diagnosis, staging, and surveillance stages, further tightening scanner utilization. Diabetes-related vascular assessments and musculoskeletal degeneration in an older workforce add to modality-agnostic volume growth. NICE guidelines increasingly favor imaging over invasive procedures, reinforcing reliance on CT angiography and MRI arthrography. The cumulative effect is a higher lifetime scan count per patient, anchoring durable revenue across modalities.
Growing Adoption of Advanced Imaging Technologies
Teaching hospitals spearhead procurement of AI-augmented CT, MRI, and X-ray systems that compress exam times and slash repeats, thereby freeing scarce staff capacity. NICE approved four AI fracture-detection tools in 2024, signposting regulatory acceptance and accelerating hospital tender requirements for embedded analytics.[2]NICE, “AI Technologies Recommended for Fracture Detection,” nice.org.uk Digital breast tomosynthesis outperforms 2-D mammography in cancer pick-up rates, prompting nationwide upgrade roadmaps. Low-helium 1.5 T MRI platforms, such as MAGNETOM Flow, cut running costs by up to 30%, satisfying both budgetary and sustainability mandates. Synthetic-CT algorithms reduce radiation dose while safeguarding image fidelity, helping providers meet IR(ME)R 2024 thresholds and regulations.
Government Capital Funding to Modernise NHS Imaging Fleet
The GBP 2.3 billion Community Diagnostic Centres (CDC) program finances more than 7 million incremental tests annually, effectively ring-fencing budget for MRI and CT procurement in peripheral regions. An additional GBP 70 million radiotherapy fund accelerates linear accelerator refresh cycles, indirectly driving demand for complementary planning CTs. Multi-vendor purchasing frameworks linked to the funding pools compress bid timelines and compel vendors to field turnkey service propositions. Because allocations fall inside the 2025-2026 fiscal envelope, manufacturers enjoy near-term volume certainty and can stage inventory accordingly.
Managed-Equipment-Service (MES) Model Shortening Replacement Cycles
MES deals convert capital spend into predictable operating fees, easing NHS balance-sheet pressure while guaranteeing technology refresh every seven to eight years instead of the conventional 11-year average. Providers report 11-239% lifecycle cost savings thanks to bundled maintenance, software upgrades, and uptime guarantees. Suppliers lock in revenue visibility for up to 25 years, underpinning service-centric business models that now account for roughly 28% of vendor bookings in the United Kingdom diagnostic imaging equipment market. The arrangement mitigates obsolescence risk for trusts and aligns vendor incentives with performance metrics such as scanner uptime and report turnaround.
Restraints Impact Analysis*
| Restraint | (~) % Impact on CAGR Forecast | Geographic Relevance | Impact Timeline |
|---|---|---|---|
| High Equipment & Procedure Costs | -0.9% | National, acute in smaller NHS trusts | Medium term (2-4 years) |
| Radiation-Dose Compliance and Image-Quality Regulations | -0.3% | National, uniform enforcement | Long term (≥ 4 years) |
| Brexit-Linked Installation & Spare-Parts Delays | -0.5% | National, concentrated in EU-dependent supply chains | Short term (≤ 2 years) |
| Shortage of Radiographers Limiting Scanner Throughput | -1.1% | National, severe in rural areas | Long term (≥ 4 years) |
| Source: Mordor Intelligence | |||
High Equipment & Procedure Costs
MRI suite build-outs exceed GBP 2 million once shielding and HVAC upgrades are counted, a figure that eclipses annual capital envelopes for many community hospitals.[3]National Audit Office, “NHS Supply Chain and Procurement Efficiencies,” nao.org.uk Service contracts add another 10% of purchase price each year, locking trusts into steep overheads for the full operational life. Reimbursement tariffs lag real costs for advanced modalities, disincentivizing early adoption despite clinical gains. Aging assets—57% of CT scanners are now older than five years—raise maintenance outlays and unplanned downtime, dampening throughput and revenue. Collectively, these cost pressures slow the pace at which smaller facilities can join modernization programs.
Radiographer Shortages Limiting Scanner Throughput
A 30% radiologist vacancy rate and 17.5% mammographer shortfall extend reporting queues to a median eight-day turnaround in some trusts. Extended shifts and overtime erode staff retention, perpetuating a cycle of attrition. Rural centres struggle most, facing recruitment lead-times of up to 18 months. While AI triage tools and centralized reporting hubs alleviate some bottlenecks, regulatory requirements still demand human oversight, capping productivity gains. Persistent staffing gaps temper utilisation, directly constraining scan volumes even where hardware capacity exists.
*Our forecasts treat driver/restraint impacts as directional, not additive. The impact forecasts reflect baseline growth, mix effects, and variable interactions.
Segment Analysis
By Modality: X-ray Stronghold Confronts MRI Momentum
X-ray retained 33.84% of United Kingdom diagnostic imaging equipment market share in 2025, owing to low ownership costs, ubiquitous clinical indications, and minimal facility prerequisites. The segment enjoys near-universal deployment across emergency rooms, outpatient clinics, and community diagnostic centres. Digital radiography upgrades replace aging CR suites, boosting detector sensitivity and cutting radiation by up to 40%. Mobile DR units enable bedside imaging, supporting infection-control protocols and reducing patient transport time. Nevertheless, flat growth expectations reflect saturation and reimbursement ceilings.
MRI exhibits the fastest 5.63% CAGR, extending the United Kingdom diagnostic imaging equipment market by expanding use cases such as prostate multiparametric scans, liver iron quantification, and fetal imaging. High-field 3 T and emerging 7 T platforms capture neurology and orthopaedics subspecialties that demand high-resolution soft-tissue contrast. The helium-light MAGNETOM Flow and GE HealthCare’s new ultra-premium 1.5 T gradient system limit operational expense, widening the addressable buyer base. Hybrid PET-MR holds niche appeal for oncology research centres but benefits from pooled academic-industry funding. CT, ultrasound, nuclear imaging, fluoroscopy, and mammography remain critical but record mid-single-digit growth, largely tied to replacement rather than net-new installs.




By Portability: Fixed Installations Anchor, Mobile Solutions Accelerate
Fixed rooms delivered 80.12% of the United Kingdom diagnostic imaging equipment market size in 2025, reflecting entrenched hospital demand for high-throughput CT, MRI, and interventional labs. Large teaching hospitals invest in multi-room suites with shared control areas and integrated RIS/PACS, achieving capacity utilisation above 85%. Shielded bunkers and gantry weight constraints keep these systems firmly site-bound. Warranty extensions and modular upgrades prolong asset life, yet fleet renewal cycles shorten under MES arrangements.
Conversely, mobile and hand-held platforms record a 5.78% CAGR, riding the decentralisation wave that places diagnostics closer to patients. Community Diagnostic Centres rely on trailer-based CT and MRI units that rotate through rural catchment areas, delivering 40-scan daily capacity without bricks-and-mortar spend. Butterfly Network’s GBP 1,699 handheld ultrasound compresses a traditional USD 50,000 cart into a smartphone-sized probe, unlocking point-of-care adoption across 21 trusts. Portable C-arms and mini-fluoroscopy systems support day-case surgical hubs, further dispersing imaging capacity. Growth hinges on clinician training and reimbursement alignment, both advancing via NHS digital accreditation pathways.
By Application: Oncology Dominates, Cardiology Outpaces
Oncology contributed 25.74% of 2025 revenue, a consequence of multi-step cancer care pathways requiring serial imaging from screening through survivorship. PET-CT and dual-energy CT quantify tumor metabolism and vascularity, while MRI underpins radiotherapy planning. Government ring-fenced radiotherapy capital ensures planned roll-outs of 70 new linear accelerators, each coupled with planning CTs that feed the oncology imaging ecosystem. AI contouring software trims planning time, yet still depends on high-quality backbone imaging.
Cardiology wins the growth race at 5.49% CAGR, driven by NICE endorsement of CT coronary angiography as the first-line test for chest pain assessment. Dual-source CT scanners capable of sub-50 ms temporal resolution open non-invasive doors to fractional flow reserve calculations, displacing invasive catheterisation. MRI’s late gadolinium enhancement detects micro-infarcts that guide therapy escalation, while ultrasound strain imaging tracks heart-failure progression. Neurology, orthopaedics, gastroenterology, gynecology, and emergency medicine maintain steady demand anchored in guideline revisions and demographic trends, collectively supplying incremental lifts but not eclipsing oncology or cardiology in share or pace.
By End-User: Hospitals Dominate, Diagnostic Centres Surge
Hospitals accounted for 70.22% of 2025 equipment placements, reflecting comprehensive modality needs and round-the-clock service mandates. Foundation trusts manage fleet complexity via MES or vendor-neutral asset management, ensuring uptime benchmarks of ≥ 99%. Teaching hospitals push frontier research, securing grants that subsidise high-field MRI and hybrid imaging prototypes. Private hospital chains add premium installations in high-income corridors of London and the South-East, further reinforcing hospital share.
Diagnostic imaging centres, however, advance at a 5.37% CAGR, fueled by the CDC rollout that positions standalone hubs for volume-centric MR and CT workflows. Centres optimise layout for patient flow, deploy AI triage to prioritise scans, and leverage extended hours to clear elective backlogs. Private imaging franchises co-locate inside retail parks, marketing rapid self-pay scans to health-conscious consumers. Mobile services, academic institutions, and specialised clinics round out the end-user mix, absorbing niche technologies like PET-MR or high-frequency ultrasound for research or tertiary indications.
Geography Analysis
England absorbs a significant portion of the United Kingdom's diagnostic imaging equipment market, buoyed by dense populations and large teaching hospitals in London, Manchester, Birmingham, and Leeds. The Midlands and North-East benefit from targeted CDC grants aimed at correcting historic access deficits, triggering spike procurements of trailer-based CT and ultrasound. Scotland’s centralised procurement funnels bulk orders through NHS National Services Scotland, achieving volume discounts of up to 12% and standardised scanner fleets that simplify training and maintenance.
Wales leverages the Imaging Academy in Cardiff to harmonise protocol standards and fast-track AI pilot evaluations, a move expected to lift utilisation in rural health boards starved of specialist radiologists. Northern Ireland’s dual UKCA/CE device regulation imposes additional paperwork that elongates lead times by several weeks, nudging trusts to source from vendors with local inventory buffers. Across all devolved nations, rural geographies depend on mobile MRI and CT caravans, supported by digital PACS backhauls to metropolitan reporting hubs.
Uniform enforcement of IR(ME)R 2024 ensures dose governance nationwide, compelling providers to invest in dose-tracking software irrespective of locale-regulations). Regional asset audits drive replacement prioritisation lists, aligning capital flows with equipment age profiles rather than political borders. Consequently, the diffusion of advanced modalities follows strategic investment logic-population need and fleet obsolescence-over simple geographic demarcation.
Regulatory Landscape
Diagnostic imaging equipment placed on the Great Britain market is regulated by the Medicines and Healthcare products Regulatory Agency (MHRA) under the UK Medical Devices Regulations 2002 (UK MDR 2002), as amended. Market access uses a dual-track conformity approach (UKCA and CE) under transitional arrangements, with published timelines allowing acceptance of CE-marked general medical devices compliant with EU MDD/AIMDD until the earlier of certificate expiry or 30 June 2028, and CE-marked devices compliant with EU MDR (and IVDs under IVDR) until 30 June 2030. Manufacturers must also complete MHRA device registration, and non-UK manufacturers need a UK Responsible Person, shaping how OEMs structure UK distribution and service footprints.
The framework is moving toward a future regime with stronger lifecycle controls, including enhanced post-market oversight introduced through the Post-Market Surveillance Statutory Instrument (2024). Alongside this shift, government consultation activity has focused on reducing friction for device availability in Great Britain, including proposals around continued CE recognition and a transition toward Unique Device Identification (UDI)-led traceability that, once implemented, supports the plan to remove physical UKCA marking requirements. For imaging OEMs and AI-enabled workflow suppliers selling into NHS and independent providers, the practical focus is on compliance readiness across conformity, registration, and post-market reporting, while procurement increasingly specifies digital interoperability and safety governance aligned to updated UK requirements.
Competitive Landscape
Market structure skews toward a handful of diversified conglomerates: Siemens Healthineers, GE Healthcare, and Philips, capitalising on portfolio breadth, in-country service bases, and long-running NHS relationships. Each ties hardware bids to MES, cyber-secure PACS, and AI app stores, bundling lifecycle services that blunt pure-price competition. Canon Medical, Fujifilm, and Samsung Medison contest share with targeted differentiation—radiation-free modalities, open MRI comfort designs, or AI-guided obstetric ultrasound—allowing them to win selected tenders despite smaller service workforces.
Handheld disruptors such as Butterfly Network and Mindray exploit low price points and smartphone integration to penetrate primary care segments previously uneconomic for legacy vendors. AI start-ups pivot to software-as-a-service, partnering with hardware majors for distribution yet retaining algorithm IP that commands subscription annuities. Regulatory compliance clout becomes a strategic moat; vendors invest in real-time dose recording and cloud native cybersecurity to satisfy stringent NHS Digital standards.
Strategic moves abound: Manchester University NHS Foundation Trust signed a 15-year technology partnership with Siemens Healthineers covering scanners, MES, and staff training; GE Healthcare paired with NVIDIA to embed generative AI in automated X-ray positioning; Philips expanded its UK refurbishment centre, signalling a circular-economy play that offers lower-cost, warrantied systems to cash-strapped trusts. The competitive lens thus shifts from pure hardware horsepower to ecosystem value—service depth, AI pipelines, and sustainability credentials.
United Kingdom Diagnostic Imaging Equipment Industry Leaders
Koninklijke Philips N.V.
Siemens Healthineers AG
GE HealthCare
Canon Medical Systems Corporation
Fujifilm Holdings Corp.
- *Disclaimer: Major Players sorted in no particular order

Market Opportunities and Future Outlook
Capacity expansion anchored in the Community Diagnostic Centres (CDC) model keeps procurement demand distributed beyond acute hospitals, creating room for modular, mobile, and rapid-deploy imaging rooms that can be standardized across networks. NHS England announced a GBP 237 million package in April 2026 to open 4 new CDCs and expand or enhance 32 existing sites across England, reinforcing a pipeline for MRI, CT, ultrasound, and X-ray upgrades tied to decentralized delivery. With NHS diagnostic activity reaching a record 29 million tests and scans in 2025, suppliers that can combine equipment, installation, and uptime-centric service models (including managed-equipment-service structures already used by large trusts) have a clear route to win multi-site refresh programs.
Regulatory and adoption infrastructure is also opening space for AI-enabled imaging solutions that reduce staff burden and standardize quality across sites. MHRA reported a 17% increase in approved clinical investigations in 2025 versus 2024, and in January 2026 launched a fee waiver pilot for micro and small UK firms, lowering early-stage barriers for domestically developed imaging and AI tools that can integrate into NHS workflows. In parallel, MHRA published a statement of policy intent for early access to innovative medical devices in July 2025, giving vendors another mechanism to align evidence generation with NHS purchasing thresholds. Taken together, CDC rollouts, record diagnostic volumes, and active MHRA policy levers point to concrete near-term opportunities for OEMs and software providers that deliver interoperable, workflow-focused imaging systems for community-based pathways.
Recent Industry Developments
- June 2026: Siemens Healthineers developed the first hybrid-powered mobile CT unit in the United Kingdom to support lung screening programs. The development strengthens mobile CT infrastructure for decentralized screening and adds a sustainability angle for fleets that operate across multiple sites and extended hours.
- May 2025: Medecon Healthcare partnered with United Imaging Healthcare to deliver and maintain X-ray systems across NHS and private healthcare facilities in the United Kingdom. The partnership adds a service-led route to market for X-ray deployments and supports buyers seeking to reduce downtime and lifecycle maintenance risk.
- April 2024: Intelligent Ultrasound integrated ScanNav AI into GE Healthcare SonoLystlive machines to automate capture during mid-trimester obstetric scans. This integration expands embedded AI use at the point of care and supports standardization of scan acquisition in settings facing sonographer capacity constraints.


Research Methodology Framework and Report Scope
Market Definition and Coverage
This market is defined as the revenue generated in the United Kingdom from the sale and deployment of diagnostic imaging equipment used to produce clinical images for screening, diagnosis, and monitoring across care settings.
Scope exclusions: We exclude imaging services, radiology IT-only software, general hospital infrastructure, and routine consumables and parts unless they are packaged with an equipment sale.
Segmentation Overview
- By Modality
- MRI
- High-field (>1.5 T)
- Low-field (≤1.5 T)
- Computed Tomography
- High-slice (>64)
- Mid-slice (16-64)
- Low-slice (<16)
- Cone-Beam CT
- Ultrasound
- Diagnostic (2D)
- Diagnostic (3D/4D)
- Hand-held/Portable
- X-Ray
- Digital Radiography
- Analog Radiography
- Mobile DR
- Nuclear Imaging
- PET
- SPECT
- Hybrid (PET-CT / PET-MR)
- Fluoroscopy
- Fixed C-arm
- Mobile C-arm
- Mammography
- Digital 2D
- 3D Tomosynthesis
- MRI
- By Portability
- Fixed Systems
- Mobile and Hand-held Systems
- By Application
- Cardiology
- Oncology
- Neurology
- Orthopedics
- Gastroenterology
- Gynecology
- Other Applications
- By End-User
- Hospitals
- Diagnostic Imaging Centres
- Other End-users
Data Sources, Market Sizing, and Validation
Desk Research
Desk research was used to map the installed base, replacement cycles, and demand signals that typically move imaging equipment budgets in the UK. We referenced public healthcare planning and activity indicators, such as NHS England publications, UK government statistics (including ONS), and health technology guidance and evidence notes from bodies such as NICE.
To cross-check supply-side signals, we also reviewed trade and product classification data from sources such as HMRC and UN Comtrade, and scanned peer-reviewed clinical and radiography journals for modality utilization and workforce constraints. Annual reports, investor presentations, and reputable UK health press were used to understand product positioning and channel mix. Where needed, paid subscriptions for company financials and intelligence, patent databases, and shipment-level import-export databases were used to fill gaps and sanity-check directional trends. These desk sources are not exhaustive, and many other public references were also used for data collection, validation, and clarification.
Primary Interviews and Surveys
Primary work focused on validating what is actually being purchased and replaced across hospitals, diagnostic centers, and procurement-linked stakeholders, and then stress-testing the desk assumptions that drive volumes and pricing. Interviews were also used to confirm modality-level demand shifts linked to Community Diagnostic Centres, waiting list priorities, and practical constraints such as staffing and room readiness.
Distribution of primary research fieldwork respondents
| Company type | Respondent position |
|---|---|
| Top tier: 30% | CXOs: 18% |
| Mid tier: 48% | Functional/Unit leaders: 33% |
| Smaller Players: 22% | Managers: 49% |
Market-Sizing & Forecasting
Sizing started from a top-down build that reconstructs annual equipment demand using UK imaging activity levels, replacement timing from typical asset lives, and observed procurement intensity by care setting, which are then converted to value through modality-weighted average selling prices. Once the demand pool was built, selective bottom-up checks were added through sampled supplier and channel roll-ups, along with ASP times volume spot checks, to confirm that the totals stay realistic.
A few inputs were treated as key drivers because they can be tracked and explained on a call, including the expected pace of Community Diagnostic Centre rollout, waiting list management priorities, utilization rates by major modality, the share of mobile versus fixed installations, and replacement versus new placement mix. Pricing was handled using an ASP progression logic that reflects inflationary pressure, technology refresh, and mix shifts, and gaps in public data were handled by using ranges agreed during expert calls and then tightened after cross-checking against procurement and trade signals. Forecasting relied mainly on scenario analysis, with the base case tuned to how experts expect budgets, throughput targets, and replacement backlogs to move over the forecast period.
Data Validation & Update Cycle
Outputs were triangulated against independent signals, including procurement announcements, trade flows, and reported imaging activity, and then reviewed for any sharp year-to-year jumps that do not match known policy or budget timing. If variances were found, assumptions were reworked and respondents were re-contacted to confirm whether the shift was real or model-driven.
Before sign-off, the model goes through multi-step analyst review so calculation logic, units, and pricing assumptions stay consistent across modalities and years. The report is refreshed annually, and interim updates are made when material events occur that can move procurement or pricing. Right before delivery, a final pass is completed to incorporate the latest publicly available updates.
Mordor Intelligence's UK Diagnostic Imaging Equipment Market Market Sizing Compared With Other Published Estimates
Published market sizes often differ even when they use similar market names, because the scope lines are drawn differently and the timing of currency, inflation, and replacement cycles is treated in different ways. In this topic, the biggest swings usually come from whether the estimate counts only equipment sales, or whether it also adds services, software, and broader medical device categories.
The main gap comes from including imaging services and adjacent medical imaging spend, where Mordor Intelligence counts only diagnostic imaging equipment revenue in the United Kingdom and then applies modality-level replacement and ASP progression assumptions that are checked through procurement and trade signals.
Benchmark comparison
| Source | Market Size | Gaps in Research Methodology |
|---|---|---|
| Mordor Intelligence | USD 2.31 B (2026) | |
| Global Consultancy A | USD 1.38 B (2026) | This figure appears to be derived from a broader global medical imaging model that allocates country shares, which can understate UK totals if local replacement backlog, CDC-driven demand, and modality mix are not explicitly rebuilt from UK activity and procurement signals. |
| Industry Publisher B | USD 2.80 B (2026) | The higher value is consistent with a more aggressive base case on adoption and spend progression, and it may also reflect wider inclusion of related platforms and procurement bundles, which can push ASP assumptions upward when not separated into pure equipment versus add-ons. |
Overall, the spread is explained by what gets counted and how the UK demand pool is reconstructed. Using a clear equipment-only scope, observable UK-side indicators, and repeatable pricing and replacement logic keeps the estimate traceable and easier to reconcile with real procurement behavior.


Key Questions Answered in the Report
What is the 2026 value of the United Kingdom diagnostic imaging equipment market?
The market stands at USD 2.31 billion in 2026 and is projected to reach USD 2.85 billion by 2031.
Which modality is growing the fastest in the UK?
MRI registers the highest 5.63% CAGR, underpinned by helium-saving designs and broader clinical indications.
How are Community Diagnostic Centres influencing equipment demand?
CDCs centralize procurement for high-throughput CT and MRI, accelerating replacement cycles and raising demand in underserved regions.
What are the chief barriers to scanner utilisation?
High ownership costs and a 30% radiologist shortfall slow throughput despite adequate hardware capacity.
Which companies dominate UK imaging equipment supply?
Siemens Healthineers, GE Healthcare, and Philips together dominate new installations, leveraging managed-service contracts.
How is AI addressing workforce shortages?
AI tools approved by NICE triage images and automate measurements, cutting reporting workloads by up to 50% while maintaining accuracy.
Page last updated on:





