
Market Overview
| Study Period | 2021 - 2031 |
|---|---|
| Forecast Data Period | 2026 - 2031 |
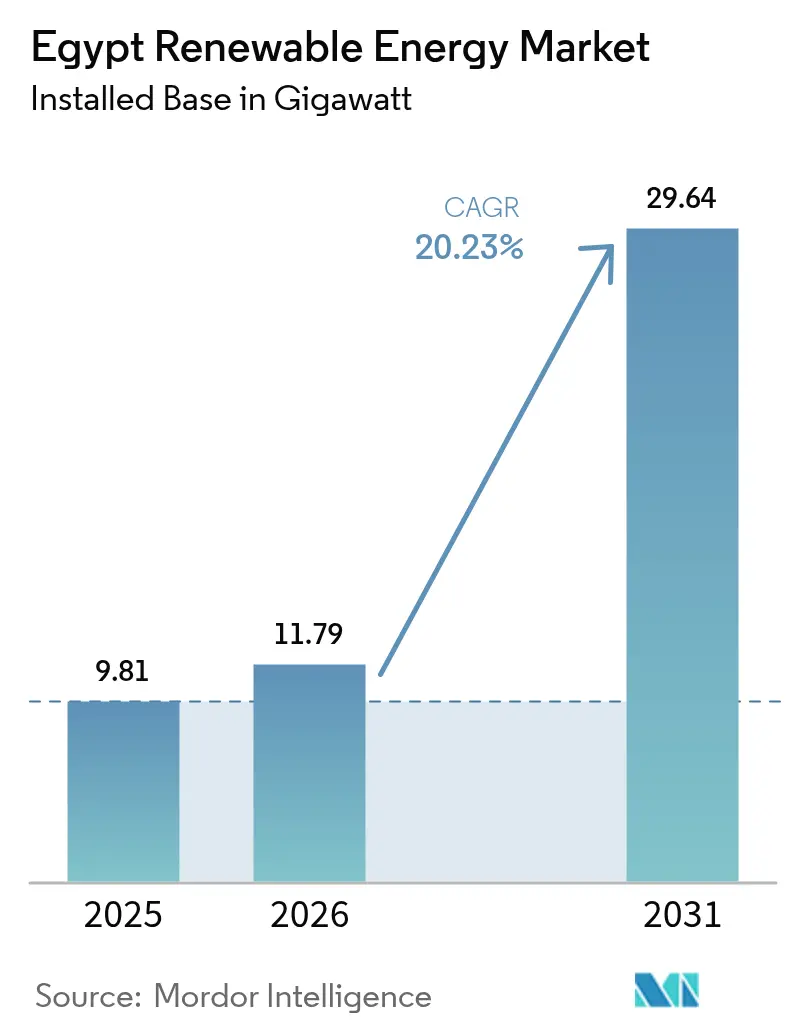
| Base Year Market Size (2025) | 9.81 gigawatt |
| Market Volume (2026) | 11.79 gigawatt |
| Market Volume (2031) | 29.64 gigawatt |
| Growth Rate (2026 - 2031) | 20.23 % |
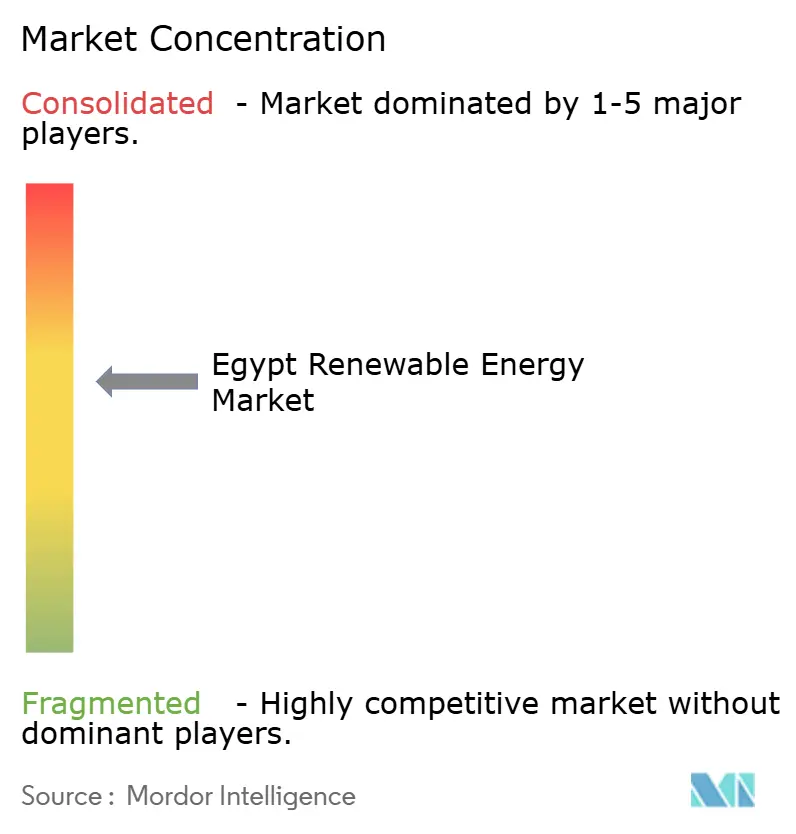
| Market Concentration | Medium |
Major Players *Disclaimer: Major Players sorted in no particular order Image © Mordor Intelligence. Reuse requires attribution under CC BY 4.0. | |
Egypt Renewable Energy Market Analysis by Mordor Intelligence
The Egypt Renewable Energy Market size was valued at 9.81 gigawatt in 2025 and estimated to grow from 11.79 gigawatt in 2026 to reach 29.64 gigawatt by 2031, at a CAGR of 20.23% during the forecast period (2026-2031).
The Egyptian renewable energy market is expanding because policymakers introduced the national target to source 42% of electricity from renewables by 2030. Continued multilateral finance, abundant solar irradiance of about 2,600 kWh/m² in southern governorates, and world–class 55% wind capacity factors along the Gulf of Suez sustain robust project pipelines. Utility-scale schemes still capture 88% of installed capacity, yet distributed rooftops and captive plants record the fastest expansion. The government’s allocation of 41,700 km² for green-hydrogen-linked solar and wind projects underpins a future export platform for low-carbon fuels.
Key Report Takeaways
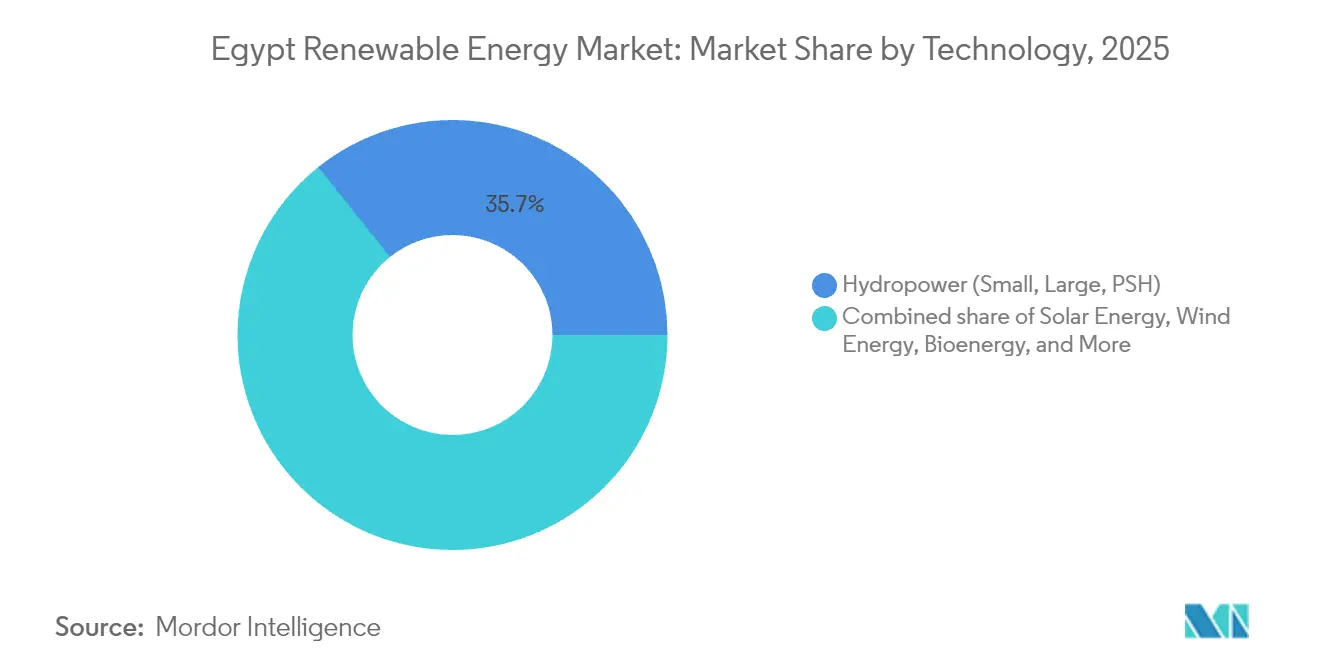
- By technology, hydropower led with a 35.74% share of the Egyptian renewable energy market in 2025, while onshore wind is forecast to expand at a 31.05% CAGR through 2031.
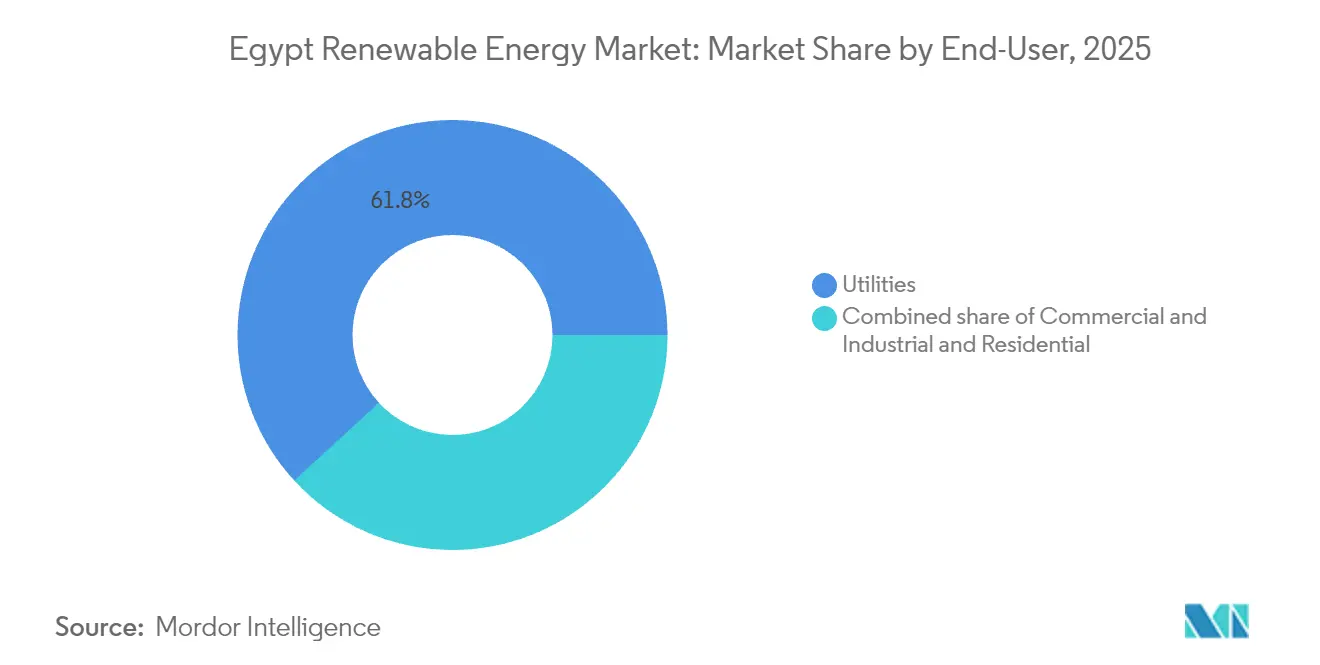
- By end-user, utilities held 61.83% of the Egyptian renewable energy market share in 2025, whereas the commercial and industrial segment records the highest projected 25.78% CAGR to 2031.
Note: Market size and forecast figures in this report are generated using Mordor Intelligence’s proprietary estimation framework, updated with the latest available data and insights as of 2026.
Egypt Renewable Energy Market Trends and Insights
Drivers Impact Analysis*
| Driver | (~) % Impact on CAGR Forecast | Geographic Relevance | Impact Timeline |
|---|---|---|---|
| Supportive government targets and incentives | +4.2% | National, with concentration in Suez, Aswan, and Benban zones | Medium term (2-4 years) |
| Abundant solar irradiance and high-capacity-factor wind corridors | +3.8% | Gulf of Suez for wind; Western Desert and Upper Egypt for solar | Long term (≥4 years) |
| Multilateral climate-finance inflows (EBRD, IFC, Green Bonds) | +3.5% | National, prioritizing grid-connected utility-scale projects | Short term (≤2 years) |
| Green-hydrogen export MoUs triggering additional capacity | +5.1% | Suez Canal Economic Zone, Ain Sokhna, and Mediterranean ports | Long term (≥4 years) |
| Thermal-plant de-risking frees grid headroom | +2.0% | National, with immediate gains in Cairo, Alexandria, and Delta region | Medium term (2-4 years) |
| Rising corporate PPAs from data-centric and industrial clusters | +2.3% | Greater Cairo, Suez Canal corridor, and Red Sea industrial zones | Medium term (2-4 years) |
| Source: Mordor Intelligence | |||
Supportive Government Targets & Incentives
The National Low-Carbon Hydrogen Strategy announced in August 2024 estimates a USD 18 billion GDP uplift by 2040 and more than 100,000 new jobs.[1]“National Low-Carbon Hydrogen Strategy,” Egypt Today, egypttoday.com Public-sector capital re-allocation means half of FY 2024/2025 investment spending is earmarked for green projects compared with 15% three years earlier. The “Golden Licence” regime under Investment Law 72/2017 condenses permitting to a single window, accelerating bankable projects that meet export or import-substitution thresholds. Under the NWFE platform, USD 14.5 billion of concessional finance has flowed to renewables since 2020, with USD 3.9 billion channelled to private developers. Feed-in tariffs ranging from 84.8 Pt/kWh for sub-200 kW systems to 102.5 Pt/kWh for 20-50 MW plants ensure predictable revenues.
Abundant Solar Irradiance & High-CF Wind Corridors
Southern Egypt registers solar brightness near 2,600 kWh/m² annually, placing the Egyptian renewable energy market among the world’s most resource-rich solar provinces.[2]“US-Egypt Renewable Resource Assessment,” U.S. Department of Commerce, trade.gov Red Sea wind corridors exceed 7 m/s, delivering 55% to 63% capacity, enabling levelised costs below USD 0.08/kWh for offshore arrays. Benban Solar Park, a 1.5 GW complex over 37 km², showcases utility-scale density and cost discipline. With resource synergies, hybrid solar-wind sites support 24-hour hydrogen electrolyser operation targeting USD 1.7/kg production by 2050. Such natural advantages anchor the long-term competitiveness of the Egyptian renewable energy industry.
Multilateral Climate-Finance Inflows
EBRD financed USD 479.1 million, about 80% of capital, for Scatec's 1.1 GW solar-plus-storage complex, confirming strong appetite for Egypt's de-risked structures. ACWA Power's 1.1 GW Suez wind farm raised USD 704 million of senior debt from a syndicate led by EBRD and AfDB with 20-year tenors that compress tariffs. IFC's EUR 500 million facility to ENGIE aligns 1.7 GW of capacity with an emissions avoidance of 3.9 MtCO₂ annually. Regional green-bond issuance doubled in 2023, with renewables receiving 37% of proceeds and Egypt's largest single destination. Blended-finance structures continue to crowd private capital for the Egyptian renewable energy market.
Green-Hydrogen Export MoUs Triggering Additional Capacity
Seven MoUs signed since mid-2024 in the Suez Canal Economic Zone envisage USD 42 billion of private investment and 9 GW of dedicated solar-wind capacity. A EUR 7 billion France–Egypt accord targets 1 million t/y of green ammonia by 2029 without sovereign finance exposure. ACWA Power and Itochu agreed to off-take 600,000 t/y of carbon-free ammonia, securing revenue certainty that unlocks project debt. Bankable export contracts accelerate capacity build-out, effectively doubling the Egypt renewable energy market timeline within the current decade.
Restraints Impact Analysis*
| Restraint | (~) % Impact on CAGR Forecast | Geographic Relevance | Impact Timeline |
|---|---|---|---|
| Grid congestion and transmission bottlenecks | -2.8% | Upper Egypt (Aswan, Benban) and Gulf of Suez corridor | Short term (≤2 years) |
| Land-banking delays in designated renewable zones | -1.5% | National, with acute issues in Suez Canal Economic Zone and Western Desert | Medium term (2-4 years) |
| FX depreciation inflates imported equipment costs | -3.2% | National, affecting all import-dependent projects | Short term (≤2 years) |
| Water-scarcity risk for CSP and hybrid-cooling projects | -0.9% | Western Desert and Upper Egypt | Long term (≥4 years) |
| Source: Mordor Intelligence | |||
Grid Congestion & Transmission Bottlenecks
Legacy networks designed for centralised gas turbines strain as renewable penetration edges beyond 3.5 GW, mirroring global queues of 3,000 GW awaiting interconnection.[3]“Grid Integration of Renewables 2024,” International Energy Agency, iea.org Egypt’s wide-area monitoring rollout across 220/500 kV lines lifts visibility but earmarks capital needs approaching USD 600 billion globally by 2030. The 3,000 MW Egypt–Saudi HVDC link scheduled for 2025 provides critical redundancy for variable flows. Planned Libya and Cyprus interconnectors of up to 3,000 MW each could turn Egypt into a regional balancing hub, yet rely on timely domestic grid upgrades. Distribution-level constraints and limited smart-meter penetration still curb the rapid uptake of small-scale generation in the Egyptian renewable energy market.
FX Depreciation Inflates Imported Equipment Costs
The Egyptian pound lost 5.5% in H2 2024, inflating solar module and turbine imports even as reserves climbed to USD 46.4 billion. EliTe Solar’s 5 GW module plant and Elsewedy Electric’s USD 500 million submarine-cable factory illustrate localisation moves that hedge currency swings. IMF support via a USD 5 billion Extended Fund Facility top-up and USD 35 billion UAE investment commitments aim to anchor FX stability. Until hedging tools deepen, volatility will temper near-term capex decisions in the Egyptian renewable energy market.
*Our forecasts treat driver/restraint impacts as directional, not additive. The impact forecasts reflect baseline growth, mix effects, and variable interactions.
Segment Analysis
By Technology: Wind Surges as Hydrogen Anchor
Wind posted a 35.10% share of Egypt renewable energy market size in 2025 and is set for a 31.05% CAGR through 2031 as the Gulf of Suez corridor continues to deliver 40%-plus capacity factors. Hydropower anchored by the 2.1 GW Aswan High Dam retains the largest single-asset footprint but loses share as environmental and transboundary concerns block new dams. Solar PV and CSP supplied roughly 27.84% of capacity in 2025 and will add 8 GW by 2031 on the back of USD 0.12 / W bifacial modules.
Developers prioritize wind for hydrogen because 35%-plus utilization is essential to keep electrolyzer costs down, a threshold solar seldom meets. ACWA Power’s 1.1 GW Suez project, equipped with 138 Envision 6 MW turbines, is contracted to a 400 MW electrolyzer that will export green ammonia to Rotterdam. ENGIE’s 650 MW Red Sea Wind farm added two-hour lithium-ion storage to move power to evening peaks, showcasing hybrid revenue stacking. Pumped-storage options advance slowly due to USD 3.8 billion capital needs and seven-year timelines, while CSP adoption stalls under water scarcity and price competition from solar-plus-battery layouts.



By End-User: Industrial Buyers Reshape Procurement
Utilities controlled 61.83% of Egypt's renewable energy market share in 2025 through the single-buyer model, yet the commercial and industrial segment is tracking a 25.78% CAGR to 2031. The growth reflects rising grid tariffs and access to sustainability-linked financing that shaves up to 100 basis points off loan coupons when firms procure 30% renewable power.
Egypt Aluminium's 1 GW solar PPA at USD 0.028 / kWh exemplifies cost savings of 18% against grid supply and shows how captive projects bypass procurement delays. Data-center expansion in Greater Cairo adds new behind-the-meter demand. Steel and cement firms eye captive wind farms in the Gulf of Suez, leveraging land leases at USD 0.02 / m² and 40% capacity factors to achieve sub-USD 0.03 / kWh supply. Residential uptake remains low at under 3% of capacity, hampered by eight-to-ten-year payback periods under net-metering tariffs set at 70% of retail prices.
Geography Analysis
Upper Egypt’s high irradiance supports massive solar parks such as Benban and Masdar’s approved 1 GW site, collectively exceeding USD 900 million in investment. Red Sea coastal plains host signature wind assets, including ACWA Power’s 1.1 GW Suez project and the planned 10 GW West Suhag farm, where 55-63% capacity factors underpin competitive tariffs. The Suez Canal Economic Zone is emerging as an integrated green-hydrogen export cluster, drawing USD 42 billion of pledged capital for 3 million t/y ammonia output destined for Europe.
Cross-border links reinforce Egypt’s role as a regional energy hub. A 3,000 MW HVDC interconnection with Saudi Arabia goes live in 2025, complementing planned 2,000–3,000 MW upgrades with Libya and a mooted submarine cable to Greece. Daily reserve margins near 15 GW provide operational headroom to absorb variable renewable inflows while exporting surplus to neighbours. Western Desert expanses offer low-conflict land for emerging mega-sites; 41,700 km² is already earmarked for 115 GW of solar-wind capacity.
Mediterranean locations such as El Dabaa register top-tier wind speeds, pushing levelised costs under USD 0.079/kWh for offshore turbines. The Nile Valley remains hydro-centric, yet future water allocation uncertainties accelerate diversification. Industrial cities like Damietta benefit from proximity to Elsewedy Electric’s new cable factory, anchoring supply-chain depth and supporting rapid grid expansion.
Regulatory Landscape
Egypt's renewable power development is anchored by Renewable Energy Law 203/2014 (as amended by Law 11/2022) and the Electricity Law 87/2015, which support IPP/BOO projects and expand market-based procurement. EgyptERA acts as the sector regulator, issuing grid-connection and market participation requirements, including Circular 2/2024 that supports private-to-private (P2P) power arrangements for eligible consumers and generators.
Sector direction sits with the Ministry of Electricity and Renewable Energy (MERE), while the New and Renewable Energy Authority (NREA) supports site development and land allocation in designated wind and solar zones. Environmental compliance and permitting interfaces run through the Egyptian Environmental Affairs Agency (EEAA), while utility-scale offtake and dispatch remain centered on the Egyptian Electricity Transmission Company (EETC) through long-tenor PPAs and interconnection processes that reflect ongoing transmission constraints in Upper Egypt and the Gulf of Suez corridor.
Value Chain Analysis
Egypt's renewable energy value chain starts with policy and program design led by MERE and procurement frameworks executed via EETC as the main utility-scale offtaker, typically using long-tenor PPAs for grid-connected solar and wind. NREA supports early-stage development by allocating land in designated resource zones and providing technical resource data, after which international and regional IPPs such as ACWA Power, Scatec, ENGIE, Masdar/Infinity Power, and AMEA Power contract EPCs and OEMs for turbines, PV modules, inverters, and balance-of-plant, with project finance commonly syndicated by DFIs.
Downstream, grid integration, metering, and dispatch depend on transmission buildout and system services, which increases the role of hybrid designs (solar or wind paired with batteries) and grid-support equipment. Localisation is becoming more visible in enabling components and electrical infrastructure, while bottlenecks persist around land-banking timelines, interconnection queues, and imported-equipment exposure to FX movements, shaping contracting terms and technology choices across the chain.
Competitive Landscape
International developers dominate the current project pipeline, yet partner extensively with domestic firms to navigate permitting and land access. ACWA Power progressed from financial close to construction on a 1.1 GW wind asset backed by USD 704 million of multilateral debt, reaffirming its execution prowess. Scatec secured USD 479 million from EBRD, AfD, B, and BII for a 1.1 GW solar-plus-storage scheme, highlighting battery integration as the next differentiator.
Strategic alliances multiply: BP’s tie-up with Masdar, Hassan Allam, and Infinity Power targets green-hydrogen value chains, leveraging BP’s LNG marketing and Masdar’s solar pipeline. AMEA Power, after commissioning Africa’s largest 500 MW solar project, is adding 600 MWh of storage, illustrating first-mover advantages in hybrid assets. Local manufacturing gains momentum; EliTe Solar’s 5 GW module plant and Elsewedy’s submarine-cable facility cut currency exposure and support domestic content rules.
Regulatory innovations such as the Golden Licence accelerate entrants that deliver export earnings or technology transfer; 29 licences were issued by March 2024. Distributed-generation specialists and smart-grid providers represent emerging disruptors as utilities modernise billing and congestion management. Overall, the Egyptian renewable energy market is moderately concentrated, yet rising localisation and industrial demand are lowering entry barriers for niche players with storage or digital expertise.
Egypt Renewable Energy Industry Leaders
ACWA Power
Scatec ASA
Infinity Power / Masdar JV
Lekela Power
Siemens Gamesa / ENGIE consortium
- *Disclaimer: Major Players sorted in no particular order

Market Opportunities and Future Outlook
Near-term whitespace is concentrated in hybrid renewable-plus-storage builds and grid-support services that address congestion and flexibility needs. The FY 2025/2026 national plan referenced by MPEDIC targets total investments of EGP 136.3 billion across the electricity and renewable energy sector, alongside a stated goal of nearly 20% renewable share in 2025/2026, and milestones that include 11,216 MW of installed renewable capacity and 1,220 MWh of battery storage by end-2026. This creates clearer openings for battery integration, EMS controls, and EPC/O&M capability scaling.
A second opportunity layer comes from large corporate and export-linked demand anchors that support bankable long-tenor contracts beyond pure government tenders. Evidence of this shift includes Scatec's Obelisk solar-plus-storage project reaching COD for its first phase and ENGIE signing a 900 MW onshore wind PPA with EETC in 2026, alongside ongoing expansions at Benban and the Abydos 2 solar project inspected by MERE. Together with the green-hydrogen-linked land earmarking cited in the report context, these steps broaden demand for dedicated renewable capacity, port-adjacent power infrastructure, and P2P contracting mechanisms under EgyptERA guidance.
Recent Industry Developments
- July 2026: African Development Bank approved support for a 500 MW solar-plus-storage project in Egypt. The decision reinforces the role of DFI-backed hybrid projects in clearing bankability hurdles and accelerates battery-linked solar pipelines aligned with grid stability needs.
- December 2025: IFC announced a USD 571.8 million debt package, led by IFC, to support AMEA Power in developing Abydos II, a 1,000 MW solar PV plant with a 600 MWh BESS in Aswan Governorate. The financing structure strengthens the template for large utility-scale solar paired with storage and expands the pool of bankable hybrid assets.
- December 2024: AMEA Power commissioned the 500 MW Abydos Solar PV plant in Aswan Governorate. Commissioning added a major utility-scale PV block to the national generation mix and provided an operating reference point for subsequent expansions and storage pairing in Upper Egypt.


Research Methodology Framework and Report Scope
Market Definition and Coverage
For this study, the Egypt renewable energy market is defined as the installed electricity generation capacity from renewable sources operating in Egypt, measured in gigawatts for the stated base year and forecast years.
Scope exclusions: It excludes fossil fuel generation capacity and general power grid assets unless they are directly part of renewable generation capacity additions.
Segmentation Overview
- By Technology
- Solar Energy (PV and CSP)
- Wind Energy (Onshore and Offshore)
- Hydropower (Small, Large, PSH)
- Bioenergy
- Geothermal
- Ocean Energy (Tidal and Wave)
- By End-User
- Utilities
- Commercial and Industrial
- Residential
Data Sources, Market Sizing, and Validation
Desk Research
Desk research was used to build a clean fact base on Egypt renewable capacity additions, operating fleet, and the near-term project pipeline before assumptions were finalized. We relied on public sources such as the International Renewable Energy Agency capacity statistics, International Energy Agency power sector context, the World Bank development indicators, and the New and Renewable Energy Authority publications for national targets and project updates.
It was then cross-checked using Ministry of Electricity and Renewable Energy releases, utility and regulator notices where available, and company annual reports and investor presentations that state project size and commissioning status. A paid subscription for company financials and news supported verification of ownership changes and timeline slippages when public updates were unclear. This list is illustrative only, and we reviewed additional public and paid sources for data collection, validation, and clarification.
Primary Interviews and Surveys
Primary work focused on validating what is operating versus what is still in planning, since public pipelines can overstate near-term delivery. We spoke with a mix of developers, EPC and O&M participants, financing and advisory stakeholders, and large power buyers to confirm commissioning dates, typical capacity factors, and how grid readiness affects project delivery in Egypt.
We also checked tender timing, permitting flow, and equipment availability with local and regional experts, then adjusted assumptions when the same constraint came up across multiple conversations.
Distribution of primary research fieldwork respondents
| Company type | Respondent position |
|---|---|
| Top tier: 36% | CXOs: 13% |
| Mid tier: 46% | Functional/Unit leaders: 39% |
| Smaller Players: 18% | Managers: 48% |
Market-Sizing & Forecasting
Sizing started with a top-down build where national renewable capacity is reconstructed year by year using official installed-capacity series and project commissioning signals, and then mapped into what is expected to connect in the forecast window. After that view was set, selective bottom-up checks were used, such as rolling up major project announcements, sampling typical MW block sizes seen in tenders, and testing implied annual additions against what developers say is achievable.
Inputs that mattered most for Egypt included installed capacity by renewable source, expected commissioning timelines of major projects, tender calendars and award cadence, grid connection readiness, and utilization profiles for solar and wind (capacity factors) that shape how pipelines translate into delivered assets. Where project details were incomplete, gaps were handled using conservative timing ranges supported by expert feedback and comparison to similar projects already built locally.
For forecasting, scenario analysis was used rather than a single straight-line extrapolation, since outcomes are sensitive to award timing and connection delays. A base case was chosen after aligning it with expert consensus on feasible annual additions, and then stress-tested against slower and faster buildout paths so the final results stay repeatable.
Data Validation & Update Cycle
Outputs were triangulated against independent signals, including the published installed capacity trajectory, announced COD shifts in major projects, and reasonableness checks between annual additions and known execution constraints. When an outlier appeared, we reviewed the driver again, and corrected or documented the assumption before sign-off.
Before publication, the work goes through multi-step internal reviews where calculations, units, and year mapping are checked, followed by re-contact triggers when a key project moves or a policy change creates a material shift. The report is refreshed annually, and interim updates are made when major awards, commissioning milestones, or regulatory events materially change the near-term outlook. Right before delivery, a final pass is completed so clients receive the latest view.
Mordor Intelligence's Egypt Renewable Energy Market Size Compared Against Other Published Estimates
Published estimates for Egypt renewable energy often do not line up because they are not always measuring the same thing, even when they use the same market name. Differences usually come from whether the market is tracked as installed capacity or as revenue, which years are treated as the base, and how project pipelines are translated into delivered outcomes.
The spread also comes from scope differences, where some studies combine generation assets with wider electricity value chain activities, and from how future values are built, since some models assume aggressive buildout without rechecking commissioning slippage. Currency conversion timing and refresh cadence also matter when a market is presented in USD while many underlying inputs are updated in local terms.
Benchmark comparison
| Source | Market Size | Gaps in Research Methodology |
|---|---|---|
| Mordor Intelligence | USD 0.01 B (2025) | |
| Industry Publisher A | USD 3.50 B (2025) | Uses a revenue-based definition with end-user and regional splits, so it captures financial value of renewable energy activity rather than installed capacity, which makes the totals not directly comparable to a GW-based market size. |
| Market Publisher B | USD 3.83 B (2026) | Appears to include broader electricity value chain elements (such as transmission and distribution) and uses a different start year, which can expand the measured market versus a generation-capacity-only view. |
The table shows a unit mismatch across sources, and in Mordor Intelligence's model the number is anchored to installed renewable generation capacity in GW (9.81 GW in 2025) rather than a monetized revenue pool. Once the scope is aligned to either capacity additions or financial value, most of the spread becomes explainable through base year choice, included activities, and how commissioning timing is treated in the forecast.


Key Questions Answered in the Report
What capacity is the Egypt renewable energy market expected to reach by 2031?
The market is projected to grow to 29.64 GW by 2031 on the back of wind energy additions.
Which technology segment is growing the fastest?
Onshore wind, supported by Gulf of Suez wind speeds, is advancing at a 31.05% CAGR through 2031.
Why are corporate PPAs rising in Egypt?
Industrial buyers seek cost savings and sustainability-linked loan discounts, making long-term solar or wind PPAs attractive.
How is currency risk managed in new PPAs?
Developers increasingly index a portion of tariffs to hard currencies or seek sovereign guarantees to hedge pound depreciation.
What are the main transmission challenges?
The 500 kV backbone in Upper Egypt and the Gulf of Suez is near saturation, prompting mandatory storage and new line investments.
Which companies lead large-scale hydrogen-linked projects?
ACWA Power, Masdar, and Infinity Power head consortia that integrate gigawatt-scale renewables with electrolyzers for export.
Page last updated on:





