Market Overview
| Study Period | 2020 - 2031 |
|---|---|
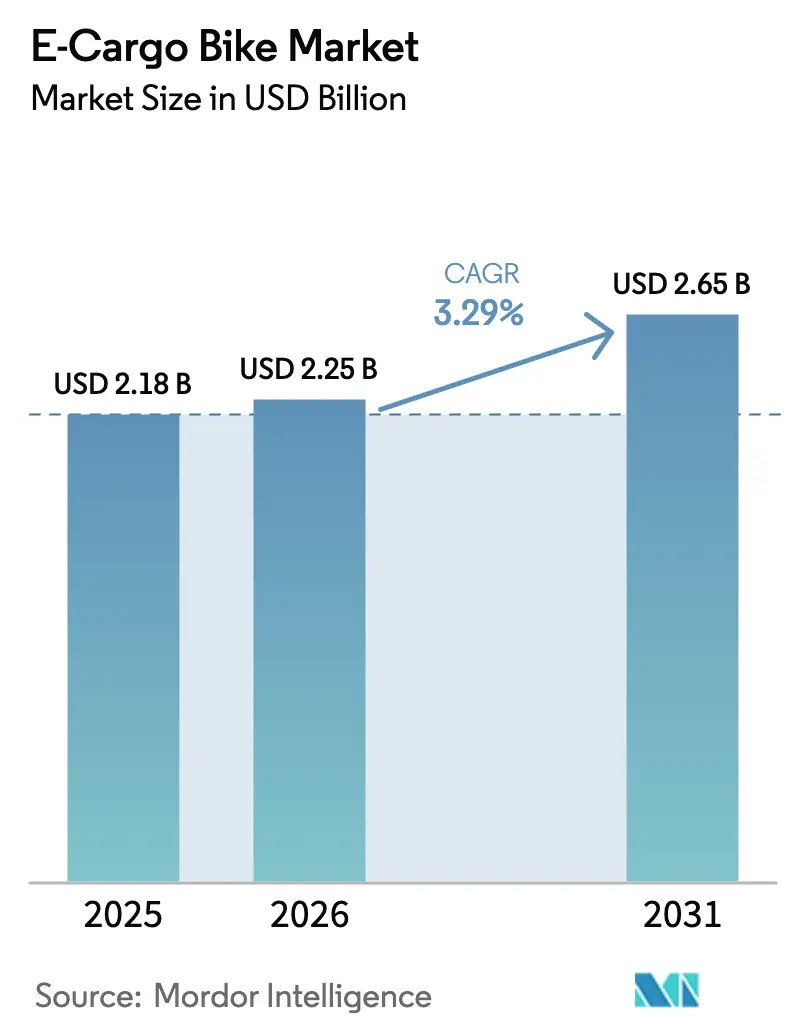
| Market Size (2026) | USD 2.25 Billion |
| Market Size (2031) | USD 2.65 Billion |
| Growth Rate (2026 - 2031) | 3.29% CAGR |
| Fastest Growing Market | North America |
| Largest Market | Asia Pacific |
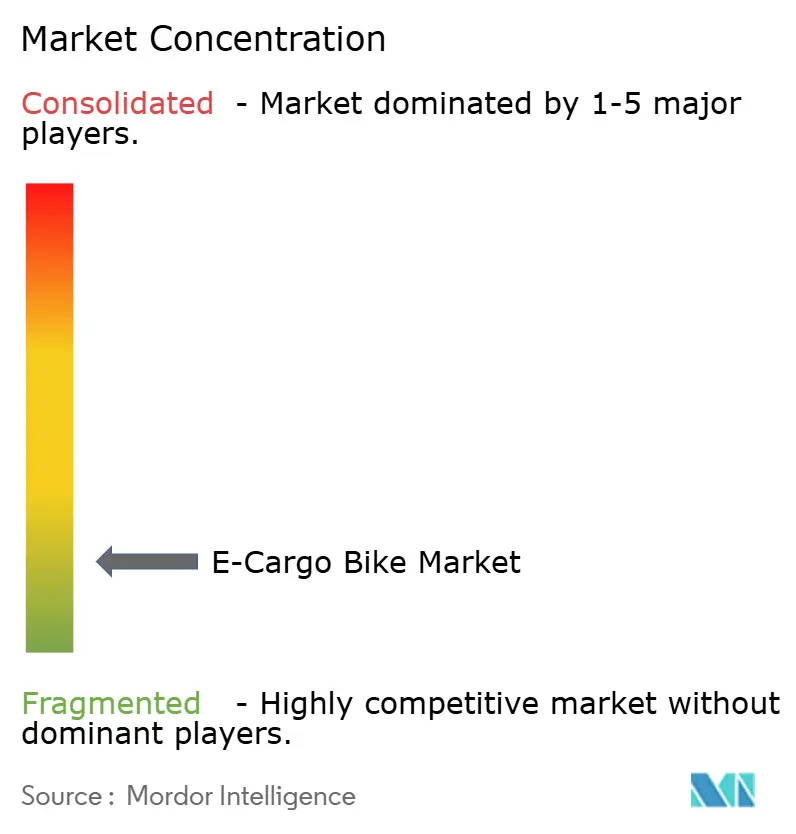
| Market Concentration | Low |
Major Players *Disclaimer: Major Players sorted in no particular order Image © Mordor Intelligence. Reuse requires attribution under CC BY 4.0. | |
E-Cargo Bike Market Analysis by Mordor Intelligence
The global e-cargo bike market size is expected to grow from USD 2.18 billion in 2025 to USD 2.25 billion in 2026 and is forecast to reach USD 2.65 billion by 2031 at 3.29% CAGR over 2026-2031. This steady trajectory reflects a clear shift from niche micromobility product to a critical component of commercial logistics infrastructure. Declining battery costs, rapid urbanization, and stricter emissions rules combine to shrink the total cost of ownership gap with conventional cargo cycles. Municipal low-emission zones now block diesel vans from dense downtown cores, so fleet operators turn to e-cargo solutions to avoid congestion fees and meet Scope 3 reporting obligations. Corporate sustainability targets accelerate adoption because every deployed bike delivers a verifiable reduction in carbon and noise. At the same time, component innovation such as mid-drive motors and integrated telematics is expanding the functional envelope of commercial cargo cycling, improving hill-climbing performance and fleet uptime.
Key Report Takeaways
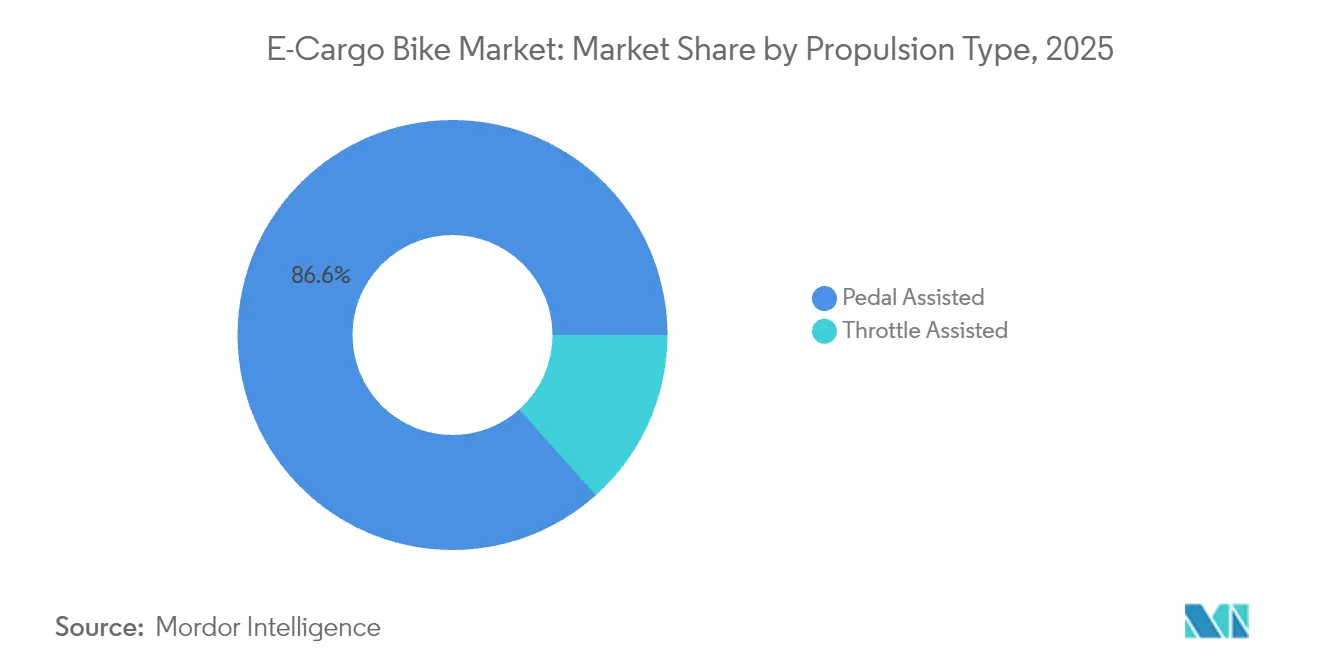
- By propulsion type, pedal-assist configurations captured 86.62% of the e-cargo bike market share in 2025; throttle-assist units record the fastest projected CAGR at 4.12% to 2031.
- By battery type, lithium-ion accounted for 72.58% of the e-cargo bike market size in 2025 and is projected to expand at a 3.62% CAGR between 2026 and 2031.
- By motor placement, mid-drive systems held 54.88% share of the e-cargo bike market in 2025 while registering the highest 3.84% CAGR through 2031.
- By drive systems, chain drive accounted for 61.37% share of the e-cargo bike market in 2025, while belt drive will be registering the highest 5.05% CAGR through 2031.
- By motor power, 251-350 W rated bikes held 37.02% share of the e-cargo bike market in 2025, while 501-600 W will register the highest 4.63% CAGR through 2031.
- By price band, the USD 1,500-2,499 segment held 29.62% share in 2025, while the USD 2,500-3,499 tier is set to grow at 5.88% CAGR.
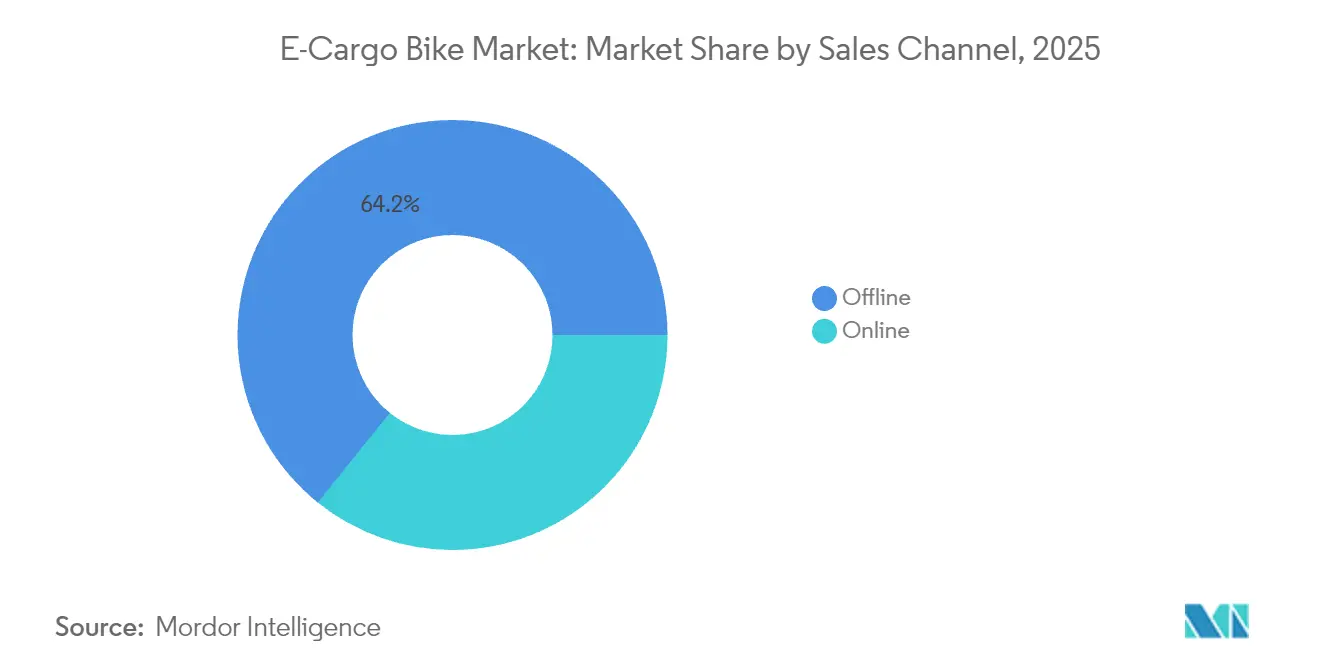
- By sales channel, offline outlets held 64.22% share of the e-cargo bike market in 2025, while the online segment will register the highest 6.21% CAGR through 2031.
- By end use, commercial delivery dominated with 58.41% share of the e-cargo bike market in 2025, and service providers emerged as the fastest-growing user group at 5.51% CAGR.
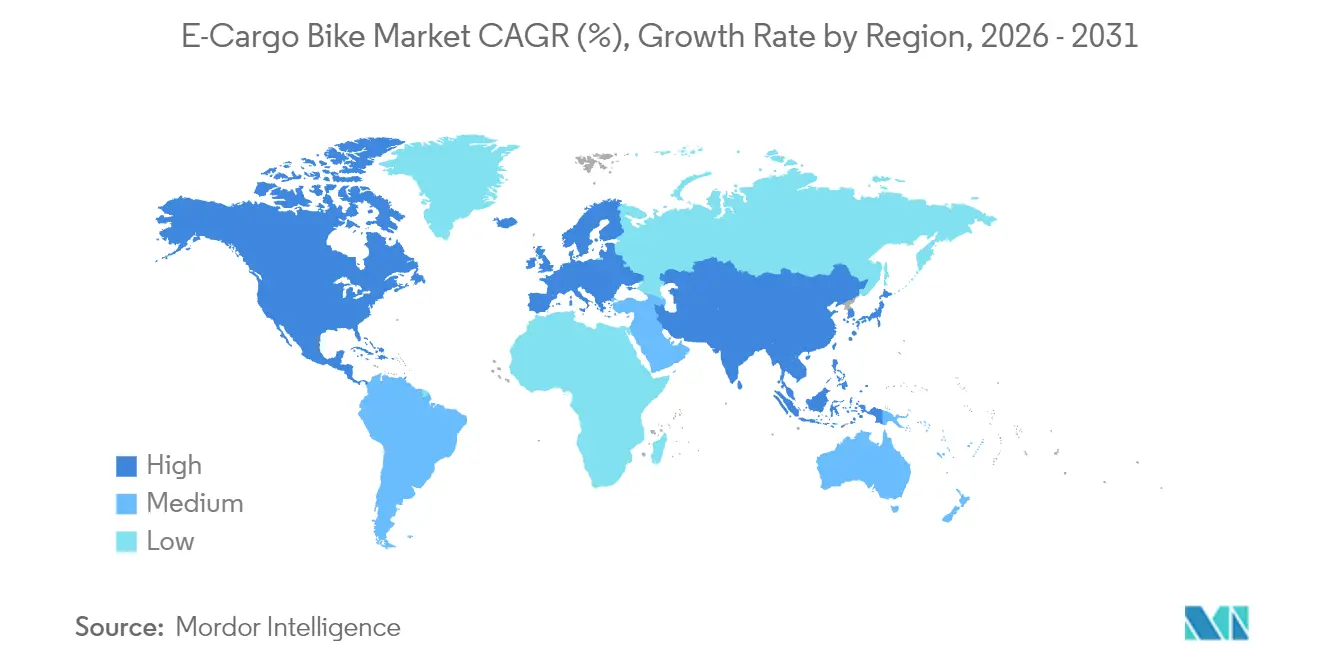
- By geography, Asia-Pacific controlled 47.55% revenue in 2025, whereas North America is the fastest growing region with a 6.95% CAGR to 2031.
Note: Market size and forecast figures in this report are generated using Mordor Intelligence’s proprietary estimation framework, updated with the latest available data and insights as of 2026.
Global E-Cargo Bike Market Trends and Insights
Drivers Impact Analysis*
| Driver | (~) % Impact on CAGR Forecast | Geographic Relevance | Impact Timeline |
|---|---|---|---|
| Growing Last-Mile Delivery Services | +0.8% | North America and Europe core, global spillover | Short term (≤ 2 years) |
| Green Incentives and Subsidies | +0.6% | Europe and North America, expanding to Asia-Pacific | Medium term (2–4 years) |
| Decreasing Lithium-Ion Battery Prices | +0.5% | Global | Medium term (2–4 years) |
| Expanding Protected Cycling Infrastructure | +0.4% | Europe and North America, selected Asia-Pacific cities | Long term (≥ 4 years) |
| Corporate Sustainability Reporting Pressure | +0.3% | Global, led by Europe and North America | Medium term (2–4 years) |
| Optimizing Fleets with Telematics | +0.2% | North America and Europe, moving into Asia-Pacific | Short term (≤ 2 years) |
| Source: Mordor Intelligence | |||


Growth of Last-Mile Delivery Services
Package density in large cities keeps rising and pushes fleet managers toward alternatives that navigate narrow streets and loading zones with fewer delays. Logistics operators report that e-cargo units complete peak-hour routes quicker than light vans, cutting routine parking fines and congestion fees. Amazon deployed a significant number of cargo bikes across European countries over time, signaling that the solution now scales beyond courier specialists. Emerging low-emission zones reinforce the trend because diesel entry fees often exceed the daily operating cost of an e-cargo unit. Faster drop times, fewer fines, and urban access privileges ensure that the e-cargo bike market continues to expand within metropolitan fulfillment networks [1]“Urban Delivery Emissions and Mode Shift,” European Environment Agency, eea.europa.eu.
Government Incentives and Subsidies
Fiscal instruments make purchase decisions easier for fleet accountants. The United States federal tax credit covers the acquisition price for qualifying commercial cargo e-cycles, while Germany earmarks funds for fleet grants and charging hardware. Cities, including Paris and Copenhagen, layer local rebates on top, trimming the payback horizon for high-utilization operators. Preferential access to bus lanes and exemptions from gross vehicle-weight rules add operational savings that compound the effect of direct subsidies.
Declining Lithium-Ion Battery Prices
Pack prices have steadily declined over time, reaching significantly lower levels. Greater cell energy density means that the same chassis range can be met with fewer cells, reducing both cost and curb weight. Leading cell makers such as CATL allocate specialized production lines for light-mobility chemistries, yielding further scale benefits. Commercial packs now exceed the charge cycles before dropping, which stretches operational life past five years for urban fleets. The economics of the e-cargo bike market, therefore, no longer hinge on uncertain battery residual values [2]“E-Mobility Battery Production Lines,” Contemporary Amperex Technology, catl.com .
Expansion of Protected Cycling Infrastructure
Global investments in dedicated bike lanes have seen significant growth. Physical segregation lowers insurance premiums and accident claims for cargo operators. Cities have begun to add loading bays and curbside charging points tailored to wide-body cargo frames, an important design consideration given the extra footprint of delivery boxes. The result is predictable, all-weather routing that improves fleet utilization and widens the addressable market beyond city centers [3]“Global Cycling Infrastructure Funding 2024,” Global Designing Cities Initiative, globaldesigningcities.org.
Restraints Impact Analysis*
| Restraint | (~) % Impact on CAGR Forecast | Geographic Relevance | Impact Timeline |
|---|---|---|---|
| High Upfront Cost Barrier | -0.4% | Global, pronounced in price-sensitive regions | Short term (≤ 2 years) |
| Limited Payload Capacity Issues | -0.3% | Global, acute in North America | Medium term (2–4 years) |
| Gaps in Charging Infrastructure | -0.2% | Asia-Pacific and emerging markets, selected North America | Medium term (2–4 years) |
| Fragmented Component Standards | -0.1% | Global, supply chain centered in Asia-Pacific | Long term (≥ 4 years) |
| Source: Mordor Intelligence | |||
High Upfront Cost vs. Conventional Cargo Bikes
Electric drivetrains significantly increase the sticker price compared to traditional human-powered cargo frames. Small businesses often lack leasing options and cannot offset capital expenditure against fuel savings quickly. The break-even point still requires significant operating hours per week in many cities. Financial institutions are gradually rolling out asset-backed products for light electric fleets, but penetration remains limited outside Europe and North America. Until capital markets mature, upfront economics will check rapid diffusion in cost-sensitive regions.
Limited Payload Capacity Versus Vans
Typical e-cargo chassis carry 100-200 kg while compact delivery vans exceed 1,000 kg. Larger parcels, therefore, force operators to retain mixed fleets, increasing complexity. Battery packs and motors consume up to one quarter of total vehicle mass, further squeezing useful load. The issue is felt most in North America, where residential deliveries often include bulky items and cover longer distances.,
*Our forecasts treat driver/restraint impacts as directional, not additive. The impact forecasts reflect baseline growth, mix effects, and variable interactions.
Segment Analysis
By Propulsion Type: Pedal-Assist Dominates Commercial Fleets
Pedal-assist configurations controlled 86.62% of the 2025 e-cargo bike market. The format lines up with European and Japanese legal thresholds that allow higher peak output so long as the rider is pedaling. That legal clarity lowers insurance and license costs for fleet owners. Torque-sensor systems have become more refined, adjusting power delivery by load and gradient to extend range. Throttle-assist bikes are growing at a 4.12% CAGR as North American jurisdictions relax wattage caps, yet the mode still faces tighter licensing in core European cities.
Demand patterns underscore why pedal-assist remains the workhorse for urban logistics. The technology allows continuous operation inside protected lanes without triggering motor-vehicle rules. Because pedal input remains mandatory, average energy consumption is lower than throttle alternatives, delaying mid-route charging stops. For high-density courier networks, that efficiency combines with lighter regulatory compliance to protect the total cost of ownership.


By Battery Type: Lithium-Ion Achieves Cost-Performance Leadership
Lithium-ion packs delivered 72.58% of total shipments in 2025 and will retain the crown through 2031 at 3.62% CAGR. Energy density gains now break the 250 Wh/kg barrier, which shrinks pack size for a given range. Rising volumes from electric automotive lines feed secondary markets such as e-cargo frames, driving a favorable pricing glide path. LFP variants are winning share within the lithium family because the chemistry provides thermal stability valued by fire-safety regulators and last-mile insurers.
Lead-acid holds a foothold in entry-level Asian markets due to its low sticker price, yet fleet operators usually migrate to lithium within two replacement cycles. Longer cycle life translates into fewer battery swaps over a five-year horizon, tipping total cost of ownership toward lithium even where electricity prices are high. Enhanced battery management systems now bundle cell-balancing and temperature cutoffs, raising safety credentials and unlocking broader municipal approvals.
By Motor Placement: Mid-Drive Systems Excel in Commercial Applications
Mid-drive layouts secured 54.88% market share in 2025 and should widen the gap by posting a 3.84% CAGR. With the motor linked directly to the crank, torque multiplies through the bicycle drivetrain, preserving power on steep grades and under heavy cargo loads. Balanced weight distribution also means safer cornering with a full load. Hub motors keep traction on flat terrain and carry marginally lower maintenance costs, but face heat build-up when ascending hills repeatedly.
Fleet buyers gravitate toward mid-drive packages for downtown routes that feature frequent stop-start and short but steep climbs. Service intervals are slightly shorter because chains and gears experience higher loads, yet operators accept this trade-off for superior ride dynamics and lower battery drain per kilometer.
By Drive Systems: Belt Drive Gains Commercial Adoption
Chain systems controlled 61.37% of drive trains in 2025, yet belt alternatives are climbing quickly with a 5.05% CAGR. Carbon-reinforced belts carry no lubrication needs and last upward of 30,000 miles, a tenfold improvement over standard chains. Noise reduction is another draw for residential deliveries scheduled during early morning or late evening slots.
Not every fleet moves to belts since replacement parts remain costlier and less universally stocked than chains. High-torque courier applications in hilly cities also prefer the metal-to-metal engagement of chains for maximum efficiency. The decision continues to differ by geography: European postal fleets lean toward belts for low-noise criteria, whereas cost-focused operators in Southeast Asia stay with chains.

By Motor Placement: Mid-Drive Systems Excel in Commercial Applications
The 251-350 W class captured 37.02% of the e-cargo bike market share in 2025, underscoring its balance between legal compliance and practical torque for 150 kg payloads. Operators value the class because it meets European watt limits while still conquering short urban gradients without straining batteries. As a result, fleet insurers classify these bikes within standard bicycle policies, shaving coverage costs and accelerating procurement decisions among large couriers.
Higher-output 501-600 W systems are forecast to post the fastest 4.63% CAGR through 2031 as the United States and Japanese rules permit their wider use. These motors unlock heavier route profiles and snowy-season reliability, making them attractive to municipal contractors and grocery chains that run multi-shift schedules. Battery density gains offset added draw, preserving real-world range and protecting total cost of ownership.
By Price Band: Premium Segments Drive Commercial Growth
The USD 1,500-2,499 bracket accounted for 29.62% of the e-cargo bike market size in 2025, marking the entry point for fleet-grade frames with basic telematics. Buyers in this range emphasize rapid payback and often deploy bikes in single-shift food delivery routes where utilization stays below 30 km per day.
Growth momentum, however, sits in the USD 2,500-3,499 tier, projected at a 5.88% CAGR to 2031. These premium models bundle mid-drive motors, carbon belt drives, and cloud dashboards that cut unplanned downtime. Leasing products that roll hardware, software, and service into one monthly fee neutralizes sticker shock for corporate accountants. Consequently, large retailers and postal groups increasingly standardize on the premium band for multiyear fleet refresh cycles.
By Sales Channel: Online Growth Accelerates Commercial Adoption
Brick-and-mortar (offline) dealers retained 64.22% of the global e-cargo bike market share in 2025 because fleet managers still prize local service contracts and pre-delivery inspections. Showroom trials help buyers validate payload ergonomics and braking before signing multi-unit orders, anchoring the channel’s short-term dominance in dense European and Asian metropolitan areas.
Online portals are outpacing the overall market with a 6.21% CAGR thanks to configurators that let operators compare motors, batteries, and cargo boxes in real time. Integrated financing and bulk-order APIs streamline corporate purchasing workflows, while direct-to-depot shipping trims lead times. Manufacturers, therefore, adopt omnichannel models: specification and contract negotiation occur online, but handover and servicing remain with certified local shops. The hybrid approach aligns digital efficiency with the high-touch needs of commercial fleets.
By End Use: Service Providers Emerge as Growth Segment
Commercial delivery fleets held 58.41% of the e-cargo bike market share in 2025, driven by parcel and food platforms that exploit lane access privileges to halve inner-city drop times. Optimized routing algorithms and modular cargo boxes allow high stop densities, reinforcing the segment’s cost leadership over diesel vans in congestion zones.
Service providers, utilities, telecom maintenance, and facility managers are set to expand at a 5.51% CAGR through 2031. These operators appreciate silent operation during residential calls and the ability to park curbside without permits. Tool-rack conversions and on-board power inverters turn the bike into a mobile workshop, boosting first-time fix rates. Sustainability reporting adds further pull, as every e-cargo unit contributes verifiable Scope 3 reductions toward corporate carbon targets with minimal infrastructure outlay.
Geography Analysis
Asia-Pacific controlled 47.55% revenue in 2025, thanks to deep supplier ecosystems in China and regulatory headroom in Japan that approves commercial motors. Local OEMs integrate battery, motor, and chassis under one roof, driving down unit cost and shortening design cycles. As a result, the region functions both as a production hub and as the largest single demand center, especially within tier-one Chinese cities where congestion charges now favor electric cargo cycles.
North America is the fastest riser with a 6.95% CAGR to 2031. Federal tax credits, city-funded bike lane networks, and growing consumer expectations for same-day delivery combine to create a strong pull. Operators such as UPS and FedEx openly publish emission dashboards, which adds board-level pressure to pivot from vans to bikes. The environmental narrative pairs with practical advantages in gridlocked downtown cores where curbside parking tickets once ate into profit margins.
Europe maintains a mature yet still expanding opportunity. Harmonized EN 15194 certification streamlines cross-border fleet deployment, and cities such as Amsterdam and Berlin grant e-cargo bikes access to bus lanes plus loading bays outside retail stores. The combination of regulation clarity and extensive infrastructure yields stable growth. Emerging markets in South America and Africa are starting from a low base but could pick up speed once credit facilities mature and local assembly plants lower import duties.

Competitive Landscape
Market fragmentation remains moderate. Both legacy bicycle brands and pure-play startups can carve regional niches. Established manufacturers like Giant and Accell leverage scale purchasing of battery cells and motors to keep lead times short. Specialist makers such as Riese & Müller focus on modular chassis and smart-lock cargo boxes for courier fleets that require security and box-swap speed.
Strategic differentiation increasingly relies on vertically integrating hardware, software, and servicing. Bosch and Shimano invest heavily in motor control algorithms that extend range and enable predictive maintenance readouts, which help fleets cut downtime. Chinese groups, including Yadea, bundle battery supply security with aggressive pricing that threatens smaller European assemblers. Intellectual property filings around telematics interfaces and torque sensor calibration rose significantly, reflecting the pivot toward data-driven value propositions.
Fleet buyers openly favor vendors who can guarantee parts for several years and provide cloud dashboards for real-time performance metrics. Accordingly, some startups are forging partnerships with telecom operators to embed eSIM modules that unlock global data roaming without aftermarket modems. Refrigerated cargo variants and long-tail frames for bulky white-goods delivery remain open white spaces where no clear leader has emerged.
E-Cargo Bike Industry Leaders
Rad Power Bikes Inc.
Yadea Group Holdings Ltd.
Accell Group
Giant Manufacturing Co. Ltd
Riese & Müller GmbH
- *Disclaimer: Major Players sorted in no particular order

Recent Industry Developments
- August 2025: E-Motorrad introduced the G1 Cargo with a claimed 100 km pedal-assist range, positioning it for Asian last-mile fleets.
- March 2025: Tern rolled out its updated GSD cargo bike for Europe and North America, featuring a 210 kg gross vehicle rating and reinforced aluminum frame.
- October 2024: India’s Zadd Bikes launched the Utility Hauler for domestic last-mile delivery operators.
- July 2024: Titanium specialist Vello released the Sub Titanium long-tail cargo model at roughly 24 kg curb weight for customers prioritizing low mass.


Global E-Cargo Bike Market Report Scope
Pedal Assisted, Speed Pedelec, Throttle Assisted are covered as segments by Propulsion Type. Lead Acid Battery, Lithium-ion Battery, Others are covered as segments by Battery Type. Africa, Asia-Pacific, Europe, Middle East, North America, South America are covered as segments by Region.By Propulsion Type
| Pedal Assisted |
| Throttle Assisted |
By Battery Type
| Lead Acid Battery |
| Lithium-ion Battery |
| Others |
By Motor Placement
| Hub (Front/Rear) |
| Mid-Drive |
By Drive Systems
| Chain Drive |
| Belt Drive |
By Motor Power
| Below 250 W |
| 251-350 W |
| 351-500 W |
| 501-600 W |
| Above 600 W |
By Price Band
| Up to USD 1,000 |
| USD 1,000-1,499 |
| USD 1,500-2,499 |
| USD 2,500-3,499 |
| USD 3,500-5,999 |
| Above USD 6,000 |
By Sales Channel
| Online |
| Offline |
By End Use
| Commercial Delivery | Retail and Goods Delivery |
| Food and Beverage Delivery | |
| Service Providers | |
| Others |
By Geography
| North America | United States |
| Canada | |
| Mexico | |
| South America | Brazil |
| Argentina | |
| Rest of South America | |
| Europe | Austria |
| Belgium | |
| Denmark | |
| France | |
| Germany | |
| Italy | |
| Luxembourg | |
| Netherlands | |
| Norway | |
| Poland | |
| Spain | |
| Sweden | |
| Switzerland | |
| United Kingdom | |
| Rest of Europe | |
| Asia-Pacific | Australia |
| China | |
| India | |
| Japan | |
| New Zealand | |
| South Korea | |
| Rest of Asia-Pacific | |
| Middle East and Africa | Saudi Arabia |
| United Arab Emirates | |
| South Africa | |
| Rest of the Middle East and Africa |
| By Propulsion Type | Pedal Assisted | |
| Throttle Assisted | ||
| By Battery Type | Lead Acid Battery | |
| Lithium-ion Battery | ||
| Others | ||
| By Motor Placement | Hub (Front/Rear) | |
| Mid-Drive | ||
| By Drive Systems | Chain Drive | |
| Belt Drive | ||
| By Motor Power | Below 250 W | |
| 251-350 W | ||
| 351-500 W | ||
| 501-600 W | ||
| Above 600 W | ||
| By Price Band | Up to USD 1,000 | |
| USD 1,000-1,499 | ||
| USD 1,500-2,499 | ||
| USD 2,500-3,499 | ||
| USD 3,500-5,999 | ||
| Above USD 6,000 | ||
| By Sales Channel | Online | |
| Offline | ||
| By End Use | Commercial Delivery | Retail and Goods Delivery |
| Food and Beverage Delivery | ||
| Service Providers | ||
| Others | ||
| By Geography | North America | United States |
| Canada | ||
| Mexico | ||
| South America | Brazil | |
| Argentina | ||
| Rest of South America | ||
| Europe | Austria | |
| Belgium | ||
| Denmark | ||
| France | ||
| Germany | ||
| Italy | ||
| Luxembourg | ||
| Netherlands | ||
| Norway | ||
| Poland | ||
| Spain | ||
| Sweden | ||
| Switzerland | ||
| United Kingdom | ||
| Rest of Europe | ||
| Asia-Pacific | Australia | |
| China | ||
| India | ||
| Japan | ||
| New Zealand | ||
| South Korea | ||
| Rest of Asia-Pacific | ||
| Middle East and Africa | Saudi Arabia | |
| United Arab Emirates | ||
| South Africa | ||
| Rest of the Middle East and Africa | ||


Market Definition
- By Application Type - Cargo e-bikes are considered under the scope of this segment. The e-cargo or utility e-bikes are designed to carry various types of cargo and packages for shorter distances such as within urban areas
- By Battery Type - This segment includes lithium-ion batteries, lead-acid batteries, and other battery types. The other battery type category includes nickel-metal hydroxide (NiMH), silicon, and lithium-polymer batteries.
- By Propulsion Type - E-bikes considered under this segment include pedal-assisted e-bikes, throttle-assisted e-bikes, and speed pedelec. While the speed limit of pedal and throttle-assisted e-bikes is usually 25 km/h, the speed limit of speed pedelec is generally 45 km/h (28 mph).
| Keyword | Definition |
|---|---|
| Pedal Assisted | Pedal-assist or pedelec category refers to the electric bikes that provide limited power assistance through torque-assist system and do not have throttle for varying the speed. The power from the motor gets activated upon pedaling in these bikes and reduces human efforts. |
| Throttle Assisted | Throttle-based e-bikes are equipped with the throttle assistance grip, installed on the handlebar, similarly to motorbikes. The speed can be controlled by twisting the throttle directly without the need to pedal. The throttle response directly provides power to the motor installed in the bicycles and speeds up the vehicle without paddling. |
| Speed Pedelec | Speed pedelec is e-bikes similar to pedal-assist e-bikes as they do not have throttle functionality. However, these e-bikes are integrated with an electric motor which delivers power of approximately 500 W and more. The speed limit of such e-bikes is generally 45 km/h (28 mph) in most of the countries. |
| City/Urban | The city or urban e-bikes are designed with daily commuting standards and functions to be operated within the city and urban areas. The bicycles include various features and specifications such as comfortable seats, sit upright riding posture, tires for easy grip and comfortable ride, etc. |
| Trekking | Trekking and mountain bikes are special types of e-bikes that are designed for special purposes considering the robust and rough usage of the vehicles. These bicycles include a strong frame, and wide tires for better and advanced grip and are also equipped with various gear mechanisms which can be used while riding in different terrains, rough grounded, and tough mountainous roads. |
| Cargo/Utility | The e-cargo or utility e-bikes are designed to carry various types of cargo and packages for shorter distances such as within urban areas. These bikes are usually owned by local businesses and delivery partners to deliver packages and parcels at very low operational costs. |
| Lithium-ion Battery | A Li-ion battery is a rechargeable battery, which uses lithium and carbon as its constituent materials. The Li-Ion batteries have a higher density and lesser weight than sealed lead acid batteries and provide the rider with more range per charge than other types of batteries. |
| Lead Acid Battery | A lead acid battery refers to sealed lead acid battery having a very low energy-to-weight and energy-to-volume ratio. The battery can produce high surge currents, owing to its relatively high power-to-weight ratio as compared to other rechargeable batteries. |
| Other Batteries | This includes electric bikes using nickel–metal hydroxide (NiMH), silicon, and lithium-polymer batteries. |
| Business-to-Business (B2B) | The sales of e-bikes to business customers such as urban fleet and logistics company, rental/sharing operators, last-mile fleet operators, and corporate fleet operators are considered under this category. |
| Business-to-Customers (B2C) | The sales of electric scooters and motorcycles to direct consumers is considered under this category. The consumers acquire these vehicles either directly from manufacturers or from other distributers and dealers through online and offline channel. |
| Unorganized Local OEMs | These players are small local manufacturers and assemblers of e-bikes. Most of these manufacturers import the components from China and Taiwan and assemble them locally. They offer the product at low cost in this price sensitive market which give them advantage over organized manufacturers. |
| Battery-as-a-Service | A business model in which the battery of an EV can be rented from a service provider or swapped with another battery when it runs out of charge |
| Dockless e-Bikes | Electric bikes that have self-locking mechanisms and a GPS tracking facility with an average top speed of around 15mph. These are mainly used by bike-sharing companies such as Bird, Lime, and Spin. |
| Electric Vehicle | A vehicle which uses one or more electric motors for propulsion. Includes cars, scooters, buses, trucks, motorcycles, and boats. This term includes all-electric vehicles and hybrid electric vehicles |
| Plug-in EV | An electric vehicle that can be externally charged and generally includes all-electric vehicles as well as plug-in hybrids. In this report we use the term for all-electric vehicles to differentiate them from plug-in hybrid electric vehicles. |
| Lithium-Sulphur Battery | A rechargeable battery that replaces the liquid or polymer electrolyte found in current lithium-ion batteries with sulfur. They have more capacity than Li-ion batteries. |
| Micromobility | Micromobility is one of the many modes of transport involving very-light-duty vehicles to travel short distances. These means of transportation include bikes, e-scooters, e-bikes, mopeds, and scooters. Such vehicles are used on a sharing basis for covering short distances, usually five miles or less. |
| Low Speed Electric Vehicls (LSEVs) | They are low speed (usually less than 25 kmph) light vehicles that do not have an internal combustion engine, and solely use electric energy for propulsion. |


Research Methodology
Mordor Intelligence follows a four-step methodology in all its reports.
- Step-1: Identify Key Variables: To build a robust forecasting methodology, the variables and factors identified in Step-1 are tested against available historical market numbers. Through an iterative process, the variables required for market forecast are set and the model is built based on these variables.
- Step-2: Build a Market Model: Market-size estimations for the historical and forecast years have been provided in revenue and volume terms. Market revenue is calculated by multiplying the volume demand with volume-weighted average battery pack price (per kWh). Battery pack price estimation and forecast takes into account various factors affecting ASP, such as inflation rates, market demand shifts, production costs, technological developments, and consumer preferences, providing estimations for both historical data and future trends.
- Step-3: Validate and Finalize: In this important step, all market numbers, variables, and analyst calls are validated through an extensive network of primary research experts from the market studied. The respondents are selected across levels and functions to generate a holistic picture of the market studied.
- Step-4: Research Outputs: Syndicated Reports, Custom Consulting Assignments, Databases & Subscription Platforms


