Global Drug Abuse Testing Market Size and Share
Market Overview
| Study Period | 2020 - 2031 |
|---|---|
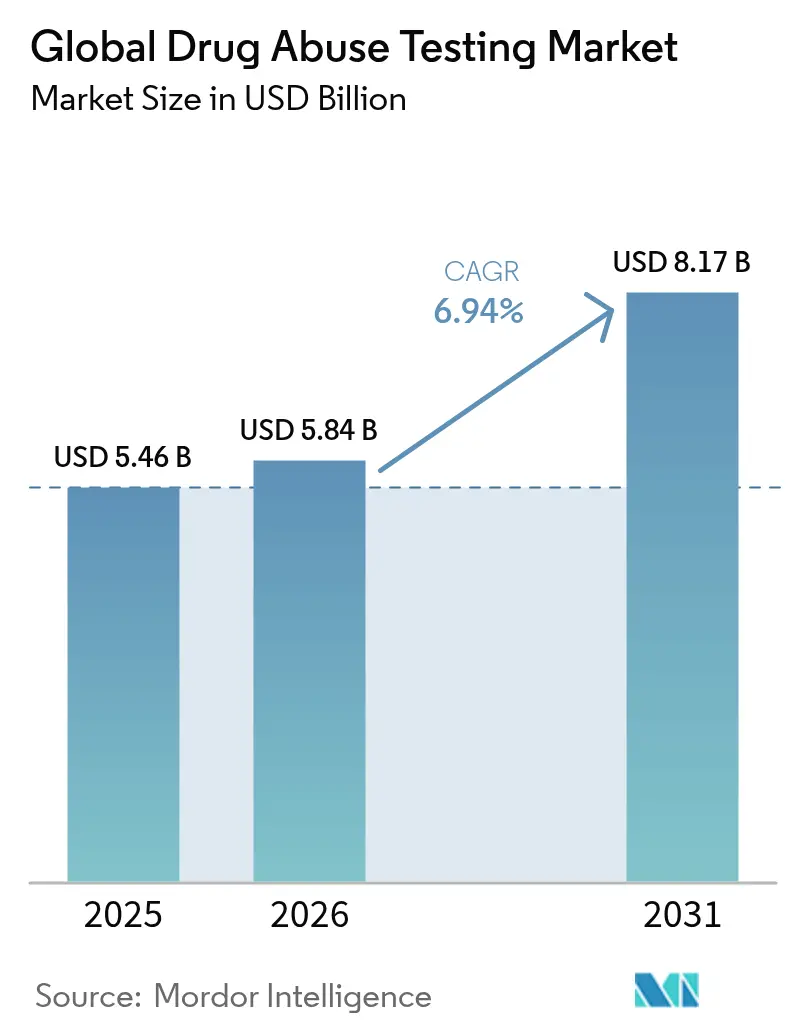
| Market Size (2026) | USD 5.84 Billion |
| Market Size (2031) | USD 8.17 Billion |
| Growth Rate (2026 - 2031) | 6.94% CAGR |
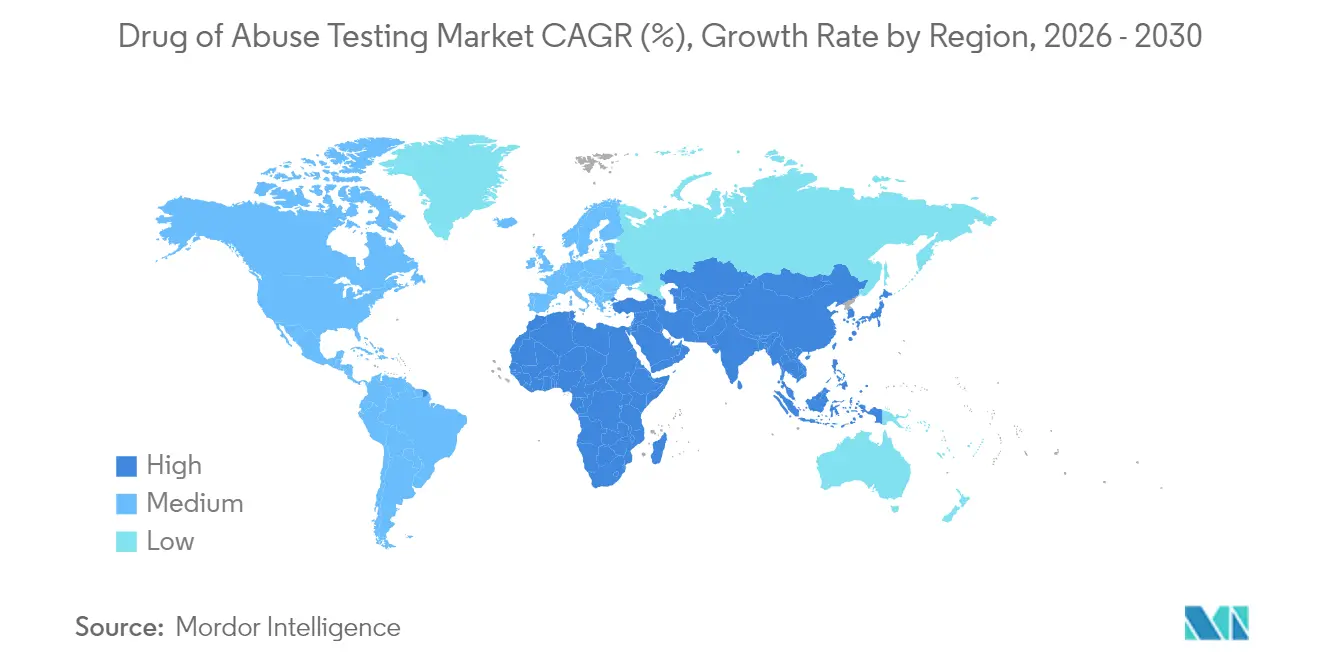
| Fastest Growing Market | Asia Pacific |
| Largest Market | North America |
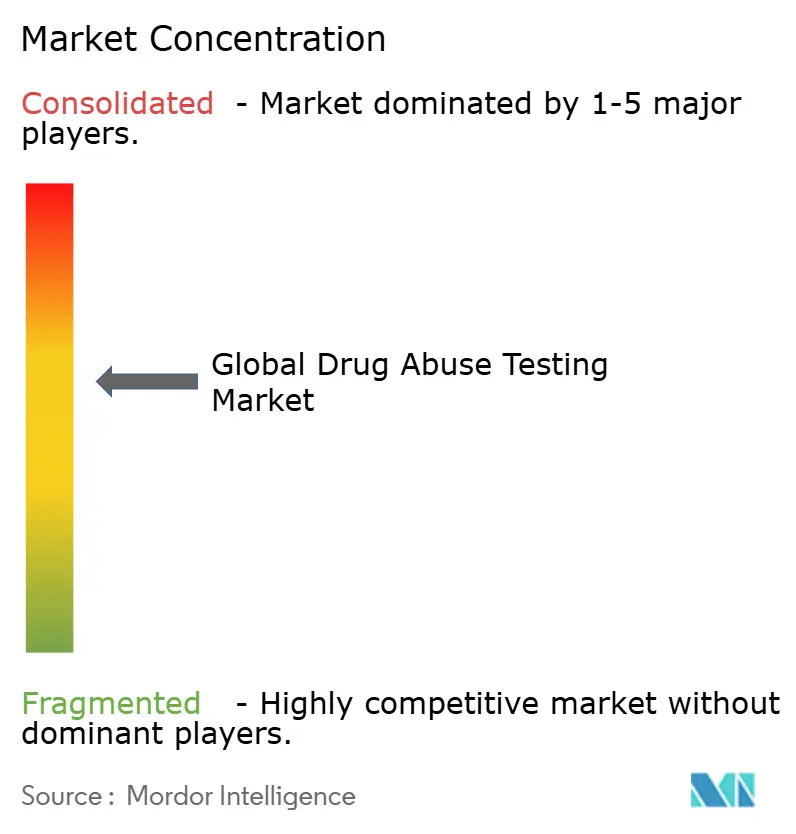
| Market Concentration | Medium |
Major Players *Disclaimer: Major Players sorted in no particular order Image © Mordor Intelligence. Reuse requires attribution under CC BY 4.0. | |
Global Drug Abuse Testing Market Analysis by Mordor Intelligence
The drugs of abuse testing market size was valued at USD 5.46 billion in 2025 and estimated to grow from USD 5.84 billion in 2026 to reach USD 8.17 billion by 2031, at a CAGR of 6.94% during the forecast period (2026-2031). Growth is underpinned by lasting regulatory support, broader test-panel mandates, and rapid uptake of point-of-care (PoC) technologies that shorten result turnaround and cut administrative bottlenecks. A decisive inflection came in December 2024 when the U.S. Department of Transportation (DOT) cleared oral fluid testing, widening adoption in safety-sensitive industries and enhancing privacy for donors [1]Source: U.S. Department of Transportation, “Part 40 Final Rule – DOT Summary of Changes,” transportation.gov . Simultaneously, the fentanyl crisis keeps expanding the federal testing scope, driving recurring consumable demand and specialized lab services [2]Source: Department of Health and Human Services, “Mandatory Guidelines for Federal Workplace Drug Testing Programs – Authorized Testing Panels,” federalregister.gov. Corporate policy shifts—such as the 9% of U.S. employers dropping marijuana screening to widen talent pools—introduce complexity and open new service niches for impairment-based analytics. Parallel progress in AI-enabled PoC analyzers and IoT-linked remote monitoring platforms is expanding the clinical utility of substance-use detection, especially in opioid treatment adherence programs.
Key Takeaways
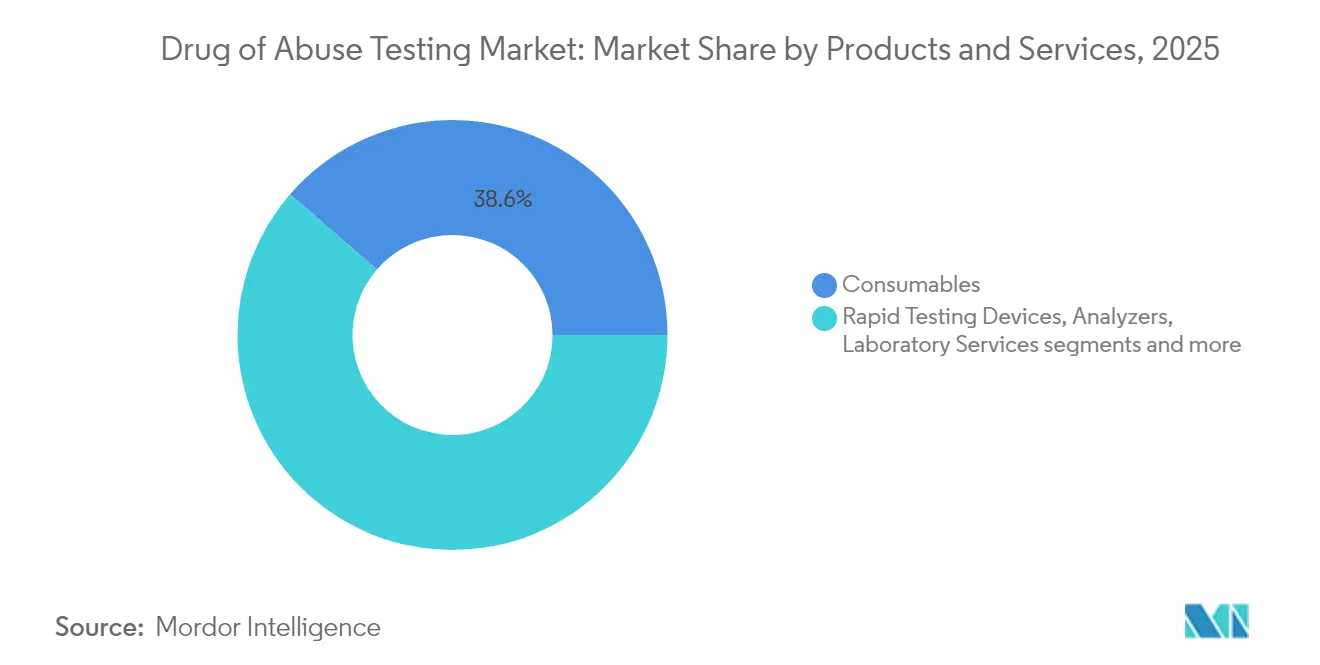
- By product & service, consumables held 38.63% revenue share of the drugs of abuse testing market in 2025, while laboratory services are forecast to expand at an 7.9% CAGR to 2031.
- By sample type, urine accounted for 41.71% of the drugs of abuse testing market share in 2025; oral fluid is projected to climb at an 8.74% CAGR through 2031.
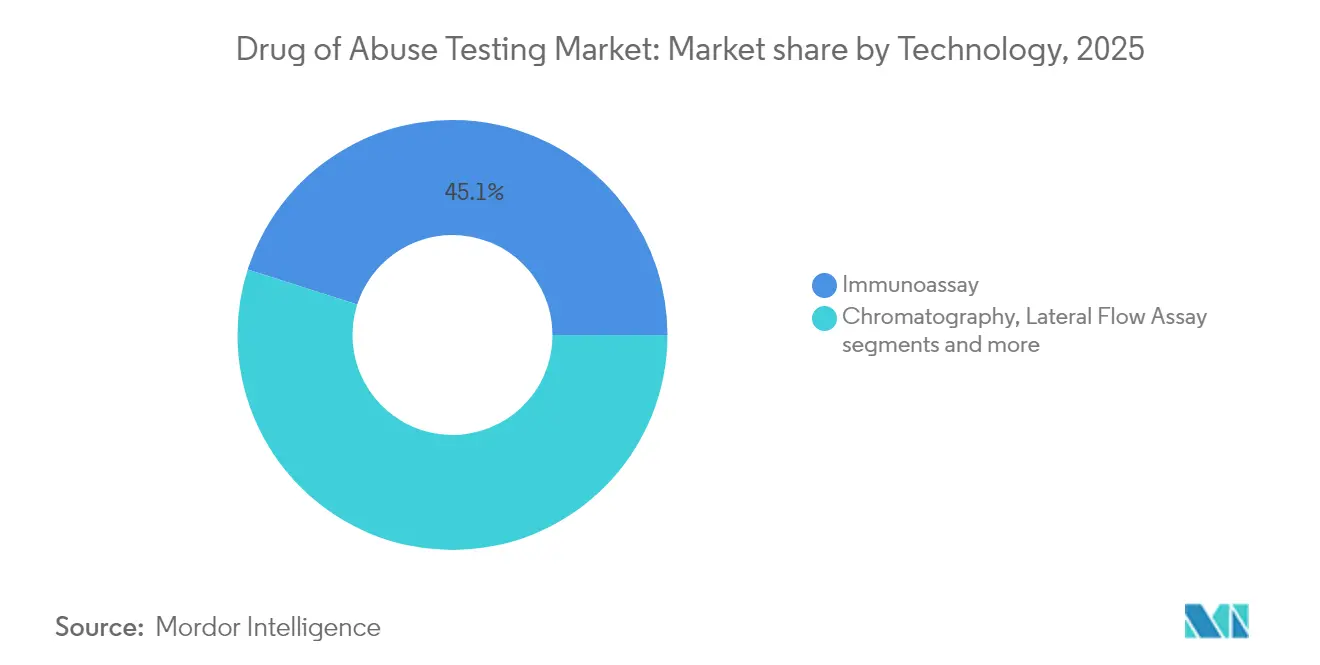
- By technology, immunoassay methods dominated with 45.08% revenue share in 2025, whereas lateral flow assays are advancing at a 8.84% CAGR to 2031.
- By end user, drug treatment centers captured 26.74% share in 2025; law-enforcement and criminal-justice settings are expanding at an 8.28% CAGR to 2031.
- By geography, North America led with 39.35% revenue in 2025, whereas Asia is expected to record a 9.09% CAGR between 2026 and 2031.
Note: Market size and forecast figures in this report are generated using Mordor Intelligence’s proprietary estimation framework, updated with the latest available data and insights as of 2026.
Global Drug Abuse Testing Market Trends and Insights
Drivers Impact Analysis*
| Driver | (~) % Impact on CAGR Forecast | Geographic Relevance | Impact Timeline |
|---|---|---|---|
| Rising drug & alcohol consumption globally | +1.20% | Global, highest impact in North America and Europe | Medium term (2-4 years) |
| Stringent workplace & traffic-safety regulations | +1.80% | North America & EU, expanding to Asia-Pacific | Long term (≥ 4 years) |
| Technological advances in rapid PoC immunoassays | +1.10% | Global, with early adoption in developed markets | Short term (≤ 2 years) |
| Expansion of forensic & clinical labs in emerging markets | +0.90% | Asia-Pacific, Latin America, Middle East & Africa | Long term (≥ 4 years) |
| Direct-to-consumer at-home test-kit boom | +0.70% | North America & Europe, expanding globally | Medium term (2-4 years) |
| AI/IoT-enabled remote sample verification for tele-opioid therapy | +0.40% | North America, with pilot programs in Europe | Medium term (2-4 years) |
| Source: Mordor Intelligence | |||
Stringent Workplace & Traffic-Safety Regulations
Federal and state agencies are sustaining higher random-testing thresholds, keeping the DOT random rate at 50% for 2025 despite escalating compliance costs. Electronic custody-and-control forms trim paperwork, lower administrative error, and speed up reporting, giving labs a cost-effective compliance edge. Post-accident rules now trigger defined windows for specimen collection, elevating demand for rapid PoC systems able to meet narrow turnaround targets. The December 2024 oral-fluid rule offers a privacy-friendly pathway that is poised to rebalance sample-type preferences toward saliva collection.
Technological Advances in Rapid PoC Immunoassays
Lateral-flow devices integrating AI image analysis now deliver near-laboratory sensitivity while keeping testing in non-clinical environments, driving a 9.01% CAGR for the sub-segment. Researchers at the University of Texas at Dallas produced a fentanyl detector with 98% accuracy, signaling a shift toward handheld solutions for frontline responders. Smartphone-linked saliva sensors transmit encrypted results to cloud dashboards, enabling real-time compliance checks for opioid therapy. AI-enhanced spectroscopy pushes detection thresholds down to 50 ppb for volatile compounds, widening breath-analysis utility beyond alcohol. Active-flow lateral-flow cassettes improve immune-complex incubation efficiency, narrowing result times to under 5 minutes for multi-panel tests.
Expansion of Forensic & Clinical Labs in Emerging Markets
Governments in Asia are accelerating accreditation reforms, attracting outsourced drug-testing work previously centered in the United States and Europe. SGS’s Shanghai site achieved an FDA inspection with zero observations, signaling global-grade quality that can lure multinational customers. Fiscal incentives under ‘Make in India’ and expanded production-linked schemes offset capital costs for new laboratory setups. Together, these factors enhance sample-processing capacity, reduce turnaround times, and anchor regional growth through 2030.
Direct-to-Consumer At-Home Test-Kit Boom
Parents and caregivers are early adopters, valuing privacy-preserving saliva or urine strips for adolescent monitoring. The U.S. FDA now evaluates home-use drug tests, improving labeling clarity and fostering consumer trust. COVID-19 normalized at-home diagnostics, creating behavioral spillover that accelerates online kit sales and recurring reagent revenue. Integration with telemedicine apps converts a one-off kit into a longitudinal monitoring solution where clinicians can track patterns and intervene sooner.
Restraints Impact Analysis*
| Restraint | % Impact on CAGR Forecast | Geographic Relevance | Impact Timeline |
|---|---|---|---|
| Privacy & ethical push-back on workplace testing | -0.80% | North America & Europe, with varying state-level impacts | Medium term (2-4 years) |
| High costs & confirmatory-test burden for false results | -0.60% | Global, with higher impact in cost-sensitive markets | Short term (≤ 2 years) |
| Cannabis legalization dampening demand in specific states | -0.40% | North America, particularly states with recreational legalization | Medium term (2-4 years) |
| Reagent supply-chain bottlenecks for antibodies & enzymes | -0.30% | Global, with acute impact in emerging markets | Short term (≤ 2 years) |
| Source: Mordor Intelligence | |||
Privacy & Ethical Push-Back on Workplace Testing
Twenty-four U.S. states plus Washington D.C. allow recreational cannabis, compelling employers to reconcile drug-free-workplace rules with off-duty usage rights. New York bars THC testing outside federally regulated occupations, and Illinois prohibits discipline solely on positive THC presence, shrinking the addressable urine-testing volume. Advocacy groups argue that legacy immunoassays often detect inactive metabolites, prompting a pivot toward impairment-focused devices that gauge cognitive or motor function in near-real time. Employers must overhaul policies, invest in supervisor training, and absorb potential legal exposure during the transition, damping short-term market growth.
High Costs & Confirmatory-Test Burden for False Results
PAMA cuts to U.S. Medicare lab reimbursements reduce margins on high-volume screenings, pressing providers to deliver the same quality at lower price points. False positives are escalating: 6,000 urine samples were labeled substituted in 2023, the highest cheating rate on record. Confirmatory LC-MS/MS tests cost multiples more than initial screens, and new FDA oversight on laboratory-developed tests adds validation and documentation overhead. Reagent supply fluctuations, notably for specialty antibodies, introduce price spikes that complicate lab budgeting. Collectively, these factors raise total cost of ownership and may deter smaller employers from broad testing programs.
*Our forecasts treat driver/restraint impacts as directional, not additive. The impact forecasts reflect baseline growth, mix effects, and variable interactions.
Segment Analysis
By Product & Service: Laboratory Services Drive Growth
Laboratory services posted the fastest 7.9% CAGR outlook to 2031 as enterprises outsource complex confirmatory tasks that require mass-spectrometry and regulatory accreditation. Consumables retained 38.63% revenue in 2025, reflecting recurring panel-test volumes under expanded fentanyl and norfentanyl requirements.
The consumables engine remains powerful: each regulatory panel inclusion queues sustained orders for reagents, calibrators, and quality-control materials. Rapid test devices now include AI-guided strip readers that upload timestamped images for audit trails, bolstering employer defensibility. Analyzers are scaling throughput: Thermo Fisher’s Stellar MS targets toxicology labs needing sub-minute full-scan runs, enhancing productivity per square foot. With sample numbers rising, the drugs of abuse testing market size attributable to outsourced services is projected to expand steadily, deepening vendor-client lock-in through integrated data-management portals.


By Sample Type: Oral Fluid Innovation Challenges Urine Dominance
Urine testing retained 41.71% of the drugs of abuse testing market share in 2025 thanks to entrenched lab protocols and broad legal acceptance. Nevertheless, saliva collections are slated for an 8.74% CAGR through 2031 after DOT endorsement narrowed privacy objections and shortened detection windows to within 2 days post-use. Automated LC-MS/MS assays now quantify 37 compounds in oral fluids with precision down to 1 ng/mL, meeting forensic evidentiary standards.
Hair testing continues serving 90-day lookback needs but faces budget constraints, making it a niche revenue contributor. Sweat sensing enters pilot stage via wearable patches that transmit cumulative exposure data to clinicians, though commercialization timelines remain uncertain. Breath analyzers, propelled by sub-ppm methanol sensors, preview expanded drug panels beyond alcohol. Market evolution demonstrates clear user preference for less-intrusive sampling modalities, setting a gradual but sustained shift away from traditional urine dominance.
By Technology: Lateral Flow Assays Disrupt Traditional Methods
Immunoassays commanded 45.08% revenue in 2025, underlining their cost-efficient screening capacity. Yet lateral-flow formats are rising fastest at a 8.84% CAGR, thanks to plasmonic-enhanced gold nanoparticles that lift sensitivity nearer to chromatographic confirmatory thresholds. Chromatography and mass spectrometry remain indispensable for confirmatory analytics, but vendors like Bruker are reducing complexity with DART kits that bypass chromatography for high-throughput tox workflows.
Spectroscopy, particularly Raman and FT-IR paired with AI classifiers, offers untargeted substance screening for field law-enforcement units. Paper-spray ionization mass spectrometry compresses sample-prep steps, enabling roadside officers to generate legally defensible evidence within minutes. Together, these advances enlarge the drugs of abuse testing market size captured by portable, rapid-response technology suites, while still funneling high-risk positives into laboratory best-practice pipelines.
By End User: Law Enforcement Expansion Accelerates
Drug treatment centers held the biggest slice at 26.74% in 2025 as overdose-mitigation funding supported routine monitoring across care pathways. Law-enforcement agencies show the sharpest acceleration at 8.28% CAGR as roadside saliva analyzers and courtroom-accepted PoC devices transition from pilots to statewide rollouts. Hospitals are embedding AI triage tools that flagged opioid-use disorder and cut 30-day readmissions by 47%, illustrating clinical ROI for automated screening.
Employers remain a core customer base, but policy relaxation on marijuana sparks reevaluation of test menus toward impairment checks rather than metabolite presence. Educational institutions adopt saliva test kiosks amid rising adolescent vaping incidents, though volumes are modest relative to workplace demand. Home users, enabled by e-commerce and subscription reagent packs, represent a small yet high-growth niche aligned with the direct-to-consumer boom.
Geography Analysis
North America continued to supply 39.35% of 2025 revenue for the drugs of abuse testing market, sustained by DOT mandates, insurance payer policies, and the region’s dense network of CLIA-certified labs. Employer compliance culture reinforces multi-panel testing, keeping per-employee screening budgets intact even as some companies modify marijuana panels. Federal encouragement of oral-fluid adoption is likely to reduce logistical cost per test, reinforcing U.S. leadership while opening slots for local device vendors. Canada follows a parallel trajectory under federal impairment rules for cannabis, promoting pilot deployments of roadside oral-fluid readers.
Europe enjoys harmonized workplace safety frameworks, but legal fragmentation over recreational cannabis creates varying test-demand intensity among member states. The European drugs of abuse testing market size is predicted to grow steadily on the back of traffic-safety programs and university campus pilots that deter psychoactive-substance use during academic activities who.int. Funding from Horizon-Europe fosters R&D partnerships that accelerate non-invasive biosensor platforms, giving regional SMEs export opportunities.
Asia-Pacific logs the quickest 9.09% CAGR as governments scale clinical-laboratory infrastructure and pharmaceutical outsourcing shifts away from Chinese suppliers under the U.S. Biosecure Act. India leverages PLI incentives to build toxicology capacities that attract multinational sponsors, while Japan pursues zero-tolerance traffic enforcement, expanding demand for roadside saliva units. China’s first third-party lab with FDA clearance showcases maturing quality levels and positions the country as a future exporter of test reagents. Southeast Asian nations invest in port-of-entry narcotics screening, broadening customs agency orders.
Latin America’s momentum stems from expanded forensic budgets in Brazil and Mexico, yet supply-chain volatility and budget cycles inject periodic uncertainty. Middle East and Africa progress unevenly: GCC health ministries actively deploy urine and saliva checkpoints at worksites linked to large infrastructure projects, whereas low-income nations rely on donor-funded pilot programs. Nonetheless, regional digital-health strategies that integrate tele-opioid therapy open future lanes for AI-assisted remote testing.

Competitive Landscape
The drugs of abuse testing market is moderately fragmented: global diagnostics networks coexist with niche technology specialist firms. Eurofins operates 900 laboratories worldwide, supporting cross-border data harmonization for multinational clients, an advantage in pre-employment screening of distributed workforces. LabCorp, Abbott, and Thermo Fisher round out the top tier, each embedding AI analytics and secure cloud portals to lock in enterprise accounts.
Specialists such as Psychemedics dominate discrete modalities: through patented hair-analysis platforms resilient to substitution attempts. Technology challengers emerge from academia-to-startup pipelines: Intelligent Bio’s fingerprint analyzer seeks FDA clearance, potentially opening a non-invasive category adjacent to saliva and sweat. Wearable device firms collaborate with treatment centers to commercialize continuous sweat or interstitial-fluid monitoring patches.
Strategic moves shape competitive trajectories. Bruker’s June 2025 launch of ClinDART kits reduces sample-prep requirements for high-throughput labs, giving customers chromatography-free workflows that lower cost per test. Thermo Fisher deploys the Stellar MS for toxicology labs that require sub-minute scan times, emphasizing speed as a differentiator. Partnerships between lab networks and tele-health platforms are proliferating: Quest’s remote specimen pickup plus electronic chain-of-custody forms compress turnaround, while startups provide AI dashboards that integrate lab results into patient engagement tools.
Global Drug Abuse Testing Industry Leaders
Danaher Corporation (Beckman Coulter, Inc.)
Quest Diagnostics Inc.
LabCorp
Drägerwerk AG & Co. KGaA
Abbott Laboratories
- *Disclaimer: Major Players sorted in no particular order

Recent Industry Developments
- June 2025: Bruker Corporation unveiled strategic innovations at ASMS 2025, showcasing DART technology advances for therapeutic drug monitoring and drugs-of-abuse analysis.
- November 2024: Intelligent Bio prepared for FDA review of its fingerprint-based drug detection device.


Research Methodology Framework and Report Scope
Market Definitions and Key Coverage
Our study frames the drugs of abuse testing market as all in-vitro diagnostic products, point-of-care devices, and associated consumables used to qualitatively or quantitatively detect illicit or controlled substances (cannabis, cocaine, opioids, amphetamines, synthetic drugs, alcohol surrogates) in human urine, saliva, blood, hair, sweat, or breath across clinical, workplace, law-enforcement, and at-home settings.
Scope exclusion: The model omits laboratory toxicology performed for therapeutic drug monitoring, pharmacovigilance, and research-only reagents.
Segmentation Overview
- By Product & Service
- Rapid Testing Devices
- Urine Testing Devices
- Oral Fluid Testing Devices
- Analyzers
- Consumables
- Laboratory Services
- By Sample Type
- Urine
- Oral Fluid (Saliva)
- Hair
- Breath
- Blood
- Sweat
- By Technology
- Immunoassay
- Chromatography
- Spectroscopy
- Lateral Flow Assay
- By End User
- Workplaces & Schools
- Law-Enforcement & Criminal Justice
- Hospitals & Clinics
- Drug Treatment Centers
- At-Home & Personal Users
- By Geography
- North America
- United States
- Canada
- Mexico
- Europe
- Germany
- United Kingdom
- France
- Italy
- Spain
- Rest of Europe
- Asia-Pacific
- China
- Japan
- India
- South Korea
- Australia
- Rest of Asia Pacific
- South America
- Brazil
- Argentina
- Rest of South America
- Middle East and Africa
- GCC Countries
- South Africa
- Rest of Middle East and Africa
- North America
Detailed Research Methodology and Data Validation
Desk Research
We began by mining open datasets from agencies such as SAMHSA, the U.S. Department of Transportation, UNODC, Eurostat, and the Australian Institute of Health and Welfare, which track prevalence, test-panel mandates, and accident statistics. Trade associations (e.g., the American Clinical Laboratory Association, the International Federation of Clinical Chemistry) and customs shipment dashboards offered volume indicators for rapid test kits. Company 10-Ks, FDA 510(k) clearances, and patent counts gathered through Questel enriched product pipelines, while news flows from Dow Jones Factiva helped us gauge pricing shifts during supply squeezes.
Additional context came from CLIA laboratory accreditation data, tender portals such as Tenders Info, and import records on Volza that clarify cross-border movement of lateral-flow cassettes. The sources cited illustrate, but do not exhaust, the wider desk research pool used for data capture and sense-checking.
Primary Research
Mordor analysts interviewed laboratory directors, occupational-health physicians, test-kit distributors, and probation officers spanning North America, Europe, Asia-Pacific, and the GCC. These conversations validated average selling prices, oral-fluid adoption curves after the 2024 DOT rule, and region-specific testing frequencies, which in turn anchored the desk-derived volume assumptions.
Market-Sizing & Forecasting
A top-down demand pool was built from the number of mandated and voluntary tests by setting, calibrated with positivity rates and retest ratios. Supplier roll-ups for immunoassay strips and selected channel checks served as bottom-up proxies to stress-test totals. Key variables include: 1) workplace testing penetration, 2) opioid overdose incidence, 3) average reimbursement per lab screen, 4) rapid device share of total tests, and 5) regulatory panel expansions that add fentanyl and novel psychoactive substances. Forecasts leverage multivariate regression blended with ARIMA smoothing; coefficient ranges were reviewed with primary experts before lock-in. Data gaps, such as private lab volumes, were bridged by weighting regional courier sample traffic against accreditation counts.
Data Validation & Update Cycle
Outputs pass a two-layer analyst review, anomaly flags trigger re-contact of sources, and models are refreshed annually, with interim tweaks after material events like a new test-panel mandate. Clients therefore receive a live baseline each time our report is downloaded.
Why Mordor's Drug Abuse Testing Baseline Commands Reliability
Published numbers differ because firms pick unequal scopes, pricing anchors, and refresh cadences.
Key gap drivers include whether alcohol breath analyzers and outsourced laboratory services are bundled, how at-home kit revenues are treated, and the degree of primary validation behind supplier roll-ups.
Mordor's disciplined scope, core diagnostic products only, and its mixed-method model reduce double counting and inflation from ancillary services.
Benchmark comparison
| Market Size | Anonymized source | Primary gap driver |
|---|---|---|
| USD 5.46 B (2024) | Mordor Intelligence | - |
| USD 13.95 B (2024) | Regional Consultancy A | Adds alcohol analyzers and full laboratory service revenues; limited primary cross-checks |
| USD 13.91 B (2024) | Global Consultancy B | Vendor revenue roll-ups without removing self-testing kit duplication; includes roadside devices |
The comparison shows that, by anchoring scope to test-kit and analyzer sales only and by re-validating with on-ground experts, our baseline offers decision-makers a transparent, reproducible yardstick they can trust.


Key Questions Answered in the Report
What is the current size of the drugs of abuse testing market?
The market generated USD 5.46 billion in 2025 and is projected to reach USD 8.17 billion by 2031 at a 6.94% CAGR.
Which region leads revenue, and which grows fastest?
North America contributes 39.35% of 2025 revenue, while Asia-Pacific is expected to post the highest regional CAGR of 9.09% through 2031.
Why is oral-fluid testing gaining traction?
December 2024 DOT rules approved saliva specimens for federal testing, easing privacy concerns and enabling detection within 24–48 hours of use.
Which technology segment is expanding the quickest?
Lateral flow assays integrating AI image analysis exhibit a 8.84% CAGR, driven by demand for rapid point-of-care screening.
What is the main restraint on market growth?
Rising confirmatory-test costs and ethical debates over workplace screening create budgetary and legal hurdles that temper near-term adoption.
Page last updated on:


