Drone Data Services Market Size and Share
Market Overview
| Study Period | 2020 - 2031 |
|---|---|
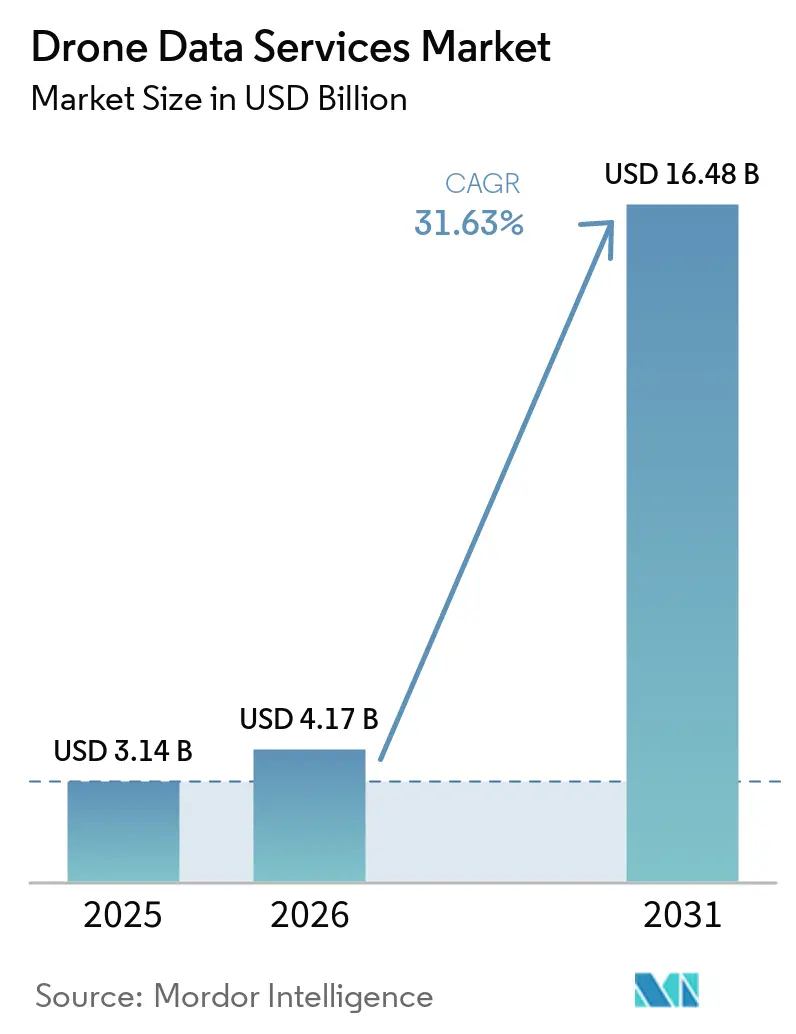
| Market Size (2026) | USD 4.17 Billion |
| Market Size (2031) | USD 16.48 Billion |
| Growth Rate (2026 - 2031) | 31.63% CAGR |
| Fastest Growing Market | Asia-Pacific |
| Largest Market | North America |
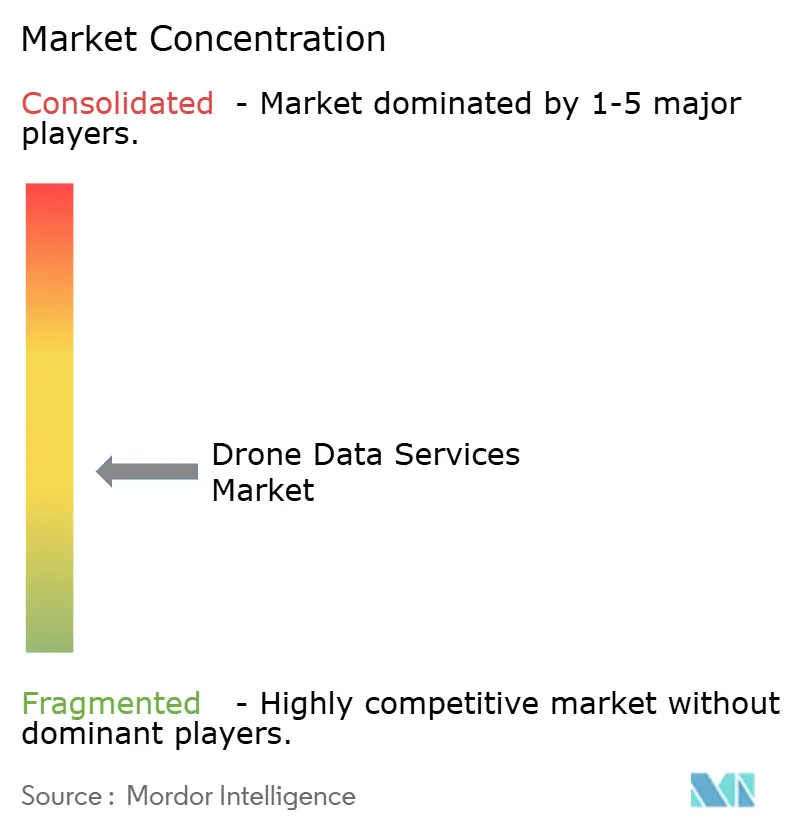
| Market Concentration | Medium |
Major Players *Disclaimer: Major Players sorted in no particular order Image © Mordor Intelligence. Reuse requires attribution under CC BY 4.0. | |
Drone Data Services Market Analysis by Mordor Intelligence
The drone data services market size is expected to be USD 3.14 billion in 2025, USD 4.17 billion in 2026, and reach USD 16.48 billion by 2031, growing at a CAGR of 31.63% from 2026 to 2031. A confluence of liberalized beyond-visual-line-of-sight rules, falling LiDAR and photogrammetry costs, and escalating enterprise demand for real-time spatial intelligence is accelerating adoption across construction, energy, agriculture, and logistics. Cloud-native processing shortens survey-to-insight cycles from days to hours, while edge AI places anomaly detection directly on the aircraft, trimming latency to milliseconds in precision spraying and emergency response scenarios. Multirotor platforms dominate confined-site work, yet hybrid VTOL systems are closing the gap by pairing fixed-wing endurance with rotorcraft precision for corridor mapping. Competitive intensity remains high because no vendor holds more than 8% of global revenue, prompting hardware makers, software publishers, and vertically integrated service firms to race to develop differentiated AI analytics and digital twin integration capabilities.
Key Report Takeaways
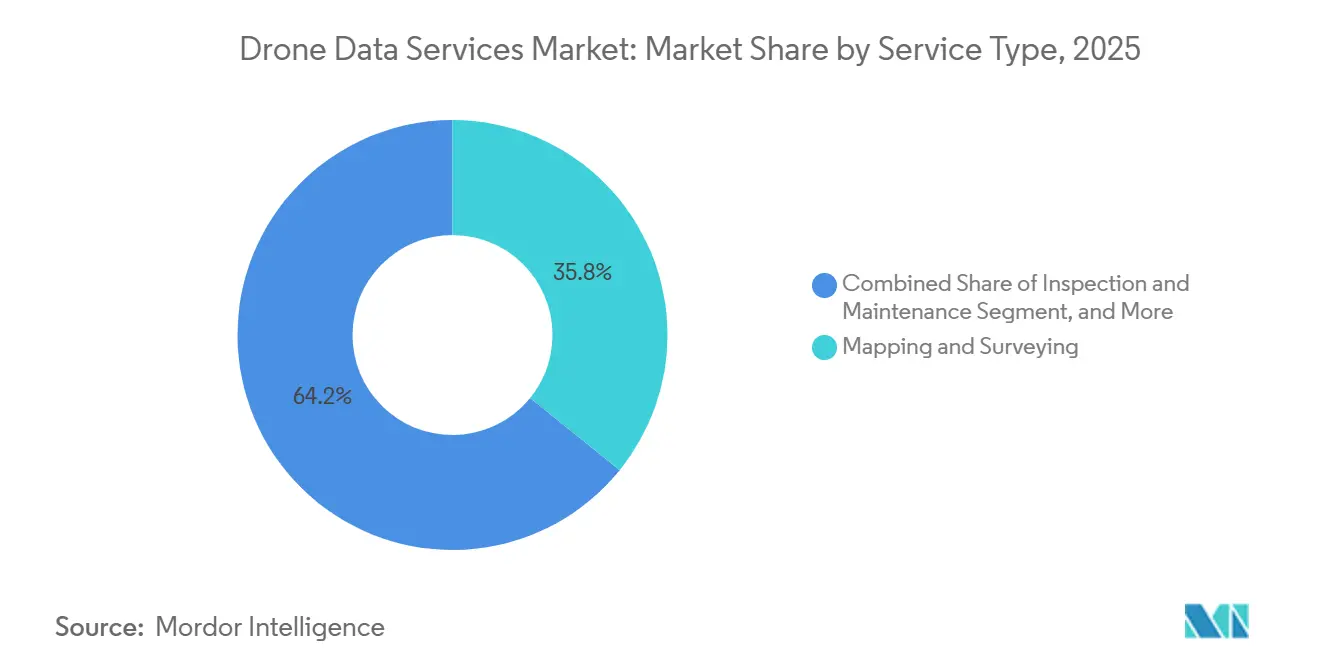
- By service type, mapping and surveying led with 38.21% revenue share in 2025, while delivery and logistics data services are projected to expand at a 32.63% CAGR through 2031.
- By platform type, multirotor UAVs captured 61.72% of the 2025 drone data services market share, whereas hybrid VTOL UAVs are set to register a 32.43% CAGR to 2031.
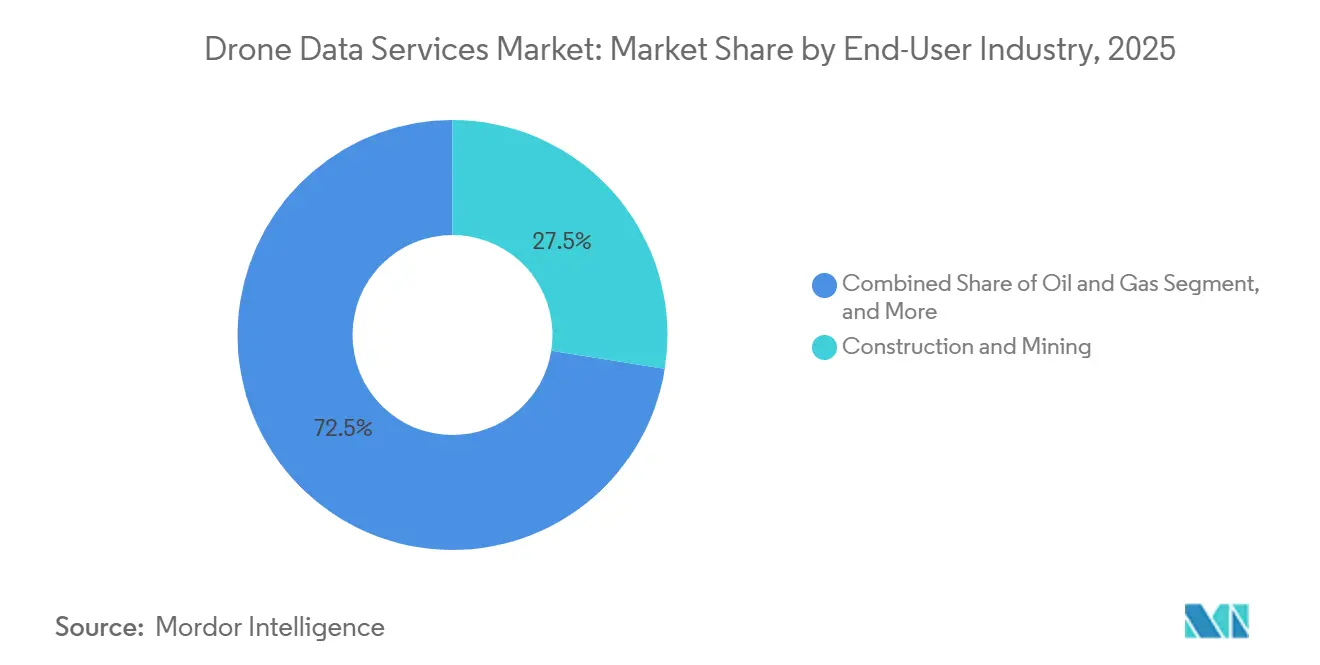
- By end-user industry, construction and mining accounted for 27.51% of the 2025 drone data services market size, yet oil and gas is forecast to grow fastest at a 33.23% CAGR between 2026 and 2031.
- By deployment model, cloud implementations represented 69.73% of 2025 revenue, while hybrid architectures will post a 33.23% CAGR over 2026-2031.
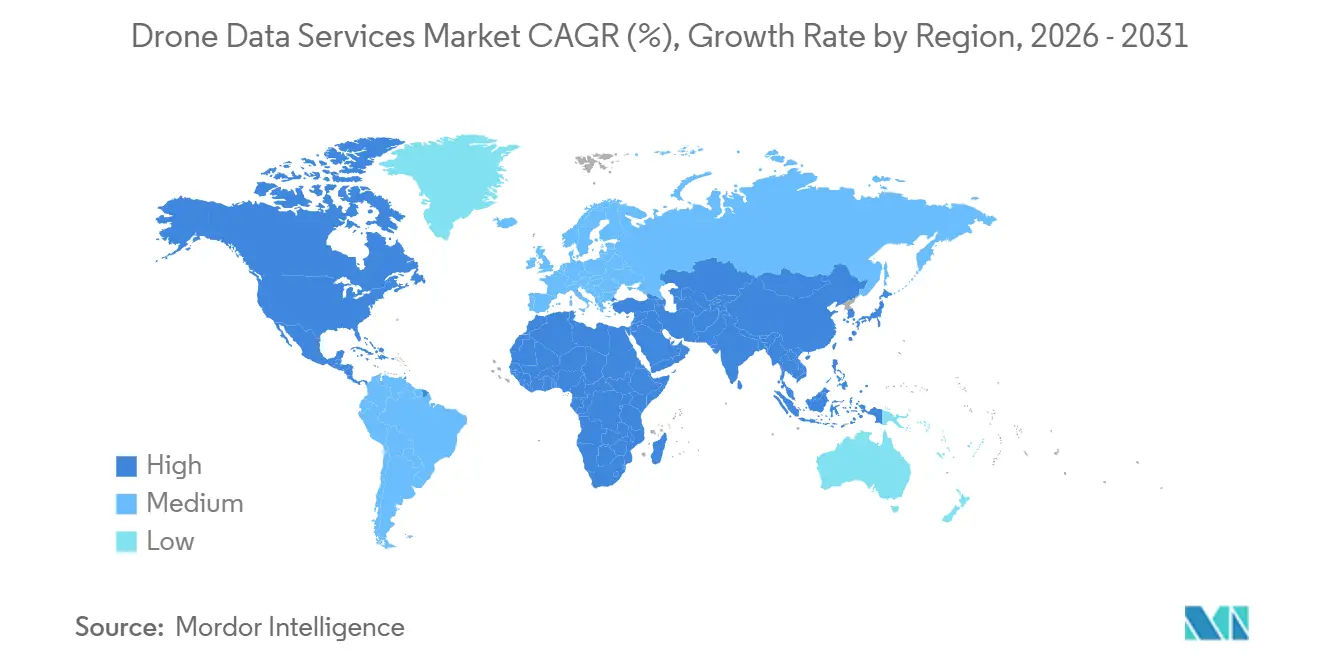
- By geography, North America held 41.48% market share in 2025, but Asia-Pacific is anticipated to expand at a 32.63% CAGR through 2031.
Note: Market size and forecast figures in this report are generated using Mordor Intelligence’s proprietary estimation framework, updated with the latest available data and insights as of January 2026.
Global Drone Data Services Market Trends and Insights
Drivers Impact Analysis*
| Driver | (~) % Impact on CAGR Forecast | Geographic Relevance | Impact Timeline |
|---|---|---|---|
| Favorable BVLOS Regulations in Key Markets | +7.2% | North America, Europe, Asia-Pacific core | Medium term (2-4 years) |
| Rapid Cost Decline in LiDAR and Photogrammetry Sensors | +6.8% | Global | Short term (≤ 2 years) |
| Rising Demand for Real-Time Asset Inspection in Energy and Utilities | +5.9% | North America, Europe, Middle East | Medium term (2-4 years) |
| Growth of Digital Twins in Brownfield Industrial Sites | +4.7% | Global, concentrated in North America and Europe | Long term (≥ 4 years) |
| Integration of Drone Data with Carbon-Credit MRV Platforms | +3.4% | Global, early adoption in North America and South America | Long term (≥ 4 years) |
| Edge-AI-Powered Precision Spraying Data Feedback Loops | +3.3% | North America, Europe, Asia-Pacific agricultural regions | Medium term (2-4 years) |
| Source: Mordor Intelligence | |||
Favorable BVLOS Regulations in Key Markets
Beyond-visual-line-of-sight allowances eliminate the need for on-site observers, cutting per-acre inspection costs by 40-60% for corridor mapping and crop monitoring. The United States Part 108 proposal, published in 2025, established performance-based criteria that allow certified operators to fly missions exceeding 50 kilometers without individual waivers. Europe’s U-Space construct, effective January 2025, enables automated flight planning once electronic identification and geofencing safeguards are in place. Early regulatory clarity in these regions accelerates scale for energy and construction clients, while patchier implementation in parts of Asia delays similar benefits outside China and India.
Rapid Cost Decline in LiDAR and Photogrammetry Sensors
LiDAR modules priced below USD 20,000 now match the vertical accuracy once reserved for six-figure airborne systems, enabling mid-tier contractors to bid competitively on topographic projects. DJI’s L3 unit undercut earlier Velodyne offerings by 60%, bringing three-centimeter precision within reach for survey firms and utilities. Parallel drops in 42-megapixel RGB payload prices are widening access to high-resolution photogrammetry, shifting competitive advantage firmly from hardware ownership toward cloud-based analytics that automatically surface anomalies in orthomosaics.
Rising Demand for Real-Time Asset Inspection in Energy and Utilities
Wind-turbine fleets, solar arrays, and transmission corridors are increasingly subject to stricter uptime mandates as the reliance on renewable energy sources grows and a consistent energy supply is needed. Advanced deployments, such as the USD 250 million State Grid contract in China, leverage cutting-edge technologies, including thermal imaging and LiDAR sensors, to detect fault signatures early, significantly reducing the risk of outages. These measures have successfully lowered unplanned downtime by 22%, showcasing the effectiveness of predictive maintenance strategies. Additionally, automated inspection systems have demonstrated remarkable efficiency improvements, reducing individual turbine downtime from 8 hours to just 45 minutes in pilot programs conducted across North America. This reduction in downtime has resulted in substantial cost savings for operators, preventing millions of dollars in lost energy production and enhancing overall operational reliability.
Growth of Digital Twins in Brownfield Industrial Sites
Brownfield facilities often lack current as-built data, which poses significant challenges for retrofitting and maintenance. To address this, drone-generated point clouds are increasingly used to feed digital twin platforms. These platforms help identify potential clashes during retrofits, reducing rework by up to 40% at refineries and petrochemical plants.[1]Shell Technical Team, “Pernis Refinery Digital Twin Integration,” Shell.com Additionally, frequent resurvey cycles, often conducted within 24 hours, ensure the digital twin remains accurately aligned with real-time field conditions. This alignment not only streamlines maintenance planning but also enhances the accuracy and reliability of safety-case documentation, ultimately improving operational efficiency and safety standards.
Restraints Impact Analysis*
| Restraint | (~) % Impact on CAGR Forecast | Geographic Relevance | Impact Timeline |
|---|---|---|---|
| Fragmented Global Airspace Management Standards | -3.8% | Global, acute in Asia-Pacific and Middle East | Medium term (2-4 years) |
| Data-Privacy and Cybersecurity Concerns Among Enterprises | -2.9% | Europe, North America | Short term (≤ 2 years) |
| Shortage of Certified Drone-Data Analysts | -2.4% | Global | Medium term (2-4 years) |
| Volatility in Cloud-Processing Costs for High-Resolution Imagery | -1.7% | Global | Short term (≤ 2 years) |
| Source: Mordor Intelligence | |||
Fragmented Global Airspace Management Standards
Operators managing compliance across 193 regulatory regimes face significant challenges, as they must localize operational aspects such as manuals, insurance policies, and fleet telemetry systems. These requirements increase compliance costs by 25-40% and can extend launch timelines by up to 18 months. The International Civil Aviation Organization (ICAO) provides only general guidance, resulting in significant variations in approval processes across countries. For instance, Pakistan continues to prohibit Beyond Visual Line of Sight (BVLOS) flights, while India is actively expanding its digital-sky corridors to accommodate such operations. This regulatory complexity creates an environment that favors large service providers with strong regional presence, as they are better equipped to navigate these challenges.[2]Directorate General of Civil Aviation India, “Drone Registration and Pilot Statistics,” Dgca.gov.in However, it also slows the progress of multi-country corridor projects, further delaying the implementation of cross-border drone operations.
Data-Privacy and Cybersecurity Concerns Among Enterprises
High-resolution imagery often captures personally identifiable information, such as faces and license plates, or proprietary plant layouts, raising privacy and security concerns. To comply with European GDPR regulations, operators are required to anonymize such data by blurring faces and license plates. This process adds a processing overhead of USD 0.30 per image and can delay deliverables by several days, impacting project timelines. Additionally, the increasing frequency of telemetry-link spoofing incidents has raised significant concerns among insurers. As a result, many insurers have excluded cyber liability coverage from standard drone insurance policies. This exclusion forces operators to purchase separate cyber liability coverage, often at a high cost, with premiums that can reach up to 12% of their annual revenue, further straining operational budgets.
*Our forecasts treat driver/restraint impacts as directional, not additive. The impact forecasts reflect baseline growth, mix effects, and variable interactions.
Segment Analysis
By Service Type: Logistics Data Extends Value Chains
Mapping and surveying produced 38.21% of 2025 revenue, demonstrating that the drone data services market remains rooted in core geospatial deliverables. However, delivery and logistics data services will expand at a 32.63% CAGR, driven by live telemetry that feeds route-optimization engines and proof-of-delivery systems. Alphabet’s Wing reported 350,000 completed drops by late-2025, capturing precise GPS coordinates and weight variance data that refine predictive ETAs within 90 seconds of actual arrival. Environmental monitoring applications support carbon-credit MRV workflows, where platforms such as Pachama verified 18 million metric tons of CO₂ in 2025, underscoring cross-industry appetite for automated validation tools.
In the second half of the decade, inspection and maintenance services will deepen revenue diversity as utilities and manufacturing clients outsource flight operations, point-cloud processing, and defect classification. Skyspecs alone processed 2.4 million wind-blade images in 2025, achieving 94% detection accuracy and reducing false positives by 40%. As pricing for USD 20,000 LiDAR systems compresses further, photogrammetry and 3D modeling workflows become accessible to mid-size contractors, pushing the drone data services market for these deliverables higher, even without headline-grabbing growth rates.


By Platform Type: Hybrid VTOL Narrows Mission Gaps
Multirotor craft held 61.72% of the 2025 drone data services market share thanks to their vertical takeoff and landing capability in tight urban or industrial areas. Yet battery limits cap flight times under 35 minutes, constraining corridor projects. Hybrid VTOL systems such as Quantum-Systems’ Trinity F90+ can cover 400 hectares per sortie and still land inside a four-square-meter clearing, contributing to a 32.43% CAGR over the forecast horizon. Fixed-wing platforms maintain their niche in wide-area agriculture and cadastral work, while sub-250-gram nano craft continue to capitalize on lenient registration rules for real estate and insurance roof surveys.
As propulsion efficiencies improve and approach 250 watt-hours per kilogram, the latest hybrid airframes can cruise at 70 kilometers per hour for up to 2 hours. Additionally, these airframes can transition seamlessly to rotor hover, enabling precise data collection in targeted areas. This combination of extended endurance and precision targeting makes these hybrid models particularly well-suited for applications such as monitoring railways, pipelines, and power-line corridors. Previously, these tasks relied on more expensive manned aircraft or required coordinating multiple drones to cover the same areas. The adoption of these advanced hybrid airframes is driving significant growth and innovation in the drone data services market, as they offer a cost-effective, efficient solution for industries that require detailed, reliable data collection.
By End-User Industry: Oil and Gas Accelerates Digital Adoption
Construction and mining clients accounted for 27.51% of 2025 demand, led by stockpile volume monitoring and BIM alignment checks that reduced survey cycles from 3 days to 4 hours. Nevertheless, oil and gas operators will outpace all peers with a 33.23% CAGR, underpinned by methane-sensing payloads and digital-twin pipeline models that reduce inspection spend by 60% compared with helicopter patrols. Shell’s Pernis refinery melded drone point clouds with Siemens Xcelerator twins, extending turnaround intervals and deferring USD 120 million in capex.
Energy utilities remain significant adopters of real-time inspection technologies, leveraging these solutions to enhance operational efficiency and ensure system reliability. In the agriculture sector, the adoption of edge-based herbicide routing, exemplified by John Deere’s See and Spray technology, highlights the transformative potential of on-device inference. This technology enables precise herbicide application, reducing chemical use by up to 80% and promoting sustainable farming practices. Additionally, public-safety agencies, insurers, and logistics companies are increasingly driving demand for these technologies. Their interest stems from the need for time-sensitive insights that traditional surveying methods cannot deliver with the same level of cost efficiency or operational speed, making these advanced solutions indispensable across these industries.
By Deployment Model: Hybrid Architectures Balance Sovereignty and Scale
Cloud accounted for 69.73% of 2025 implementations, reflecting significant demand for elastic compute capabilities driven by photogrammetry workloads that rely heavily on GPUs. The drone data services market size for cloud workflows continues to grow steadily. However, hybrid models are expected to match that growth rate, with a compound annual growth rate (CAGR) of 33.23%, as industries operating under strict regulations increasingly prioritize local inference to meet compliance requirements. Edge servers play a crucial role in this setup by processing imagery directly in the field and subsequently synchronizing consolidated findings to cloud platforms such as AWS or Azure. This process utilizes optimized formats like Cloud Optimized GeoTIFF, which reduces bandwidth expenses by up to 60% for repeat site operations.
On-premises deployments remain prevalent in sectors such as defense and pharmaceuticals, where data exfiltration is a critical concern. However, the high costs of hardware and maintenance often discourage broader adoption of on-premises solutions. Hybrid architectures, which combine air-gapped processing with periodic cloud retraining, offer a balanced approach that addresses both latency and data sovereignty requirements. This makes hybrid models the most adaptable and practical architecture to meet the evolving demands of the drone data services market.
Geography Analysis
North America accounted for 41.48% of 2025 revenue in the drone data services market, driven by early FAA exemptions that reduced claim-cycle times by 40% in the insurance sector. These exemptions also facilitated 50-kilometer BVLOS (Beyond Visual Line of Sight) pipeline missions, eliminating the need for lengthy waiver processes. While growth is expected to moderate to the high twenties, primarily due to a slowdown in construction and utility build-outs, the market remains robust. Replacement demand for AI-ready payloads continues to sustain elevated spending levels, ensuring steady growth in the region's drone data services market.
Asia-Pacific is projected to achieve a compound annual growth rate (CAGR) of 32.63%, the highest among all regions. This growth is primarily driven by India’s SVAMITVA rural survey initiative, which aims to map rural land parcels using drones, and China’s large-scale power-line inspection contracts that leverage drone technology for efficient monitoring. In India, government policies, such as drone-friendly tax incentives, are fostering the industry's growth. Additionally, the growing number of certified drone pilots, which has reached nearly 40,000, is driving the expansion of local service providers, creating a robust ecosystem for drone operations in the region.[3]Press Information Bureau, “SVAMITVA Survey Milestones,” Pib.gov.in Japan’s aging population and disaster-preparedness priorities further extend runway for hybrid VTOL adoption under the newly inked ANA-Wingtra alliance.
Europe benefits significantly from the U-Space rollout, which aims to streamline drone operations across the region. However, variations in airspace classifications among member states compel operators to maintain parallel compliance channels, adding complexity to operations. In the Middle East and Africa, drones are increasingly used for solar park thermography and long-distance pipeline inspections, addressing critical infrastructure monitoring needs. Meanwhile, South America leverages drones equipped with multispectral analytics to optimize agricultural practices, particularly in sugarcane and soybean estates, where fertilizer usage has been reduced by up to 25%. These diverse regional priorities and applications collectively drive robust growth in the drone data services market across all inhabited continents, highlighting the sector's adaptability and potential for sustained expansion.

Competitive Landscape
The drone data services market remains fragmented, because the top five players together hold well below 40% global revenue. Terra Drone broadened its stack by launching Terra 3D-CAD software in February 2026 and listing on the Tokyo Stock Exchange to bankroll expansion into Southeast Asia and the Middle East.[4]Terra Drone Corporation, “Corporate Updates and Software Launches,” Terra-drone.net The firm then partnered with Unifly to weave detect-and-avoid functions into its fleet, aligning certifications with forthcoming FAA Part 108 mandates.
Hardware-software partnerships define many competitive moves. Wingtra’s memorandum with ANA Holdings gives the Swiss manufacturer preferential access to Japanese industrial clients and underpins plans for joint inspection services by 2027. Skyspecs, GeoCue, and Pix4D focus on analytics differentiation, with Skyspecs’ AI blade-erosion model achieving 94% accuracy and GeoCue’s USD 18,990 TV1 Lite LiDAR enabling contractors who previously rented airborne units at steep daily rates.
Emergent disruptors such as Pachama converge carbon-credit verification with drone and satellite imagery, tapping a voluntary carbon market approaching USD 2 billion in annual trades. Meanwhile, large cloud providers embed geospatial accelerators to shorten orthomosaic rendering times, pressuring pure-play photogrammetry vendors to add niche vertical analytics or risk commoditization. The race now tilts toward seamless edge-to-cloud AI pipelines and regulatory expertise that unlock nationwide BVLOS corridors.
Drone Data Services Industry Leaders
DroneDeploy, Inc.
Pix4D S.A.
Aerodyne Group Sdn Bhd
Terra Drone Corporation
Field Group
- *Disclaimer: Major Players sorted in no particular order

Recent Industry Developments
- March 2026: China’s State Grid awarded DJI a USD 250 million contract to inspect 1.2 million kilometers of transmission lines, integrating thermal imagery and LiDAR to cut outages by 22%.
- March 2026: Wingtra signed an MoU with ANA Holdings to launch commercial drone services in Japan by 2027, targeting inspection and disaster-response demand.
- February 2026: Terra Drone introduced Terra 3D-CAD software, shaving 60% off manual point-cloud modeling times for brownfield industrial assets.
- January 2026: Terra Drone partnered with Unifly to embed detect-and-avoid capabilities for FAA Part 108 compliance in U.S. BVLOS operations.


Global Drone Data Services Market Report Scope
The Drone Data Services Market is the global industry focused on the collection, processing, analysis, and delivery of data captured by unmanned aerial vehicles (UAVs), commonly known as drones. These services leverage advanced imaging technologies, sensors, and analytics platforms to provide actionable insights for commercial, industrial, and government applications.
The Drone Data Services Market Report is Segmented by Service Type (Mapping and Surveying, Inspection and Maintenance, Photogrammetry and 3D Modeling, Environmental Monitoring and Research, and Delivery and Logistics Data Services), Platform Type (Multirotor Unmanned Aerial Vehicle, Fixed-Wing Unmanned Aerial Vehicle, Hybrid VTOL Unmanned Aerial Vehicle, and Nano/Micro Unmanned Aerial Vehicle), End-User Industry (Agriculture, Energy and Utilities, Construction and Mining, Oil and Gas, Transport and Logistics, Public Safety and Emergency Services, Insurance, and Media and Entertainment), Deployment Model (Cloud, On-Premise, and Hybrid), and Geography (North America, South America, Europe, Asia-Pacific, and Middle East and Africa). The Market Forecasts are Provided in Terms of Value (USD).
| Mapping and Surveying |
| Inspection and Maintenance |
| Photogrammetry and 3D Modeling |
| Environmental Monitoring and Research |
| Delivery and Logistics Data Services |
| Multirotor Unmanned Aerial Vehicle |
| Fixed-Wing Unmanned Aerial Vehicle |
| Hybrid VTOL Unmanned Aerial Vehicle |
| Nano/Micro Unmanned Aerial Vehicle |
| Agriculture |
| Energy and Utilities |
| Construction and Mining |
| Oil and Gas |
| Transport and Logistics |
| Public Safety and Emergency Services |
| Insurance |
| Media and Entertainment |
| Cloud |
| On-Premise |
| Hybrid |
| North America | United States | |
| Canada | ||
| Mexico | ||
| South America | Brazil | |
| Argentina | ||
| Rest of South America | ||
| Europe | United Kingdom | |
| Germany | ||
| France | ||
| Italy | ||
| Rest of Europe | ||
| Asia-Pacific | China | |
| Japan | ||
| India | ||
| South Korea | ||
| Rest of Asia-Pacific | ||
| Middle East and Africa | Middle East | United Arab Emirates |
| Saudi Arabia | ||
| Rest of Middle East | ||
| Africa | South Africa | |
| Egypt | ||
| Rest of Africa | ||
| By Service Type | Mapping and Surveying | ||
| Inspection and Maintenance | |||
| Photogrammetry and 3D Modeling | |||
| Environmental Monitoring and Research | |||
| Delivery and Logistics Data Services | |||
| By Platform Type | Multirotor Unmanned Aerial Vehicle | ||
| Fixed-Wing Unmanned Aerial Vehicle | |||
| Hybrid VTOL Unmanned Aerial Vehicle | |||
| Nano/Micro Unmanned Aerial Vehicle | |||
| By End-user Industry | Agriculture | ||
| Energy and Utilities | |||
| Construction and Mining | |||
| Oil and Gas | |||
| Transport and Logistics | |||
| Public Safety and Emergency Services | |||
| Insurance | |||
| Media and Entertainment | |||
| By Deployment Model | Cloud | ||
| On-Premise | |||
| Hybrid | |||
| By Geography | North America | United States | |
| Canada | |||
| Mexico | |||
| South America | Brazil | ||
| Argentina | |||
| Rest of South America | |||
| Europe | United Kingdom | ||
| Germany | |||
| France | |||
| Italy | |||
| Rest of Europe | |||
| Asia-Pacific | China | ||
| Japan | |||
| India | |||
| South Korea | |||
| Rest of Asia-Pacific | |||
| Middle East and Africa | Middle East | United Arab Emirates | |
| Saudi Arabia | |||
| Rest of Middle East | |||
| Africa | South Africa | ||
| Egypt | |||
| Rest of Africa | |||


Key Questions Answered in the Report
What is the current value of the drone data services market?
The drone data services market size reached USD 4.17 billion in 2026 and is projected to climb to USD 16.48 billion by 2031, according to Mordor Intelligence.
How fast is the drone data services market expected to grow?
It is forecast to register a 31.63% CAGR from 2026 to 2031 per Mordor Intelligence estimates.
Which service segment will expand the quickest through 2031?
Delivery and logistics data services are set for a 32.63% CAGR as real-time telemetry feeds last-mile optimization engines.
Why are hybrid VTOL drones gaining popularity?
Hybrid VTOL combines fixed-wing range with rotor-based hovering, ideal for long corridors that still need precision data capture at specific spots.
Which region will contribute most new revenue by 2031?
Asia-Pacific is expected to record the fastest growth at 32.63% CAGR, led by large-scale government surveys and utility inspections.
What limits broader adoption of drone data services?
Fragmented airspace rules, data-privacy obligations, and a shortage of certified analysts slow global rollouts despite strong demand.
Page last updated on:


