
Telemetric Devices Market Size and Share
Market Overview
| Study Period | 2020 - 2031 |
|---|---|
| Market Size (2026) | USD 252.73 Billion |
| Market Size (2031) | USD 529.18 Billion |
| Growth Rate (2026 - 2031) | 15.92 % |
| Fastest Growing Market | Asia Pacific |
| Largest Market | North America |
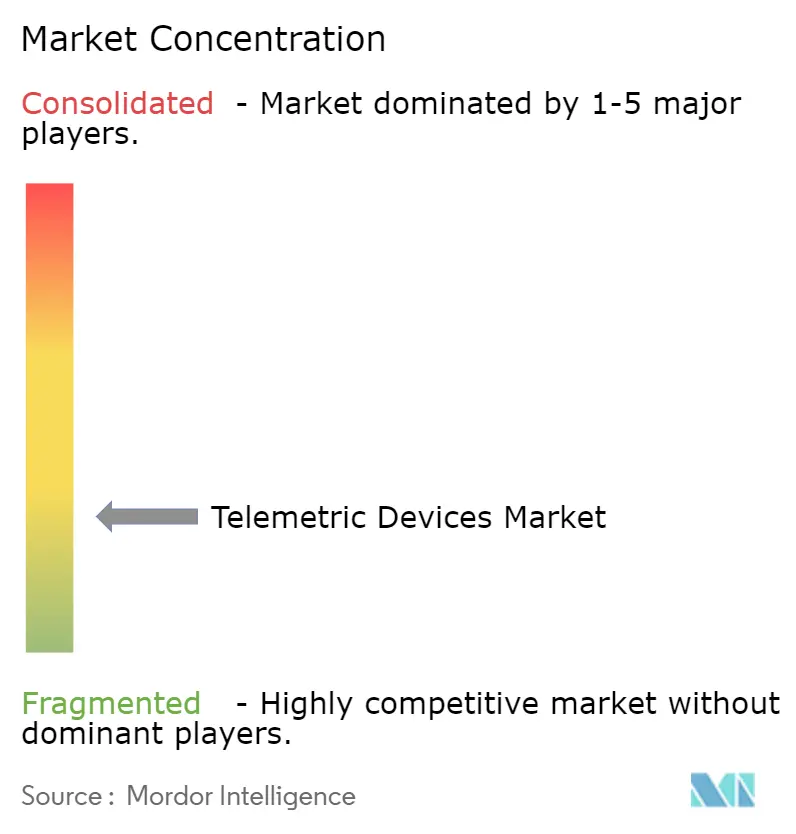
| Market Concentration | Low |
Major Players *Disclaimer: Major Players sorted in no particular order Image © Mordor Intelligence. Reuse requires attribution under CC BY 4.0. | |
Telemetric Devices Market Analysis by Mordor Intelligence
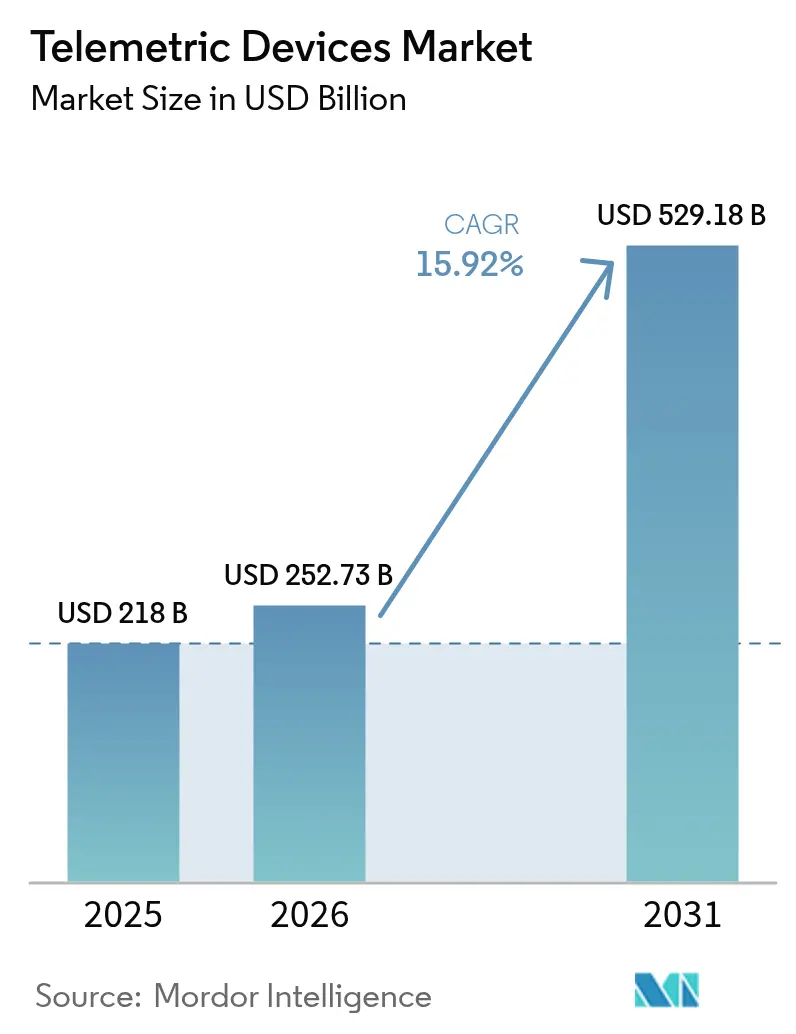
Telemetric Devices Market size in 2026 is estimated at USD 252.73 billion, growing from 2025 value of USD 218 billion with 2031 projections showing USD 529.18 billion, growing at 15.92% CAGR over 2026-2031.
Demand is shifting from reactive monitoring toward predictive intelligence across healthcare, industrial, energy, and defense domains. Growth springs from miniaturized biosensors entering clinical trials, satellite-IoT constellations that extend coverage to remote areas, and low-power wide-area (LPWA) modules that lower connectivity costs for small and mid-sized enterprises. Healthcare remains the largest application, industrial predictive-maintenance programs continue to scale, and regulatory mandates for real-time asset tracking sustain the sector’s strong outlook.
Key Report Takeaways
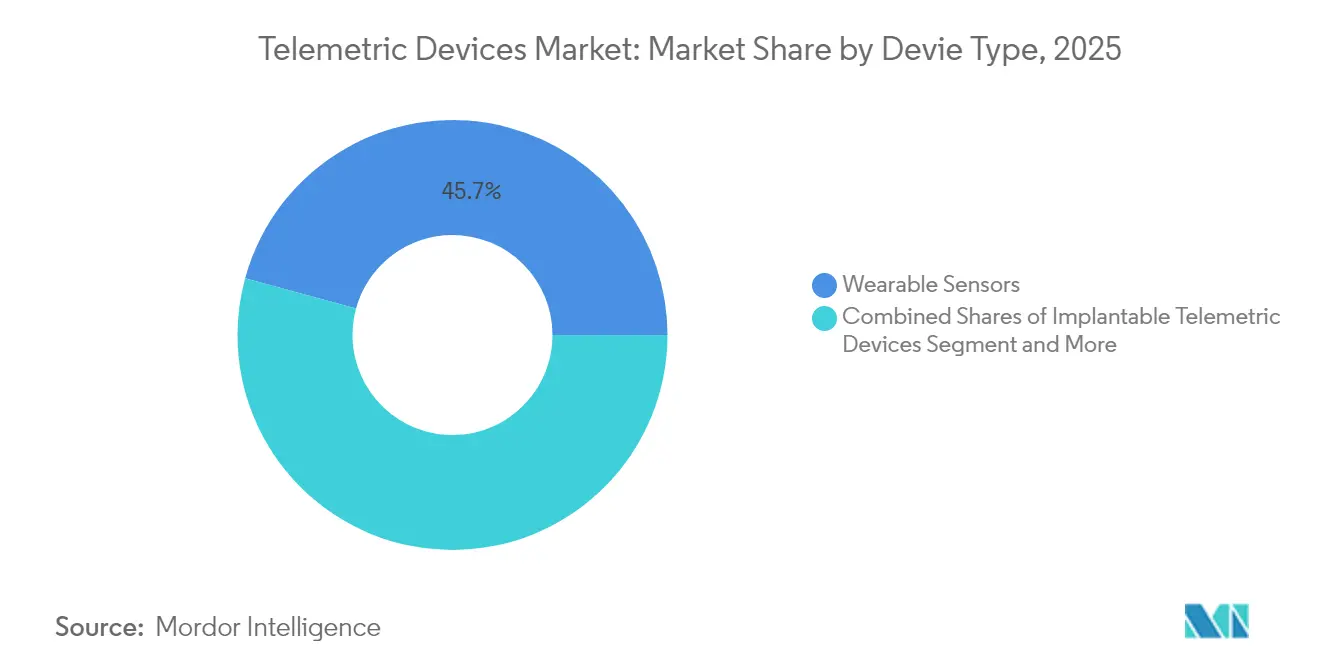
- By device type, wearable sensors led with 45.74% of telemetric devices market share in 2025, while ingestible capsules are projected to grow at an 18.41% CAGR through 2031.
- By component, hardware retained 51.35% of the telemetric devices market size in 2025; software analytics is poised for a 16.02% CAGR to 2031.
- By communication technology, cellular solutions held 47.88% share of the telemetric devices market in 2025, whereas LPWAN protocols show the fastest growth at a 18.86% CAGR.
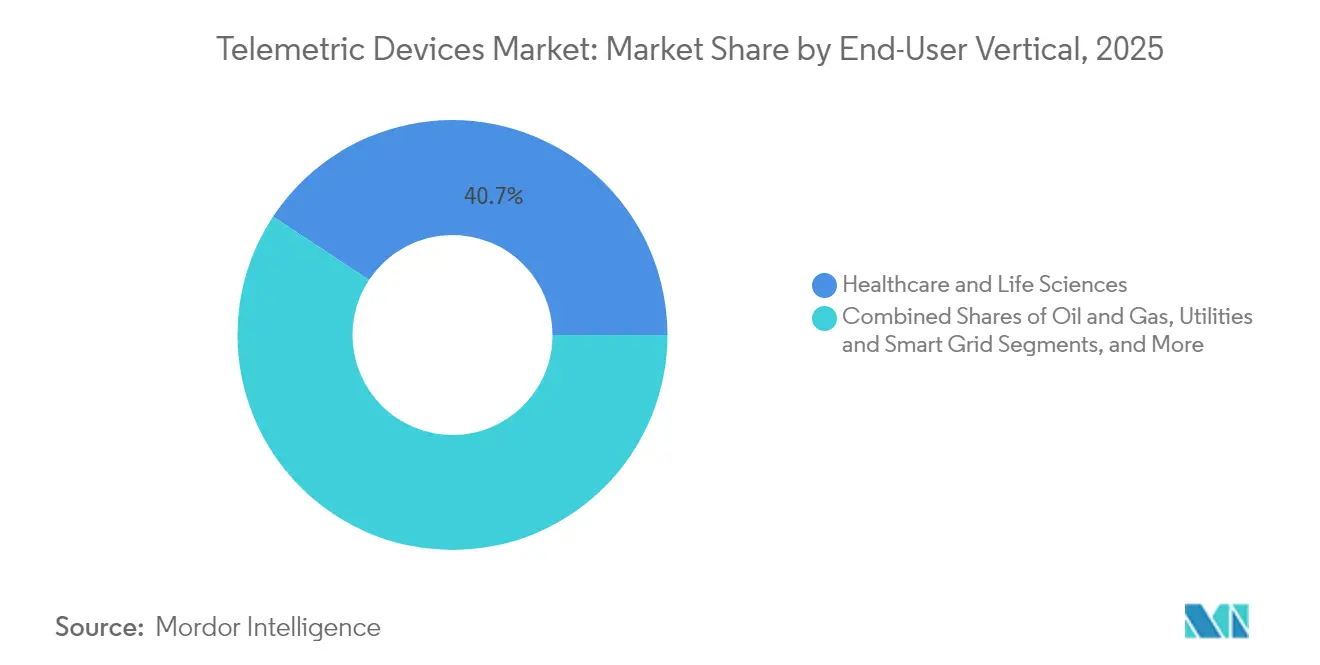
- By end-user vertical, healthcare commanded 40.72% revenue share in 2025 in telemetric devices market, and transportation and logistics is forecast to expand at a 16.74% CAGR through 2031.
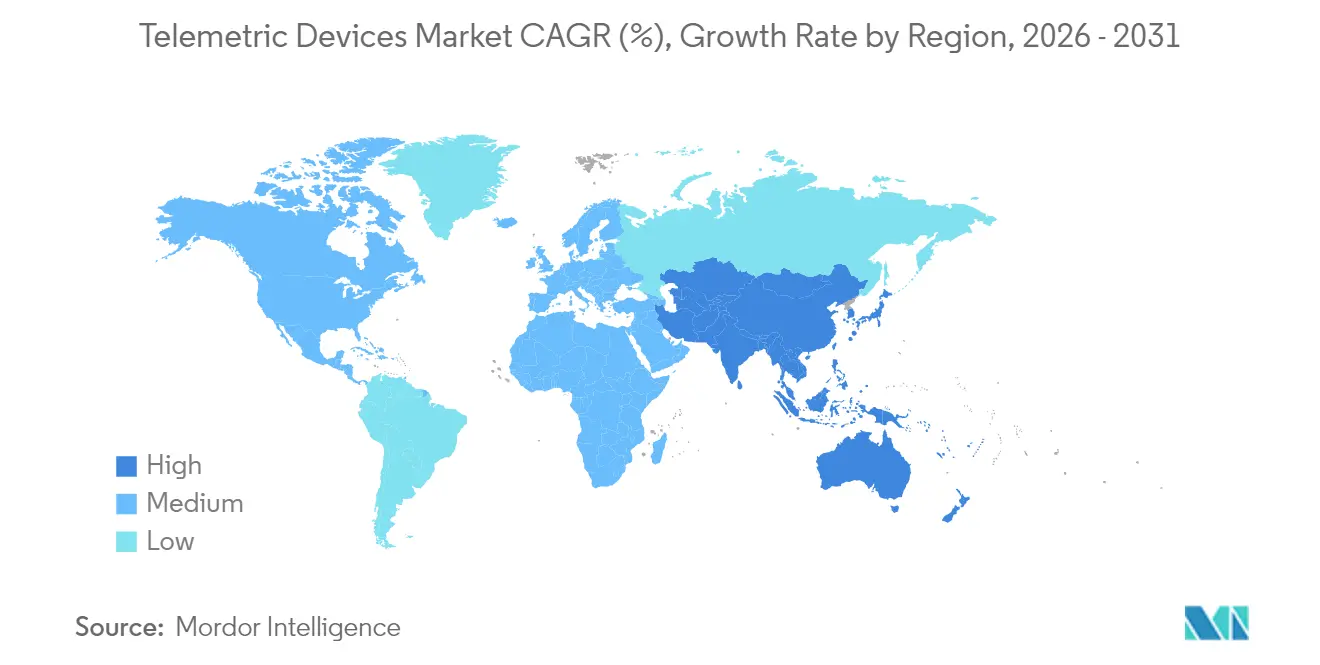
- By region, North America captured 37.46% of the telemetric devices market share in 2025; Asia Pacific is advancing at a 17.18% CAGR to 2031.
Note: Market size and forecast figures in this report are generated using Mordor Intelligence’s proprietary estimation framework, updated with the latest available data and insights as of 2026.
Market Trends and Insights
Drivers Impact Analysis of Telemetric Devices Market*
| Driver | (~) % Impact on CAGR Forecast | Geographic Relevance | Impact Timeline |
|---|---|---|---|
| Explosion of IoT-enabled healthcare and wearable monitoring | +4.2% | North America and Europe | Medium term (2-4 years) |
| Industrial shift toward predictive maintenance | +3.8% | APAC manufacturing hubs | Long term (≥ 4 years) |
| Regulatory mandates for real-time asset tracking | +2.1% | North America and EU | Short term (≤ 2 years) |
| Falling cost of LPWA modules | +2.9% | Emerging markets worldwide | Medium term (2-4 years) |
| Satellite-IoT constellations for remote telemetry | +1.8% | Remote regions in APAC and Africa | Long term (≥ 4 years) |
| Miniaturized implantable biosensors in trials | +1.4% | North America and Europe | Long term (≥ 4 years) |
| Source: Mordor Intelligence | |||
Explosion of IoT-Enabled Healthcare and Wearable Monitoring
Healthcare telemetry is moving beyond bedside monitors to preventive wellness solutions. The University of Hong Kong’s organic electrochemical transistor platform processes patient data locally, cutting transmission costs and latency. Nanotechnology now shrinks continuous-glucose sensors by 95% without performance loss.[1] AI-enhanced algorithms embed predictive analytics in wearables to forecast acute events. Clinical trials of wirelessly controlled drug-delivery microchips show adherence gains that rival traditional injections. These advances transform connected devices from passive recorders into active therapeutic tools.
Industrial Shift Toward Predictive Maintenance
Oil and gas wells can generate more than 10 TB of sensor data each day; analytics platforms now identify maintenance windows that avoid costly shutdowns.[2] Edge devices installed on offshore rigs process information locally, preventing safety risks tied to network latency. Utilities adopting Industry 4.0 practices report sizeable cuts in unplanned downtime. Japanese plants deploy on-premise monitoring systems to offset labor shortages, reinforcing global appeal for autonomous asset care. Cost-avoidance incentives keep industrial telemetry growth intact through 2030.
Regulatory Mandates for Real-Time Asset Tracking (Oil and Gas, Aviation)
Regulators now treat continuous telemetry as a prerequisite for operating critical infrastructure. The U.S. Bureau of Safety and Environmental Enforcement emphasizes real-time offshore monitoring to prevent spills. Aviation authorities expand tracking rules from flight-data recorders to entire maintenance systems, raising adoption in airlines and MRO providers. Smart-grid standards issued by NIST drive utilities to combine telemetric devices with grid-edge intelligence. FCC allocations for unmanned aircraft unlock dedicated frequencies for telemetry applications, underscoring federal commitment to always-on monitoring.
Falling Cost of LPWA Modules
Commodity pricing for LPWA hardware now puts large-scale telemetry within reach of small businesses. LoRaWAN modules deliver multi-year battery life for sparse deployments, while NB-IoT suits high-density urban use cases. With chip supplies stabilizing in 2025, module vendors scale production at lower cost. Enterprises favor private LoRaWAN networks for data sovereignty and key management. As costs fall further, the telemetric devices market finds fresh demand in agriculture, utilities, and smart-city lighting.
Restraints Impact Analysis of Telemetric Devices Market*
| Restraint | (~) % Impact on CAGR Forecast | Geographic Relevance | Impact Timeline |
|---|---|---|---|
| High upfront hardware and integration costs | -2.8% | Emerging markets worldwide | Short term (≤ 2 years) |
| Data-privacy and cybersecurity concerns | -2.1% | EU and North America | Medium term (2-4 years) |
| Spectrum congestion in sub-GHz bands | -1.4% | Dense urban areas | Medium term (2-4 years) |
| Proprietary protocol fragmentation | -1.9% | Global | Long term (≥ 4 years) |
| Source: Mordor Intelligence | |||
High Upfront Hardware and Integration Costs
Capital expenses remain a hurdle, particularly for small enterprises. Chip supply volatility, exposed by raw-material shortages in 2024, pushed component prices higher and delayed new projects. Integration with decades-old machinery needs custom middleware, inflating budgets. Automakers such as Ford have adjusted production lines in response to electronics shortages, illustrating ripple effects on telemetry suppliers. Vendors respond with modular, plug-and-play architectures, yet complex industrial environments still rely on bespoke engineering, prolonging ROI timelines.
Data-Privacy and Cybersecurity Concerns
Connected devices create expansive attack surfaces. The FDA’s new Quality System Regulation final rule effective February 2026 imposes stricter security controls on medical telemetry. Industrial control systems now bridge operational and IT networks, inviting cyber threats that could disrupt national infrastructure. EU data-localization laws add encryption and auditing costs. Security-by-design frameworks help, but new compliance layers slow decision making in risk-averse industries.
*Our forecasts treat driver/restraint impacts as directional, not additive. The impact forecasts reflect baseline growth, mix effects, and variable interactions.
Telemetric Devices Market Segment Analysis
By Device Type:
Ingestible Capsules Accelerate Internal MonitoringWearable sensors held 45.74% of telemetric devices market share in 2025, underscoring consumer familiarity with wristbands and patches. Ingestible capsules now represent the most dynamic category, advancing at an 18.41% CAGR through 2031 as clinicians embrace non-invasive internal diagnostics. Swallowable capsule robots that anchor to intestinal tissue enable multi-day monitoring without external intervention. Sub-0.1-mm³ temperature sensors add new diagnostic options while leaving no surgical footprint. Remote fixed-site modules remain essential for harsh industrial environments such as upstream oil pipelines. Wearable formats move toward on-device AI, transforming basic readings into personalized early-warning systems. Bio-degradable materials under study could phase out removal surgeries, improving patient acceptance and broadening use cases for the telemetric devices market.
Healthcare innovators prioritize ingestible telemetry because internal data yield richer clinical insight than surface sensors. Capsule endoscopy evolved from still-image capture to live data streaming, supported by LPWA back-haul that extends battery life. Athletes and soldiers test ingestible thermometers for core-temperature surveillance in extreme climates. These developments point to a future where internal sensors complement external wearables, together delivering holistic patient profiles.

By Component:
Software Analytics Command Value CreationIn 2025, hardware captured 51.35% of telemetric devices market size, reflecting the cost of sensors, microcontrollers, and antennas. Software analytics, however, post a 16.02% CAGR to 2031, emphasizing the pivot from raw data to actionable insight. Edge-processing libraries compress time-series information locally before cloud upload, cutting bandwidth by up to 90%. Power-management chips with energy-harvesting inputs now double service life in remote meters. As device count grows, orchestration platforms that manage firmware and security updates at scale distinguish leading vendors.
Predictive-maintenance suites integrate physics-based models with machine-learning classifiers, enabling operators to schedule service only when probability of failure rises. Healthcare analytics engines combine multi-sensor streams to generate early diagnostic flags, pushing reimbursement models toward outcome-based care. With interoperability gaining importance, open-API platforms position themselves as the glue connecting diverse hardware in the telemetric devices market.
By End-User Vertical:
Transportation and Logistics Gain MomentumHealthcare retained 40.72% of 2025 revenue owing to chronic-disease management and hospital-at-home initiatives. Transportation and logistics, however, is set to expand at a 16.74% CAGR, driven by fleet telematics, cold-chain monitoring, and autonomous-vehicle development. GPS-enabled trackers paired with predictive algorithms boost fleet productivity and slash fuel use, with 75% of managers confirming efficiency gains. Oil-pipeline operators employ fiber-optic telemetry to sense leaks in real time, complying with tightening environmental regulations. Aerospace programs integrate secure satellite links for missile-defense telemetry, attracting sizeable defense budgets.
Beyond conventional sectors, agriculture adopts soil-moisture sensors to optimize irrigation and reduce water use. Utilities deploy smart meters that transmit voltage and consumption every few minutes, sharpening grid stability. The breadth of industry uptake reinforces the telemetric devices market’s diversified growth trajectory.
By Communication Technology:
LPWAN Challenges Cellular SupremacyCellular networks owned 47.88% market share in 2025, leveraging 4G/5G infrastructure for high-bandwidth applications such as video telematics. LPWAN solutions, including LoRaWAN and NB-IoT, register the steepest ascent at 18.86% CAGR, valued for ultra-low power and deep-indoor reach. Analysts expect LoRaWAN and NB-IoT to account for 3.5 billion connections by 2030.. Satellite Non-Terrestrial Networks (NTNs) extend coverage to deserts and oceans, with Myriota HyperPulse enabling sensor backhaul from any latitude. Bluetooth LE and Wi-Fi retain roles in wearables and home-automation hubs.
Hybrid modems combining cellular and LoRaWAN ensure redundancy for mission-critical sites. Private LPWAN deployments give enterprises autonomy over data flows and encryption keys, addressing sovereignty concerns. As roaming fees fall and roaming agreements widen, cross-border asset tracking becomes more feasible, further broadening the telemetric devices market.
Geography Analysis
North America Telemetric Devices Market
North America captured 37.46% of telemetric devices market share in 2025, propelled by mandatory real-time tracking in aviation and energy. The Space Development Agency’s USD 4.3 billion allocation to next-generation satellites underpins domestic demand for secure telemetry. Honeywell’s joint initiative with Verizon embeds 5G links into smart meters, illustrating public-utility modernization. The FCC’s new 6 GHz VLP rules accommodate additional device classes, stimulating innovation. Robust healthcare infrastructure fosters rapid adoption of implantable cardiac monitors, strengthening the region’s lead.
APAC Telemetric Devices Market
Asia Pacific is forecast to grow at 17.18% CAGR to 2031. China’s NB-IoT base alone is expected to reach 1.9 billion connections, driven by state subsidies and manufacturing scale. Japan’s Sinto Corporation fields on-premise monitoring to counter factory labor shortages. India’s smart-city programs mandate sensor deployments for traffic, water, and air-quality management. Local chip fabrication along with supportive telecom policies, allow regional firms to price hardware aggressively, broadening domestic adoption and positioning the area as a supply-chain hub for the telemetric devices market.
Europe Telemetric Devices Market
Europe maintains steady expansion on the back of smart-grid rollouts and climate-action regulations. Smart-meter penetration reached 60% for electricity and 45% for gas by 2023, providing a platform for grid-edge telemetry. Siemens generated EUR 75.9 billion in 2024 revenue with digitalization cited as a growth engine. Strict GDPR compliance rules shape design choices, pushing vendors toward stronger encryption and regional data centers. Environmental monitoring networks measure CO₂ and methane at industrial sites, supporting the EU’s Green Deal objectives and creating new telemetric devices market demand.
Regulatory Landscape
Across key markets, telemetric devices face tightening requirements that connect quality management with cybersecurity and traceability, especially for medical and connected monitoring systems. In the United States, the FDA Quality Management System Regulation (QMSR) became effective in February 2026, aligning medical-device quality expectations with ISO 13485:2016 and reinforcing software and cybersecurity controls for connected devices during inspections. For ingestible telemetry used in gastrointestinal capsule imaging, FDA classification remains Class II with special controls (21 CFR 876.1300), keeping clinical evidence, performance testing, and labeling obligations central to commercialization.
In Europe, the Medical Device Regulation (MDR, Regulation (EU) 2017/745) continues to shape lifecycle documentation, post-market surveillance, and UDI discipline for telemetric medical devices, while EUDAMED registration became mandatory in May 2026, raising the bar on data completeness and supply-chain transparency for manufacturers placing products on the EU market. Trade policy is also part of the compliance stack for global OEMs: industry bodies such as MedTech Europe highlighted potential implications of proposed US Section 301 tariff actions in mid-2026, which can alter landed cost structures for imported components and finished devices used in remote monitoring programs.
Value Chain Analysis
The telemetric devices value chain starts upstream with specialized semiconductors and materials (sensor elements, power-management ICs, RF front ends, MCUs/FPGAs/ADCs, antennas, connectors, batteries, and ruggedized enclosures), then moves through midstream design and board-level manufacturing, calibration, environmental and regulatory testing (EMC, wireless, safety), and system integration with analytics software, cloud services, and enterprise systems such as EMR/EHR and OT platforms. Downstream channels include medical and industrial OEM sales teams, distributors and system integrators, connectivity partners (telecom and satellite), and lifecycle services such as firmware updates, cybersecurity patching, and fleet management.
Supply risk and qualification time are recurring friction points in safety-critical segments. Aerospace and defense telemetry modules can face long certification cycles, while industrial-grade connectors and discrete/power components introduce extended lead times, which pushes suppliers and OEMs toward dual-sourcing and re-qualification strategies. Cost pressure also shows up in upstream inputs: TE Connectivity implemented a global list-price increase effective January 2026, and PPSI reported Analog Devices price increases across analog and power-management lines effective June 1, 2026, which can flow into BOM costs for LPWAN, cellular, and satellite-capable modules and affect quoting and design-to-cost decisions.
Competitive Landscape
Competition is moderately fragmented. Traditional medical-device makers extend into industrial telemetry, while software firms add hardware to own the full stack. Siemens invested EUR 6.3 billion in R&D during 2024, underscoring the capital required to stay ahead.[4]Platform Science’s purchase of Trimble’s transportation-telematics units, worth USD 300 million in annual revenue, shows ongoing consolidation. L3Harris won a USD 919 million satellite-payload contract, illustrating defense influence on advanced telemetry features.
White-space opportunities abound in ultra-low-power segments such as wildlife tracking and structural-health monitoring. Vendors differentiate through analytics sophistication and cross-platform interoperability rather than hardware alone. Proprietary ecosystems still lock in some customers, but RESTful APIs and Matter-compliant frameworks continue to erode barriers. The balance of power is tilting toward companies that fuse AI, edge computing, and multi-bearer connectivity into seamless services for the telemetric devices market.
Telemetric Devices Industry Leaders
-
Siemens AG
-
GE Healthcare
-
Philips Healthcare
-
Schlumberger Limited.
-
Schneider Electric
- *Disclaimer: Major Players sorted in no particular order
Telemetric Devices Market Companies Covered in this Report
- Siemens Healthineers AG
- GE HealthCare Technologies Inc.
- Philips North America LLC
- Honeywell International Inc.
- SLB N.V.
- Schneider Electric SE
- Sierra Wireless, Inc.
- Cobham Limited
- Kongsberg Gruppen ASA
- L3Harris Technologies, Inc.
- Abbott Laboratories
- Medtronic plc
- Boston Scientific Corporation
- Trimble Inc.
- CalAmp Corp.
- Omnitracs, LLC
- Bosch Sensortec GmbH
- Garmin Ltd.
- Fitbit LLC
- Verizon Connect, Inc.
Market Opportunities and Future Outlook
Coverage gaps and security threats are creating whitespace for multi-bearer and resilient-location telemetry designs that target industrial, utilities, transportation, and remote healthcare use cases. Several 2026 product moves reflect this direction: Iridium began commercial availability of the 9604 IoT module integrating satellite, LTE-M cellular, and GNSS, and later announced commercial availability of an Iridium PNT ASIC aimed at protecting GNSS-dependent devices from jamming and spoofing. Myriota also launched a hybrid IoT network and an asset-tracking device combining cellular with HyperPulse satellite connectivity, supporting always-on telemetry for dispersed assets such as tanks, pumps, containers, and field equipment.
In healthcare telemetry, reimbursement and regulatory clarity continue to shape adoption paths and product positioning, creating room for device makers and software platforms that can document security-by-design and integrate into clinical workflows. In January 2026, the FDA issued updated final guidance for General Wellness devices, helping delineate claims and product boundaries for non-invasive sensing and connected monitoring, while CMS introduced new RPM billing codes in January 2026 and set the ACCESS model as a named pathway shifting RPM reimbursement toward value-based care. Together, these steps support opportunities for vendors that pair validated sensors with analytics, deliver audit-ready data handling, and offer fleet-level service capabilities for chronic-care monitoring programs that need scalable device management and secure interoperability.
Recent Industry Developments in Telemetric Devices Market
- February 2026: GE HealthCare launched ReadyFix remote fleet management for MAC VU360 resting ECG workstations, enabling remote diagnosis and service actions to improve device uptime. The rollout reinforces the shift toward service-led telemetry ecosystems where installed-base connectivity and maintenance analytics become part of the product value proposition.
- October 2025: GE HealthCare received a CE mark for the Carevance patient monitor with Cardiac Output Insights for hemodynamic monitoring. The approval supports broader EU commercialization of connected bedside and step-down monitoring configurations, expanding addressable deployments for telemetry-enabled patient monitoring.
- May 2024: Philips rolled out its ePatch wearable cardiac monitor with the Cardiologs AI analytics platform to 14 hospitals in Spain for heart-patient monitoring. This deployment highlights operational scale-up of patch-based telemetry and AI-assisted ECG analysis in routine care settings, accelerating substitution away from traditional episodic monitoring approaches.
Telemetric Devices Market Report Scope and Research Methodology
Market Definition and Coverage
For this methodology, the telemetric devices market covers physical devices and embedded modules that measure data and transmit it to a remote receiver for monitoring, control, or analytics. The sizing is value-based and captured in USD across major end-use settings globally.
Scope exclusions: We exclude pure software-only platforms and services that do not include a telemetric device shipment in the transaction value.
Segments Covered in This Report
- By Device Type
- Wearable Telemetric Sensors
- Implantable Telemetric Devices
- Ingestible Telemetry Capsules
- Remote Fixed-site Modules
- By Component
- Sensors and Transducers
- Telemetry Communication Module
- Antennas and Power Management
- Software / Analytics Platform
- By End-User Vertical
- Healthcare and Life Sciences
- Industrial and Manufacturing
- Oil and Gas (Upstream and Midstream)
- Aerospace and Defense
- Transportation and Logistics
- Utilities and Smart Grid
- By Communication Technology
- Cellular (3G/4G/5G)
- Satellite
- LPWAN (NB-IoT, LoRa, Sigfox)
- Bluetooth / Wi-Fi
- By Geography
- North America
- United States
- Canada
- Mexico
- South America
- Brazil
- Argentina
- Rest of South America
- Europe
- United Kingdom
- Germany
- France
- Italy
- Spain
- Rest of Europe
- Asia-Pacific
- China
- Japan
- India
- South Korea
- Rest of Asia-Pacific
- Middle East and Africa
- Middle East
- Saudi Arabia
- United Arab Emirates
- Turkey
- Rest of Middle East
- Africa
- South Africa
- Rest of Africa
- Middle East
- North America
Data Sources, Market Sizing, and Validation
Desk Research
Desk work started with building a fact base on where telemetry is used and how demand shows up in public data. We leaned on open sources such as the International Telecommunication Union (ITU) for connectivity indicators, OECD and World Bank for macro and industry output series, and U.S. FDA databases for signals on regulated medical telemetry device clearances.
To make the model practical, we also reviewed company filings, investor presentations, and credible press coverage for pricing direction, product mix changes, and regional growth commentary. Where needed, we used paid subscriptions for company financials and intelligence, patent databases, and shipment-level import or export data to sanity-check volumes and supply routes. The desk source list is illustrative only, and we also used other public references for cross-checking and clarification.
Primary Interviews and Surveys
Primary work focused on validating adoption pace, typical bill-of-material shares, and pricing movement by device class and communication technology (cellular, satellite, and short-range). We spoke with a balanced set of respondents across APAC, EMEA, and the Americas, covering device makers, module suppliers, and buyers in healthcare, industrial monitoring, and asset tracking. This input helped tighten gaps that public reporting alone did not fully cover.
Distribution of primary research fieldwork respondents
| Company type | Respondent position | Region |
|---|---|---|
| Top tier: 25% | CXOs: 13% | APAC: 44% |
| Mid tier: 59% | Functional/Unit leaders: 43% | EMEA: 37% |
| Smaller Players: 16% | Managers: 44% | Americas: 19% |
Market-Sizing & Forecasting
Sizing was built using a top-down approach where connectivity expansion and device penetration by end-use were used to reconstruct the demand pool, and then translated into value through typical device pricing. The final totals were then corroborated with selective bottom-up approximations, such as sampled average selling price (ASP) times estimated unit volumes and channel checks, which helped adjust for over-counting and double counting.
Key inputs in the model included the installed base trend for connected endpoints, uptake of 3G/4G/5G and satellite links for telemetry, device replacement cycles, regulatory activity for medical telemetry, and shifts in component costs that influence ASP progression. When bottom-up visibility was weak for smaller countries or niche uses, we applied proxy ratios based on comparable markets and then re-tested them with interview feedback before locking assumptions.
For forecasting, scenario analysis was used to keep projections realistic under different adoption and pricing paths, including cases where faster connectivity rollouts lift volumes even if ASPs soften. Growth assumptions were not carried forward mechanically, and were refreshed through expert consensus checks on near-term shipments and mid-term penetration limits.
Data Validation & Update Cycle
Model outputs were checked against independent signals, including regional connectivity indicators, trade flows for relevant device categories, and public commentary on demand conditions in major end-user industries. Variances were reviewed in multiple analyst passes, and large deviations triggered re-checks of penetration rates, ASP steps, and currency conversions.
The report is refreshed annually, and interim updates are made when material events change demand, supply, or pricing assumptions. Before delivery, a final review pass is completed so clients receive an updated view grounded in the latest available public and primary inputs.
Mordor Intelligence's Global Telemetric Devices Market Size Measured Against Other Published Estimates
Published market sizes for telemetric devices rarely match because researchers do not count the same things, and they also do not use the same timing for pricing and currency conversions. Differences in how device versus service value is treated, plus how healthcare and industrial telemetry are bundled, usually explains most of the spread.
Some estimates lean heavily toward a narrower set of hardware types or a specific application lens, which lowers the total even when the growth rate looks healthy. Others expand the scope by rolling in adjacent connected-device categories and broader monitoring systems. In Mordor Intelligence, the counted value is limited to telemetric devices and embedded telemetry modules, and software-only and service-only revenues are kept out unless they are packaged with the device transaction.
Benchmark comparison
| Source | Market Size | Gaps in Research Methodology |
|---|---|---|
| Mordor Intelligence | USD 252.73 B (2026) | |
| Industry Research Publisher A | USD 218.50 B (2025) | Uses a different base year and may apply a broader type taxonomy that blends wired and analog categories with adjacent monitoring setups, which can shift what is counted as a device sale versus a system value. |
| Industry Research Publisher B | USD 24.46 B (2024) | Appears to size a narrower demand pool focused on select applications like fleet and asset tracking, which can exclude large healthcare and industrial telemetry device volumes that are included in a wider device coverage. |
Taken together, the table shows that year selection and scope choices are the main drivers behind the gap. By tying the value build to clear device-level demand indicators, and then checking it against pricing and adoption feedback from practitioners, the final estimate stays traceable and repeatable for planning and benchmarking.
Key Questions Answered in the Report
What is the current size of the telemetric devices market?
The market is worth USD 252.73 billion in 2026 and is projected to reach USD 529.18 billion by 2031 at a 15.92% CAGR.
Which device type is growing the fastest?
Ingestible capsules lead growth with an 18.41% CAGR through 2031, reflecting rising demand for internal monitoring solutions.
Why are LPWAN protocols gaining traction over cellular?
LPWAN offers multi-year battery life and lower connectivity costs, driving a 18.86% CAGR even though cellular still holds 47.88% market share.
Which region will expand the most by 2031?
Asia Pacific shows the highest regional CAGR at 17.18% due to industrial IoT adoption and large-scale smart-city projects.
How are regulators influencing telemetric device adoption?
Mandates for real-time asset tracking in sectors such as aviation, oil, and gas, along with new cybersecurity rules for medical devices, are accelerating deployment across multiple industries.
What factors currently restrain market growth?
High upfront integration costs, cybersecurity concerns, and spectrum congestion in sub-GHz bands are the primary brakes on wider adoption.