Drinking Water Adsorbents Market Size and Share
Market Overview
| Study Period | 2021 - 2031 |
|---|---|
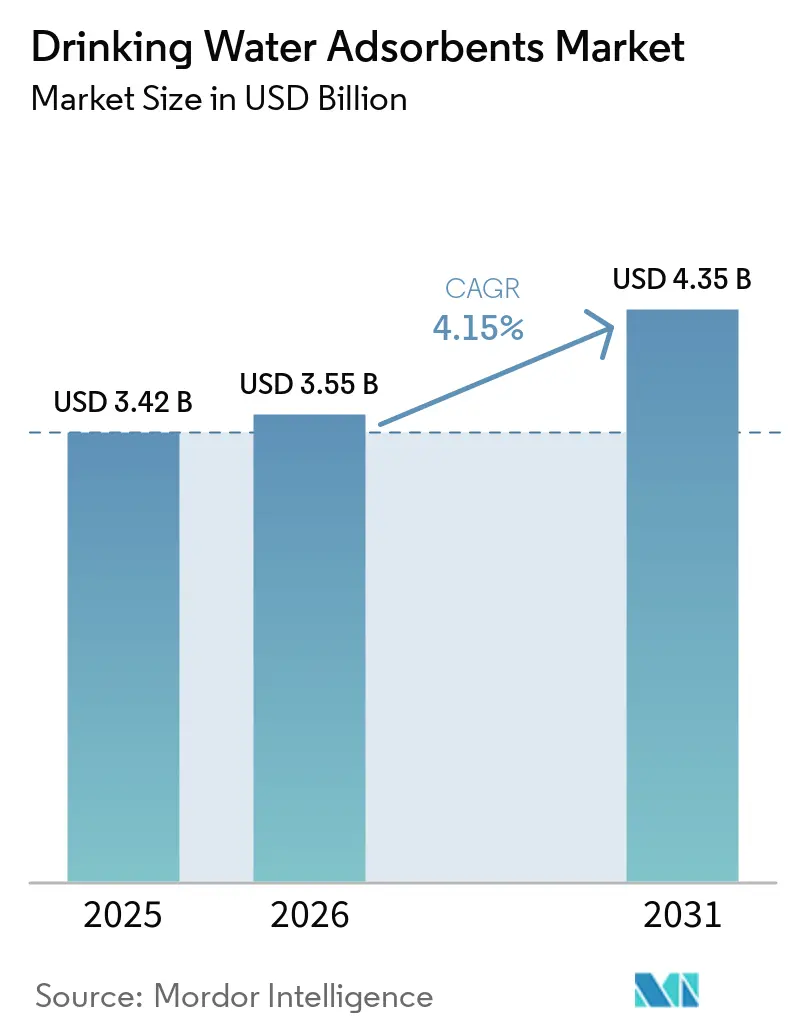
| Market Size (2026) | USD 3.55 Billion |
| Market Size (2031) | USD 4.35 Billion |
| Growth Rate (2026 - 2031) | 4.15% CAGR |
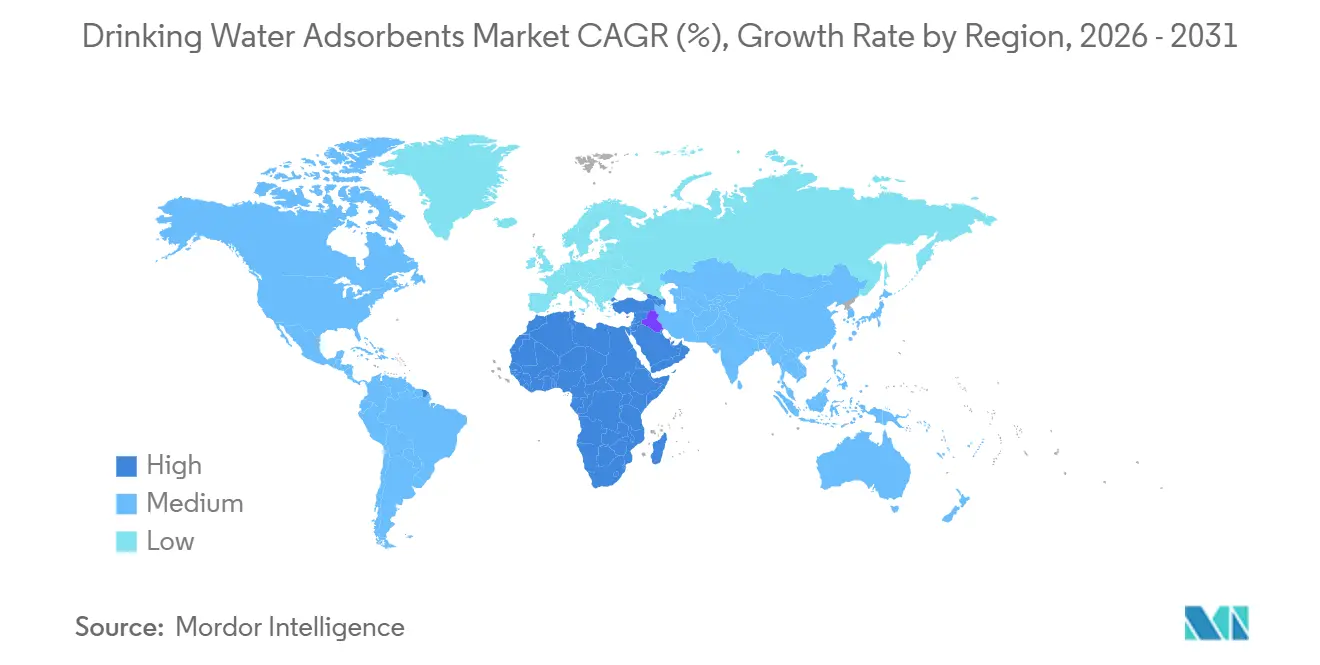
| Fastest Growing Market | Middle East and Africa |
| Largest Market | Asia-Pacific |
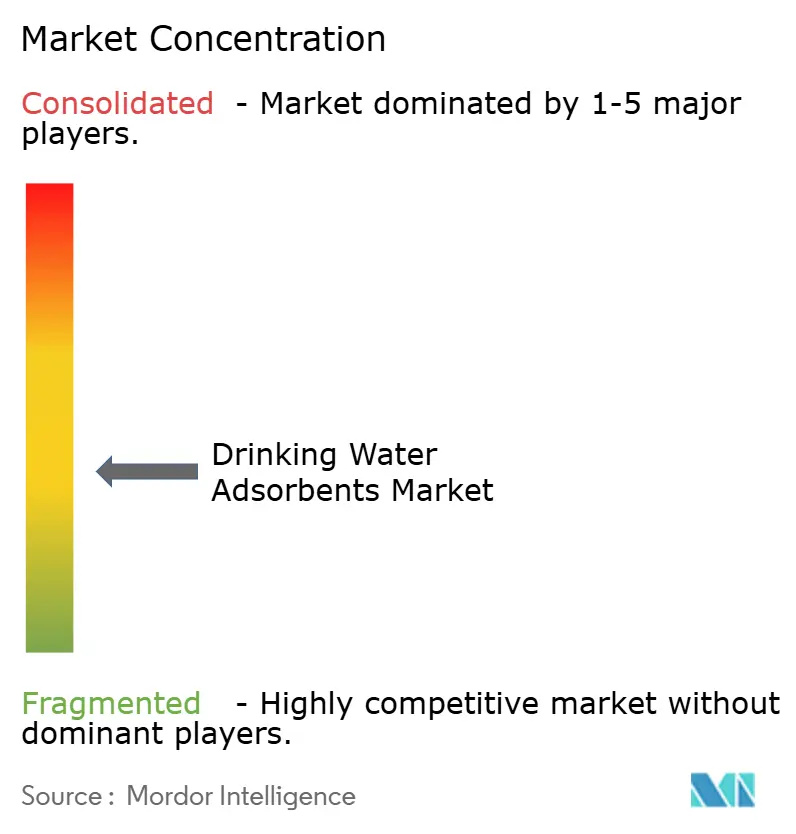
| Market Concentration | Medium |
Major Players *Disclaimer: Major Players sorted in no particular order Image © Mordor Intelligence. Reuse requires attribution under CC BY 4.0. | |
Drinking Water Adsorbents Market Analysis by Mordor Intelligence
The Drinking Water Adsorbents Market size is expected to increase from USD 3.42 billion in 2025 to USD 3.55 billion in 2026 and reach USD 4.35 billion by 2031, growing at a CAGR of 4.15% over 2026-2031. The steady topline hides a structural shift toward specialty media able to capture per- and polyfluoroalkyl substances (PFAS) at single-digit ppt limits, a requirement now embedded in U.S. and EU regulations. Municipal utilities still dominate demand, yet compact portable units for disaster relief and conflict zones are scaling faster as agencies in Ukraine and Türkiye validated modular granular-activated-carbon (GAC) cartridges that restore safe supply within days. Asia-Pacific secures the highest regional revenue, propelled by India’s INR 3.6 trillion Jal Jeevan Mission and China’s mandate for advanced treatment in 300+ cities. Competitive intensity remains moderate: the top five suppliers control roughly 45% of global sales, but emerging MOF and biochar innovators are eroding incumbent share, especially where utilities prize lower footprint or circular-economy credentials.
Key Report Takeaways
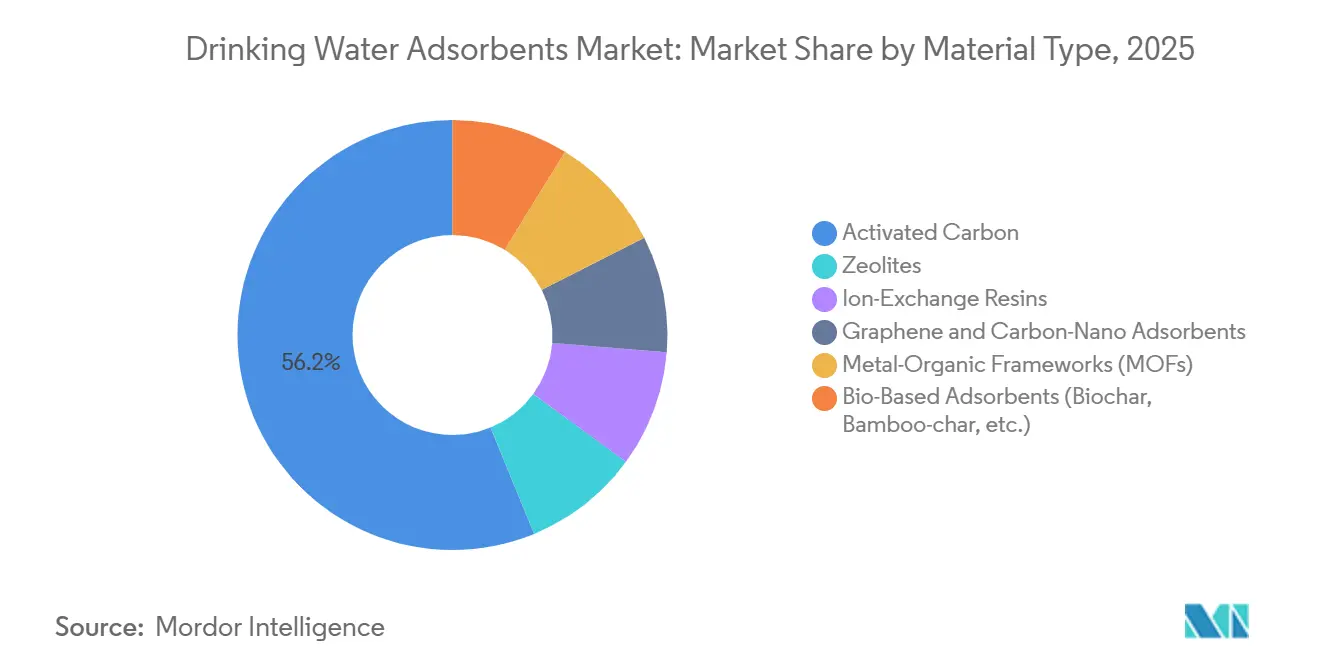
- By material type, activated carbon led with 56.20% of the drinking water adsorbents market share in 2025, while metal-organic frameworks are projected to expand at a 5.61% CAGR to 2031.
- By form factor, granular media commanded 48.16% share of the drinking water adsorbents market size in 2025, and integrated membrane-coated media is advancing at a 5.56% CAGR through 2031.
- By contaminant target, PFAS removal generated 34.27% of 2025 revenue, whereas micro- and nanoplastics treatment is forecast to grow at a 5.71% CAGR toward 2031.
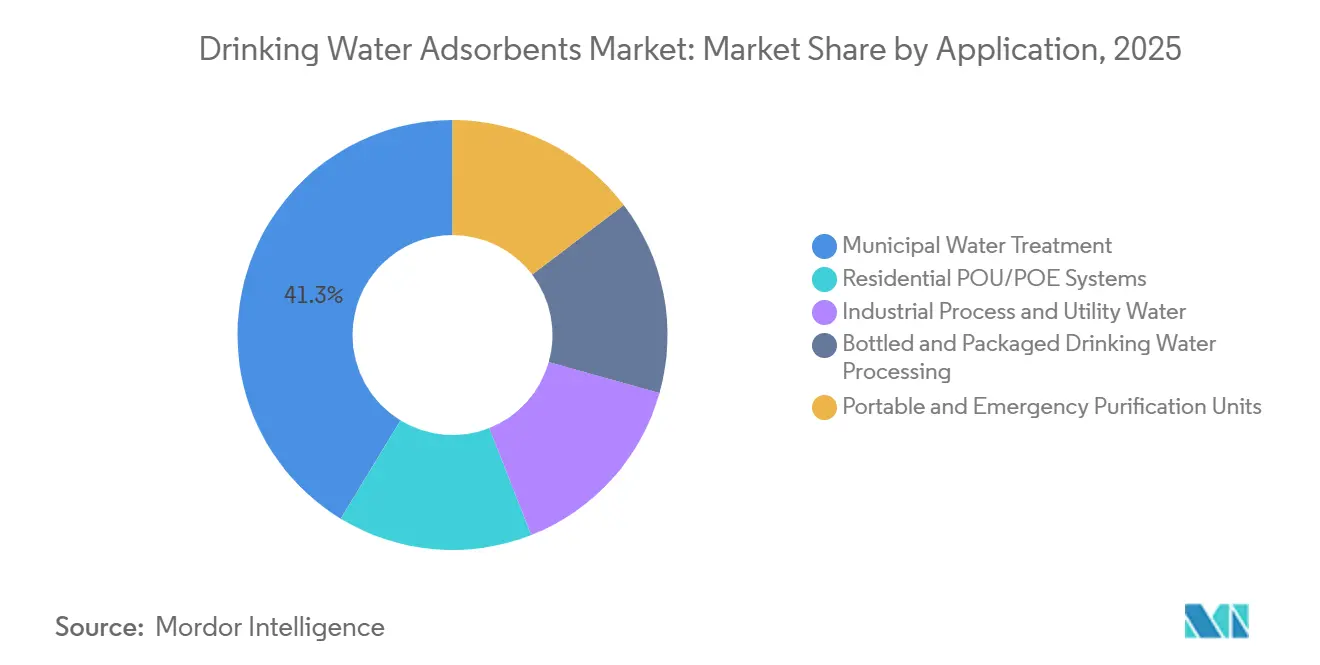
- By application, municipal treatment held 41.30% of 2025 sales, but portable and emergency units are set to grow fastest at 5.45% CAGR to 2031.
- By geography, Asia-Pacific accounted for 37.90% of the 2025 value, and the Middle East and Africa region is poised for the highest 5.64% CAGR over the forecast period.
Note: Market size and forecast figures in this report are generated using Mordor Intelligence’s proprietary estimation framework, updated with the latest available data and insights as of January 2026.
Global Drinking Water Adsorbents Market Trends and Insights
Drivers Impact Analysis*
| Drivers | (~) % Impact on CAGR Forecast | Geographic Relevance | Impact Timeline |
|---|---|---|---|
| Growing concern over water purity and health safety | +0.9% | Global, with acute focus in North America, EU, and urban APAC | Medium term (2-4 years) |
| Rising demand from municipal and industrial treatment plants | +1.1% | APAC core (China, India, ASEAN), spill-over to MEA and South America | Long term (≥ 4 years) |
| Increasing adoption of POU/POE systems | +0.7% | North America, Western Europe, urban centers in APAC | Short term (≤ 2 years) |
| Stringent PFAS and emerging-contaminant regulations | +1.3% | North America, EU, with emerging frameworks in Australia and Japan | Medium term (2-4 years) |
| Surge in modular/mobile water units for disaster-relief and remote areas | +0.5% | Global hot-spots: Middle East conflict zones, earthquake-prone APAC, sub-Saharan Africa | Short term (≤ 2 years) |
| Source: Mordor Intelligence | |||
Growing Concern Over Water Purity And Health Safety
Scientific evidence linking micro- and nanoplastics to cardiovascular and renal stress sparked heightened public scrutiny of tap and bottled water quality[1]Mary Cano, “Nanoplastics in Bottled Water,” Columbia University Earth Institute, columbia.edu. In response, North American and Western European households accelerated installation of NSF/ANSI 53- and 401-certified under-sink GAC cartridges, widening retail penetration of connected point-of-use devices that alert users when saturation nears breakthrough. Beverage brands also reacted; Nestlé Waters introduced bamboo-char prefilters at its Pennsylvania plant to curb sub-micron plastics before reverse-osmosis polishing. Although the World Health Organization revised its guidelines to include microplastic monitoring, the absence of binding limits leaves room for premium differentiation. This consumer-led momentum is rippling into utility tenders that now evaluate suppliers on capacity to remove particles below 1 µm, expanding the addressable drinking water adsorbents market.
Rising Demand From Municipal And Industrial Treatment Plants
Urbanization exceeding 3% annually across India, Indonesia, and Saudi Arabia is stretching legacy infrastructure, prompting thousands of plants to retrofit GAC, ion-exchange, and advanced oxidation stages. China’s enforcement of Class IV surface-water standards has already driven ozone-GAC contactor installs in Hebei and Shandong provinces, spearheaded by Beijing Enterprises Water Group. Industrial facilities, particularly semiconductor and pharmaceutical, require ultrapure water with resistivity above 18 MΩ-cm; Taiwan Semiconductor Manufacturing Company’s Arizona campus, operational since late 2024, relies on mixed-bed resins and GAC polishers to meet that spec. These utility and industrial upgrades translate into durable demand that underpins the long-run growth trajectory of the drinking water adsorbents market.
Increasing Adoption Of POU/POE Systems
After the Flint and Jackson lead crises, residential buyers in the United States gravitated toward whole-house POE systems integrating sediment filters, GAC tanks, and UV lamps, with average installed costs dropping to USD 2,200 because of modular “no-plumber” designs. Smart connectivity now differentiates offerings; IoT-enabled flow meters in A.O. Smith’s Aquasana line send smartphone alerts when cumulative loading hits 80% of design life, avoiding contaminant breakthrough. Germany’s TrinkwV 2023, which cut lead action levels to 5 µg/L, is catalyzing similar adoption in multifamily buildings across Berlin and Munich. These shifts are steadily enlarging the consumer slice of the drinking water adsorbents industry.
Stringent PFAS And Emerging-Contaminant Regulations
The U.S. EPA’s 2024 rule fixed a 4-ppt MCL for PFOA and PFOS, compelling more than 6,000 community water systems to retrofit treatment trains by 2031. Parallel EU legislation caps the PFAS sum at 100 ng/L effective January 2026, a tighter bar that has utilities adopting single-use anion-exchange resins alongside GAC “polish” contactors. Japan signaled convergence with provisional 50 ng/L targets announced in 2025. The capital upgrades mandated by these rules are expanding the installed base for premium adsorbents and reactivation services, thereby reinforcing long-term growth of the drinking water adsorbents market.
Restraints Impact Analysis*
| Restraints | (~) % Impact on CAGR Forecast | Geographic Relevance | Impact Timeline |
|---|---|---|---|
| High cost of advanced adsorbent materials | -0.8% | Global, most acute in price-sensitive MEA and South America markets | Medium term (2-4 years) |
| Disposal challenges and environmental burdens | -0.6% | North America and EU (strict hazardous-waste rules); emerging concern in APAC | Long term (≥ 4 years) |
| Feedstock Instability for Premium Activated Carbon | -0.6% | Global supply chains, with acute pressure in APAC and North America reliant on Indonesian coconut shell and Appalachian coal sources | Short term (≤ 2 years) |
| Source: Mordor Intelligence | |||
High Cost Of Advanced Adsorbent Materials
Metal-organic frameworks (MOFs) and graphene oxide currently retail between USD 150 and 300 per kg, compared with USD 2–5 for standard coal-based GAC, limiting adoption to ultrapure-water lines in semiconductor and pharmaceutical facilities that can absorb the premium USP.ORG. Feedstock price volatility compounds the issue; Indonesia’s late-2025 coconut-shell export quota pushed global prices up 18%, forcing Haycarb to commercialize rubber-wood char after kiln retrofits in Sri Lanka BLOOMBERG.COM. Small utilities in price-sensitive South America and MEA, therefore, delay switching from chlorination-only schemes, tempering the near-term expansion of the drinking water adsorbents market.
Disposal Challenges And Environmental Burdens
PFAS-laden spent adsorbents require either high-temperature (≥1,000 °C) incineration or supercritical water oxidation, yet only a dozen U.S. facilities hold relevant permits[2]U.S. Environmental Protection Agency, “Interim Guidance on Destruction and Disposal of PFAS,” epa.gov. Thermal reactivation at 850°C recovers 90% of capacity but concentrates PFAS in off-gas liquor that needs secondary destruction. In the EU, cross-border shipment of hazardous PFAS waste attracts fees above EUR 1,000/ton under the Waste Framework Directive. Although Cabot’s Norit unit is testing metal-recovery from spent GAC to offset costs, the technology does not yet neutralize PFAS, keeping disposal a net drag on the drinking water adsorbents market outlook.
*Our forecasts treat driver/restraint impacts as directional, not additive. The impact forecasts reflect baseline growth, mix effects, and variable interactions.
Segment Analysis
By Material Type: Activated Carbon Dominance Masks MOF Momentum
Activated carbon secured 56.20% of 2025 revenue, underscoring its entrenched role in stripping taste, odor, and a wide spectrum of organics at low cost, while reactivation recovers most capacity with a 70% carbon-footprint saving. Metal organic frameworks are growing with highest CAGR of 5.61% through 2031. Ion-exchange resins serve hardness and nitrate control niches; Purolite’s PFAS-selective A600E resin achieves 40% longer cycles than legacy media. The drinking water adsorbents market size for MOFs remains small but is forecast to widen rapidly as Northwestern University’s MOF-808 achieved 99% PFOA removal with contact times one-tenth those of GAC. Commercialization hurdles persist, yet pilot orders from semiconductor fabs suggest a viable path to scale.
The long-run drinking water adsorbents market share of graphene and carbon-nano adsorbents is capped by prices fifty times higher than GAC, keeping adoption largely in ultrapure loops where organic breakthroughs ruin wafer yields . Bio-based adsorbents such as bamboo char now match 80% of coal-GAC’s iodine number at half the cost, expanding addressable volume in India, Indonesia, and parts of Africa. These options diversify supply chains and offer decarbonization benefits, indicating that material substitution will remain a critical lever shaping future market dynamics.


By Form Factor: Granular Leads, Membrane-Coated Media Gains Traction
Granular media commanded 48.16% of 2025 demand thanks to seamless drop-in compatibility with existing contactors and predictable head-loss profiles. Powdered variants serve taste-and-odor “shock” dosing, while extruded and bead formats align with residential cartridges. The drinking water adsorbents market size for integrated membrane-coated media is poised for 5.56% CAGR growth during 2026-2031 because semiconductor fabs and offshore platforms value the 40% footprint cut validated at a Taiwan electronics plant in 2025.
Carbon-coated hollow-fiber membranes under development by 3M and Mann+Hummel extend service life by combining size-exclusion filtration with adsorption in one element. Certification barriers are modest as long as NSF/ANSI 61 leachate criteria are met, so rapid commercialization is likely once field data corroborate pilot results. In residential POU units, form-factor choice increasingly hinges on maintenance convenience; quick-swap carbon blocks with twist-fit housings are gaining share at the expense of traditional loose-fill cartridges, reshaping aftermarket revenue streams in the drinking water adsorbents market.
By Contaminant Target: PFAS Dominates, Microplastics Surge
PFAS removal generated 34.27% of 2025 spend after the U.S. EPA and EU imposed record-low limits, triggering wholesale upgrades at more than 6,000 utilities. Ion-exchange resins capture high-influx streams, while GAC polishes to single-digit ppt compliance. Yet the fastest-growing slice of the drinking water adsorbents market is micro- and nanoplastic removal, projected at a 5.71% CAGR through 2031 after Columbia University detected up to 240,000 particles per liter in bottled water.
Conventional GAC retains particles above 1µm, but biochar’s irregular pore geometry shows early-stage promise for sub-micron capture, providing a low-cost route for brands looking to differentiate on “plastic-free” claims. Heavy-metal and radionuclide mitigation remains an evergreen segment in Asia and Latin America, where groundwater arsenic and fluoride exceed WHO limits; subsidized household filters in West Bengal exemplify public-health-driven adoption.
By Application: Municipal Dominates, Portable Units Accelerate
Municipal plants produced 41.30% of 2025 revenue because of sheer treated volumes and regulations that now encompass PFAS, DBPs, and emerging organics. The U.S. Infrastructure Investment and Jobs Act’s USD 50 billion allocation through 2026 is already funding GAC and membrane upgrades. Conversely, portable and emergency purification units are the fastest-growing application at 5.45% CAGR through 2031 as relief agencies deploy carbon-plus-membrane units in disaster zones from Türkiye to the Horn of Africa.
Demand for residential POU/POE systems is driven by falling unit prices and smart-sensor features, while industrial ultrapure-water loops at TSMC and Samsung fabs underpin steady 4.6% gains. Bottled-water plants remain niche but high-margin, with premium labels adopting “activated-carbon-polished” positioning to justify 30–50% shelf premiums. Together, these varied applications diversify revenue channels and buffer the drinking water adsorbents market against cyclical shocks in any single end-user group.
Geography Analysis
Asia-Pacific, accounting for 37.90% of 2025 turnover, will remain the revenue leader through 2031 as India’s Jal Jeevan Mission and China’s city-level mandates finance thousands of GAC and ion-exchange retrofits. ASEAN countries are following suit; Jakarta’s USD 120 million Veolia contract will lift coverage to 2.5 million residents. Semiconductor expansion in South Korea and Japan is boosting ultrapure-water resin demand, while provisional PFOS/PFOA targets of 50 ng/L will catalyze further adsorbent adoption.
The Middle East and Africa region is forecast to clock a 5.64% CAGR through 2031, the fastest globally, underpinned by Saudi Arabia’s USD 3.2 billion upgrades at Ras Al-Khair and Shoaiba desalination complexes. South Africa’s ZAR 1.8 billion (~USD 0.11 billion) GAC retrofits at Rand Water facilities highlight the continent’s pivot toward advanced treatment. Humanitarian demand is also material; UNICEF has already distributed 50,000 LifeStraw units across drought-hit Kenya and Ethiopia.
North America market growth is anchored by the EPA’s PFAS rule, which is funneling an estimated USD 1.5 billion per year into treatment upgrades. Calgon Carbon’s 27-million-lb Columbus expansion and Evoqua’s sensor-enabled SmartGuard platform position domestic suppliers to capture the spend. Canada’s draft PFAS guideline and Mexico’s arsenic mitigation programs add incremental volume, solidifying the region’s consistent demand base.
Europe faces the strictest PFAS cap worldwide at 100 ng/L, pushing utilities in Germany, Spain, and Italy to fast-track GAC and resin retrofits. Kemira’s Tarragona reactivation hub will process 15,000 tons/year of spent carbon, reducing disposal costs that exceed EUR 1,000/ton (~USD 1,170/ton). The U.K.’s lower lead action level has simultaneously driven POE filter adoption in older housing stock.
South America remains a smaller but growing market, roughly 8% of 2025 sales. Brazil’s BRL 500 million (~USD 99.65 million) GAC upgrade for São Paulo’s Guarapiranga supply and Argentina’s World Bank-funded arsenic projects illustrate rising environmental stringency. Chile’s turbidity rule tightened in 2024, spurring CAPEX at utilities in the Santiago basin.

Competitive Landscape
The drinking water adsorbents market is moderately fragmented. Scale players concentrate on reactivation capacity; Calgon’s Ohio expansion and Kemira’s forthcoming Spanish hub together add 42,000 tons/year of thermal processing, locking in long-term service revenues. Feedstock integration remains a hedge against volatility: Calgon owns Appalachian coal mines while Cabot’s Norit division secures coconut shell in Indonesia and the Philippines.
Technology disruptors are nibbling at premium slices of the drinking water adsorbents market. Sixth Wave Innovations’ IXOS polymer shows tenfold PFAS capacity versus conventional resins, and Framergy’s zirconium-MOF pellets are on trial at U.S. Air Force bases. Hybrid membrane-carbon cartridges patented by 3M and Mann+Hummel cut change-out cycles by 50%, providing labor savings prized in African and Latin American decentralized systems. Digital overlays are fast becoming table stakes; Evoqua’s SmartGuard and Xylem’s Sentryx platforms apply machine learning to breakthrough prediction, cutting operating costs 15% against calendar-based replacements.
Sustainability credentials are gaining weight in tender evaluations. ISO 14001 certification for reactivation plants remains rare, yet early adopters promote lower life-cycle emissions to secure EU utility contracts. Circular-economy pilots recovering metals from spent GAC are underway at Cabot, while Haycarb’s rubber-wood char unlocks non-food biomass streams to reduce feedstock pressure. These moves illustrate how ESG imperatives are reshaping supplier scorecards and competitive trajectories across the drinking water adsorbents market.
Drinking Water Adsorbents Industry Leaders
Cabot Corporation
Lanxess
Calgon Carbon Corporation
Haycarb PLC
Purolite
- *Disclaimer: Major Players sorted in no particular order

Recent Industry Developments
- February 2026: Kemira approved a EUR 20 million (~USD 23.40 million) activated-carbon reactivation plant in Tarragona, Spain, slated for Q3 2029 start-up.
- September 2025: Haycarb began a 5,000 tons/year rubber-wood biochar line in Ratnapura, Sri Lanka, securing initial orders from Indian utilities.


Global Drinking Water Adsorbents Market Report Scope
Drinking water adsorbents, such as activated carbon, zeolites, and alumina, are porous materials used in industrial and household filtration systems. They purify water by trapping contaminants like heavy metals, chlorine, pesticides, and organic compounds through physical or chemical attachment.
The drinking water adsorbents market is segmented by material type, form factor, contaminant target, and application. By material type, the market is segmented into activated carbon, zeolites, ion-exchange resins, graphene and carbon-nano adsorbents, metal-organic frameworks (MOFs), and bio-based adsorbents (biochar, bamboo-char, etc.). By form factor, the market is segmented into powdered, granular, extruded /bead, and integrated membrane-coated media. By contaminant target, the market is segmented into organic micropollutants (VOC, pesticides), PFAS and fluorinated compounds, heavy metals and radionuclides, and micro-/nano-plastics. By application, the market is segmented into municipal water treatment, residential POU/POE systems, industrial process and utility water, bottled and packaged drinking water processing, and portable and emergency purification units. The report also covers the market size and forecasts for the drinking water adsorbents market in 17 countries across major regions. For each segment, the market sizing and forecasts have been done based on revenue (USD).
| Activated Carbon |
| Zeolites |
| Ion-Exchange Resins |
| Graphene and Carbon-Nano Adsorbents |
| Metal-Organic Frameworks (MOFs) |
| Bio-Based Adsorbents (Biochar, Bamboo-char, etc.) |
| Powdered |
| Granular |
| Extruded/Bead |
| Integrated Membrane-Coated Media |
| Organic Micropollutants (VOC, Pesticides) |
| PFAS and Fluorinated Compounds |
| Heavy Metals and Radionuclides |
| Micro-/Nano-Plastics |
| Municipal Water Treatment |
| Residential POU/POE Systems |
| Industrial Process and Utility Water |
| Bottled and Packaged Drinking Water Processing |
| Portable and Emergency Purification Units |
| Asia-Pacific | China |
| Japan | |
| India | |
| South Korea | |
| ASEAN Countries | |
| Rest of Asia-Pacific | |
| North America | United States |
| Canada | |
| Mexico | |
| Europe | Germany |
| United Kingdom | |
| France | |
| Italy | |
| Spain | |
| Russia | |
| Nordic Countries | |
| Rest of Europe | |
| South America | Brazil |
| Argentina | |
| Rest of South America | |
| Middle-East and Africa | Saudi Arabia |
| South Africa | |
| Rest of Middle-East and Africa |
| By Material Type | Activated Carbon | |
| Zeolites | ||
| Ion-Exchange Resins | ||
| Graphene and Carbon-Nano Adsorbents | ||
| Metal-Organic Frameworks (MOFs) | ||
| Bio-Based Adsorbents (Biochar, Bamboo-char, etc.) | ||
| By Form Factor | Powdered | |
| Granular | ||
| Extruded/Bead | ||
| Integrated Membrane-Coated Media | ||
| By Contaminant Target | Organic Micropollutants (VOC, Pesticides) | |
| PFAS and Fluorinated Compounds | ||
| Heavy Metals and Radionuclides | ||
| Micro-/Nano-Plastics | ||
| By Application | Municipal Water Treatment | |
| Residential POU/POE Systems | ||
| Industrial Process and Utility Water | ||
| Bottled and Packaged Drinking Water Processing | ||
| Portable and Emergency Purification Units | ||
| By Geography | Asia-Pacific | China |
| Japan | ||
| India | ||
| South Korea | ||
| ASEAN Countries | ||
| Rest of Asia-Pacific | ||
| North America | United States | |
| Canada | ||
| Mexico | ||
| Europe | Germany | |
| United Kingdom | ||
| France | ||
| Italy | ||
| Spain | ||
| Russia | ||
| Nordic Countries | ||
| Rest of Europe | ||
| South America | Brazil | |
| Argentina | ||
| Rest of South America | ||
| Middle-East and Africa | Saudi Arabia | |
| South Africa | ||
| Rest of Middle-East and Africa | ||


Key Questions Answered in the Report
What is the projected value of the drinking water adsorbents market by 2031?
The Drinking Water Adsorbents Market size is expected to increase from USD 3.42 billion in 2025 to USD 3.55 billion in 2026 and reach USD 4.35 billion by 2031, growing at a CAGR of 4.15% over 2026-2031.
Which material currently leads global demand?
Activated carbon holds 56.20% of 2025 revenue, making it the dominant material.
Why are PFAS regulations boosting adsorbent sales?
New limits of 4 ppt in the U.S. and 100 ng/L in the EU require utilities to add adsorbent stages to meet compliance.
Which region is expected to grow fastest through 2031?
The Middle East and Africa region is projected to record the highest CAGR at 5.64% during 2026-2031.
How are portable units influencing the market?
Disaster-relief and remote-area deployments are driving a 5.45% CAGR in portable purification demand. during 2026-2031.
What role does reactivation play in supplier strategy?
Thermal reactivation recovers up to 90% of spent carbon’s capacity and secures service revenue, so leading vendors are expanding reactivation plants.
Page last updated on:


