
Market Overview
| Study Period | 2020 - 2031 |
|---|---|
| Forecast Data Period | 2026 - 2031 |
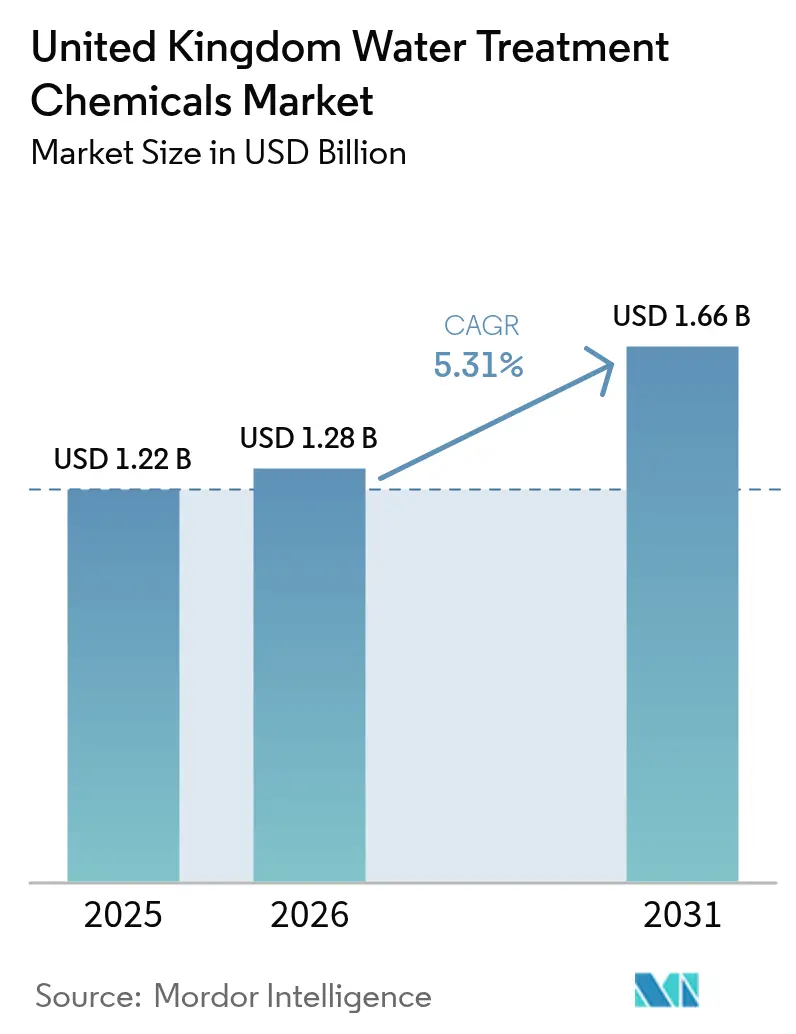
| Base Year Market Size (2025) | USD 1.22 Billion |
| Market Size (2026) | USD 1.28 Billion |
| Market Size (2031) | USD 1.66 Billion |
| Growth Rate (2026 - 2031) | 5.31 % |
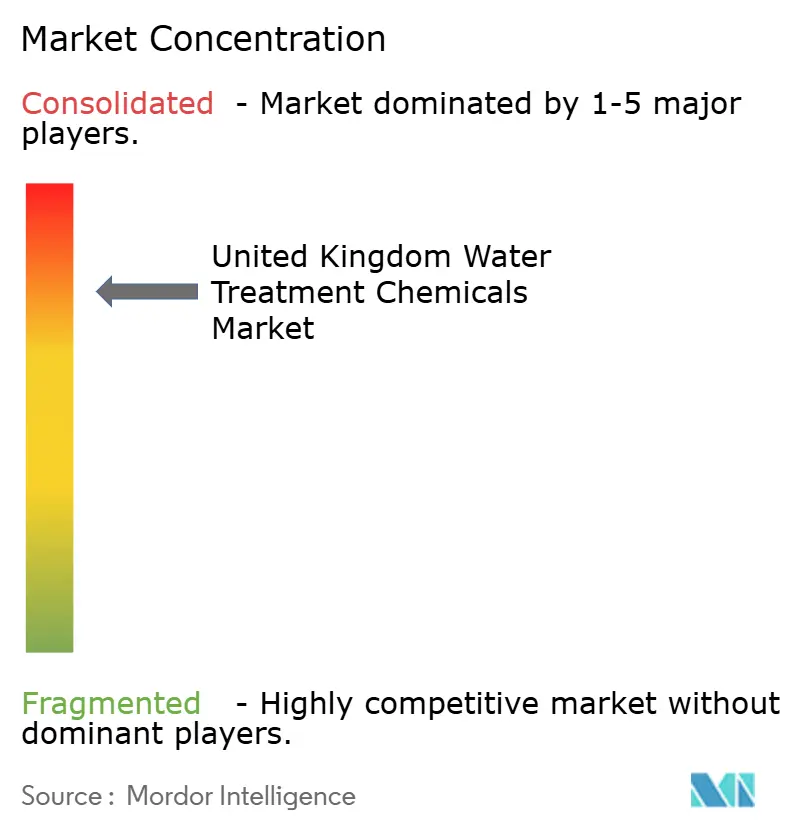
| Market Concentration | High |
Major Players *Disclaimer: Major Players sorted in no particular order Image © Mordor Intelligence. Reuse requires attribution under CC BY 4.0. | |
United Kingdom Water Treatment Chemicals Market Analysis by Mordor Intelligence
The United Kingdom Water Treatment Chemicals Market size was valued at USD 1.22 billion in 2025 and estimated to grow from USD 1.28 billion in 2026 to reach USD 1.66 billion by 2031, at a CAGR of 5.31% during the forecast period (2026-2031). Robust public-sector spending, dual-track regulatory pressures, ongoing industrial transformation, and mounting sustainability mandates converge to propel the United Kingdom water treatment chemicals market over the outlook period. Stricter discharge rules, aging Victorian pipework, and mandatory reuse targets compel utilities and industries to adopt higher-performance chemistries that meet tighter effluent limits while lowering lifetime costs. At the same time, feedstock price swings and hazardous-chemical phase-outs squeeze margins, reinforcing the strategic value of digital dosing and real-time monitoring that curb over-consumption. Suppliers that blend technical documentation expertise with data-enabled services gain a decisive edge in municipal tenders, while niche innovators focused on PFAS remediation and circular-water loops capture premium sub-segments in the United Kingdom water treatment chemicals market.
Key Report Takeaways
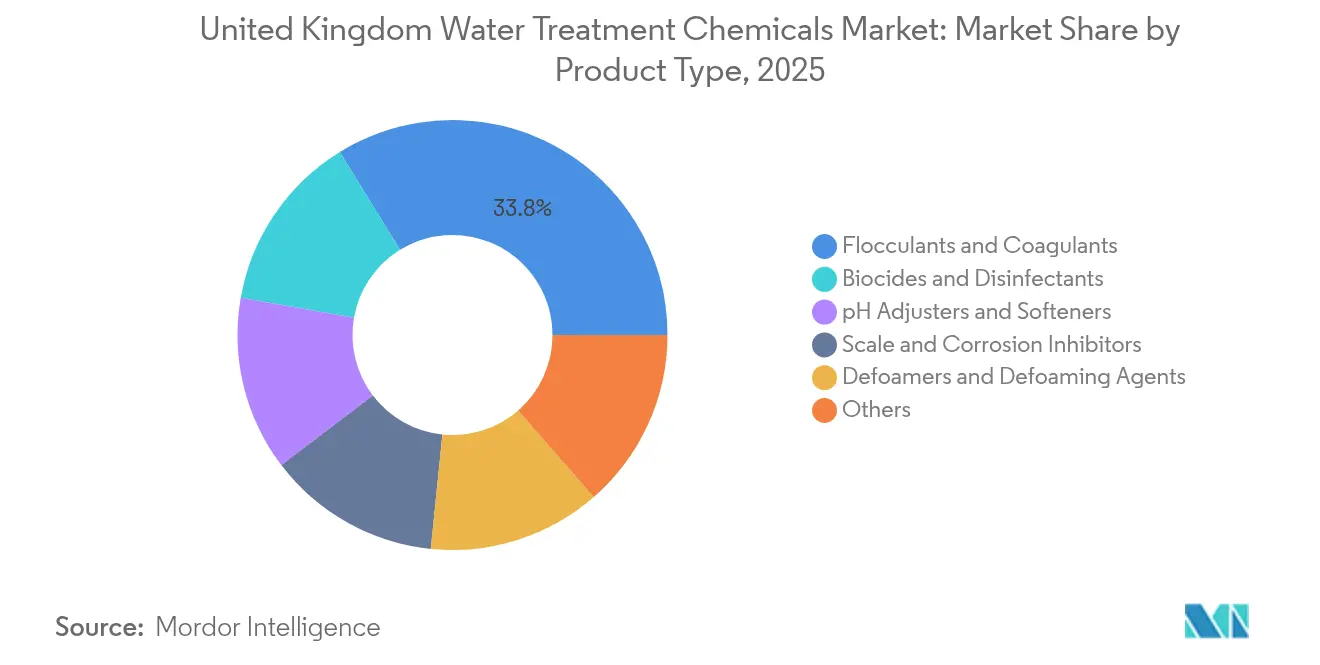
- By product type, flocculants and coagulants captured 33.78% of the United Kingdom water treatment chemicals market share in 2025. Biocides and disinfectants are projected to expand at the fastest 5.72% CAGR through 2031, underpinning pathogen control and PFAS oxidation demand.
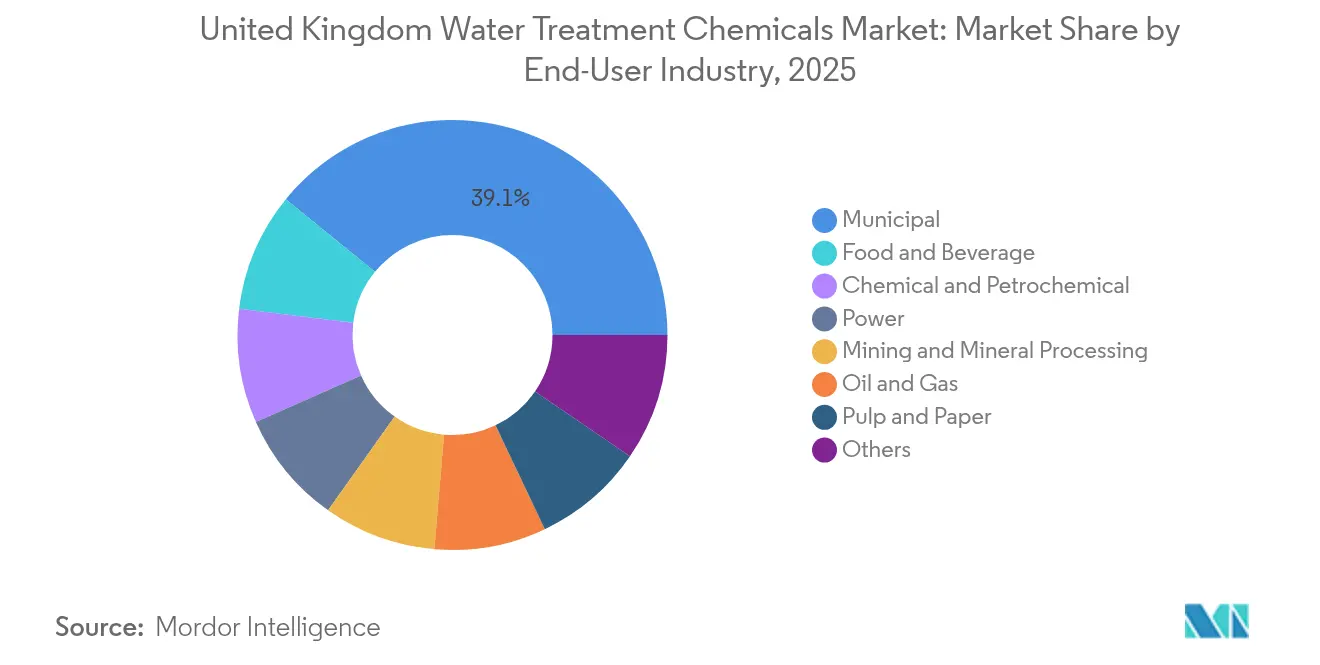
- By end-user industry, municipal applications held 39.12% revenue share of the United Kingdom water treatment chemicals market size in 2025, while food and beverage is set to post the highest 5.96% CAGR to 2031.
Note: Market size and forecast figures in this report are generated using Mordor Intelligence’s proprietary estimation framework, updated with the latest available data and insights as of 2026.
United Kingdom Water Treatment Chemicals Market Trends and Insights
Drivers Impact Analysis*
| Driver | (~) % Impact on CAGR Forecast | Geographic Relevance | Impact Timeline |
|---|---|---|---|
| Stringent United Kingdom and EU wastewater discharge limits | +1.20% | UK-wide with EU alignment requirements | Medium term (2-4 years) |
| Ageing water infrastructure renewal wave | +0.80% | National, concentrated in urban centers | Long term (≥ 4 years) |
| Mandatory industrial-water reuse targets | +1.10% | Industrial regions, manufacturing corridors | Medium term (2-4 years) |
| Craft-brewery boom driving specialty antifoams | +0.90% | Scotland, Northern England clusters | Short term (≤ 2 years) |
| Digital dosing and real-time monitoring uptake | +0.60% | Major utilities and industrial facilities | Medium term (2-4 years) |
| Source: Mordor Intelligence | |||
Stringent United Kingdom and European Union Wastewater Discharge Limits
Tighter UK and EU discharge thresholds elevate compliance costs and favor suppliers able to furnish exhaustive technical dossiers that satisfy both UK REACH and legacy EU criteria. The Environment Agency’s validation stage for complex waste permits, effective June 2024, ratchets scrutiny, while the Drinking Water Inspectorate’s incoming January 2025 PFAS ceiling of 0.1 µg/L adds fresh impetus for specialized oxidants and adsorbents[1]Binder Ltd., “British Water Archives,” binder.co.uk . Water companies increasingly shortlist vendors on proof of PFAS removal efficacy and chlorate control, narrowing the competitive field. Industrial dischargers, especially pharmaceuticals and food processors, now seek turnkey chemical packages capable of meeting haloacetic-acid caps without process downtime. Consequently, the United Kingdom water treatment chemicals market witnesses a migration from commodity pricing to performance-assured contracts anchored in documented contaminant reduction.
Ageing Water Infrastructure Renewal Wave
Ofwat’s AMP8 blueprint allocates GBP 104 billion (USD 132.1 billion) for network upgrades through 2030, ensuring a multi-year demand runway for corrosion inhibitors, scale suppressants, and coagulants. Victorian mains in London and Manchester necessitate higher-dosage protection chemistry, whereas newer Midlands plants incorporate energy-optimized formulations. Utilities weigh whole-life asset costs over upfront reagent price, spurring bids that bundle chemical supply with predictive maintenance sensors. Framework deals such as Thames Water’s GBP 34 million procurement and Southern Water’s GBP 104 million chemicals contract reinforce long-term volume visibility for incumbents in the United Kingdom water treatment chemicals market.
Mandatory Industrial-Water Reuse Targets
Resource-efficiency directives embedded in Environment Agency permits oblige factories to recycle higher ratios of process water, fostering demand for advanced coagulant-biocide trains that safeguard closed-loop quality. Demonstration projects under the EU-funded AquaSPICE initiative verified 30%-plus freshwater savings at UK chemical plants using tailored flocculants and membrane-compatible antiscalants. Manufacturers now benchmark suppliers on their ability to certify reuse-friendly chemistries with low residual toxicity. As corporate water stewardship metrics enter ESG reporting, integrated chemical-digital offerings that log reuse performance gain traction, enlarging the addressable slice of the United Kingdom water treatment chemicals market.
Craft-Brewery Boom Driving Specialty Antifoams
The 2,400-strong UK craft-brewery estate consumes between 3 and 10 L of water per liter of beer, producing wastewater rich in foam-forming proteins and COD above 2,000 mg/L. Specialty bio-based antifoams tailored to brewery effluent witness double-digit order growth, with Southern Water earmarking GBP 2 million for such agents in its chemicals framework. Regional clustering in Scotland and Northern England reduces distribution costs for responsive suppliers. Craft brewers’ sustainability ethos further tilts preference toward plant-derived defoamers, opening a lucrative niche within the wider United Kingdom water treatment chemicals market.
Restraints Impact Analysis*
| Restraint | (~) % Impact on CAGR Forecast | Geographic Relevance | Impact Timeline |
|---|---|---|---|
| Hazardous-chemical phase-outs (e.g., hydrazine) | -0.70% | UK-wide regulatory compliance | Short term (≤ 2 years) |
| Volatile petro-feedstock prices | -0.40% | Global supply chains affecting UK market | Short term (≤ 2 years) |
| Shift to physical disinfection (UV, ozone) | -0.50% | UK-wide, concentrated in municipal and industrial facilities | Medium term (2-4 years) |
| Source: Mordor Intelligence | |||
Hazardous-Chemical Phase-Outs
UK REACH alignment with EU substitution protocols accelerates the retirement of hydrazine oxygen scavengers and high-toxicity biocides[2]European Chemicals Agency, “Guidance on Substitution under REACH,” echa.europa.eu. Plants face transitional inefficiencies as they validate alternative blends, temporarily dampening volume growth in the United Kingdom water treatment chemicals market. Suppliers investing in R&D for low-toxin corrosion inhibitors and PFAS-free surfactants offset revenue loss, but laggards reliant on legacy formulations risk share erosion. Certification backlogs add to near-term uncertainty.
Volatile Petro-Feedstock Prices
Acrylamide monomer, a key flocculant precursor, tracked Brent crude swings by up to 37% through 2024, inflating polymer costs for UK buyers. Currency depreciation compounds input stress, prompting utilities to lock multi-year contracts with indexed price caps. Feedstock turbulence nudges procurement teams toward bio-sourced polymers and waste-plastic-derived coagulants, a still-nascent yet strategic frontier inside the United Kingdom water treatment chemicals market.
*Our forecasts treat driver/restraint impacts as directional, not additive. The impact forecasts reflect baseline growth, mix effects, and variable interactions.
Segment Analysis
By Product Type: Flocculants Lead Market Consolidation
Flocculants and coagulants commanded 33.78% of the United Kingdom water treatment chemicals market share in 2025, underpinned by their indispensability in primary clarification and sludge dewatering. Kemira’s twin capacity expansions—increasing Goole ferric output by 100,000 t/y and Ellesmere Port aluminum coagulants by 30,000 t/y—illustrate the economies of scale shaping this segment. The United Kingdom water treatment chemicals market size for flocculants is poised to climb steadily as AMP8 plants come online and industrial retrofits intensify.
Commodity status is rapidly giving way to formulation sophistication, with multi-functional blends integrating charge neutralization and odor control in one SKU. Meanwhile, biocides and disinfectants headline growth at a 5.72% CAGR, spurred by PFAS oxidation trials and tighter chlorate caps. Defoamers evolve from silicone-based to bio-derived variants to satisfy brewer sustainability pledges. Scale and corrosion inhibitors benefit from pipeline replacement, yet must pivot away from phosphonate chemistries facing eutrophication scrutiny. Suppliers able to validate green alternates capture share inside the technologically advancing United Kingdom water treatment chemicals market.



By End-user Industry: Municipal Dominance Faces Food Sector Challenge
Municipal utilities absorbed 39.12% of 2025 volumes thanks to statutory drinking-water standards and predictable framework contracts. Ofwat-mandated service-quality metrics drive consistent demand, cementing long-run channel stability within the United Kingdom water treatment chemicals market. Conversely, the food and beverage sector emerges as a 5.96% CAGR hotspot through 2031, catalyzed by craft-brewery proliferation and dairy effluent limits.
Power generation continues large-scale consumption of ammonia and phosphate alternatives for condensate treatment, while oil and gas relies on biocide packages for produced-water reinjection compliance. Mining, pulp and paper, and chemicals sectors integrate water-reuse loops that require low-fouling chemistries compatible with membrane processes. Industrial buyers increasingly favor suppliers bundling chemical supply with onsite service technicians and performance dashboards, reflecting heightened complexity of effluent permits. Collectively, these dynamics diversify revenue streams across the broad United Kingdom water treatment chemicals market.
Geography Analysis
Regional disparities in pipe age, industrial heritage, and regulatory oversight sculpt nuanced demand patterns across England, Wales, Scotland, and Northern Ireland. London and the Southeast account for the largest single-region revenue slice, anchored by Thames Water’s customer base of 10 million and dense commercial activity that necessitates high coagulant volumes. North-west England ranks next, where chemical-industry clusters and aged sewers elevate corrosion-inhibitor uptake in the United Kingdom water treatment chemicals market.
Scotland’s vertically integrated Scottish Water favors multi-year partnership contracts emphasizing carbon intensity metrics, creating openings for bio-based polymer suppliers. Wales tackles legacy mine drainage with iron-precipitation chemistries, while maintaining stringent river-basin objectives. Northern Ireland’s more compact grid, managed by NI Water, prizes vendors delivering turnkey packages that blend chemical supply with telemetry. Across regions, Brexit-induced dual-regime compliance (UK REACH plus residual EU engagements) manifests unevenly; ports such as Liverpool face longer customs dwell times, nudging local stocking strategies.
Geographic clusters correlate with end-user specializations: Yorkshire’s textile mills prefer color-adsorption agents, whereas Scotland’s brewery belt demands antifoams. These micro-patterns enrich the mosaic that is the United Kingdom water treatment chemicals market, enabling nimble suppliers to tailor distribution and technical service routes region by region.
Value Chain Analysis
The value chain starts with upstream feedstocks and intermediates such as ferric sulphate, aluminium salts, acrylamide-based polymer precursors, sodium hypochlorite, sulphuric acid, chlorine, ammonium sulphate, and hydrogen peroxide. These are then formulated and blended into products including coagulants and flocculants, biocides and disinfectants, pH adjusters, antiscalants, corrosion inhibitors, and defoamers.
In the UK, supply is supported by a mix of local manufacture and imported raw materials routed through chemical logistics networks, with notable production footprints in Cheshire and Merseyside. This includes Kemira facilities at Ellesmere Port for aluminium coagulants, Bradford for polymers, and Goole for ferric sulphate, alongside distribution through bulk tanker delivery, packaged chemicals, and onsite storage managed under service contracts. Midstream, chemical suppliers compete on formulation performance as well as documentation and quality assurance, since drinking-water chemicals and media must meet British-adopted standards (BS EN) and/or satisfy the Drinking Water Inspectorate (DWI) Regulation 31 approval process, while wastewater and trade effluent applications operate under permit-driven composition constraints. Downstream demand is led by water and wastewater utilities that increasingly procure via multi-year frameworks for security of supply (for example, sodium hypochlorite, sulphuric acid, and ferric sulphate), while industrial customers (food and beverage, chemicals, power, and oil and gas) buy bundled chemical-plus-service programs aligned to reuse and discharge targets. Key bottlenecks include logistics resilience and compliance transitions: UK supply chain bodies flagged road haulage capacity constraints and staffing pressures in 2025, alongside uncertainty around UK REACH implementation. These conditions raise the value of multi-source qualification, local stocking, and digitally monitored dosing that reduces consumption volatility.
Competitive Landscape
The United Kingdom water treatment chemicals market exhibits consolidated concentration. Service sophistication rather than reagent price constitutes the main battlefield; Kemira’s Norit reactivation acquisition and 130,000 t/y expansion accentuate capital intensity barriers. BASF, meanwhile, focuses on digital twins that calibrate coagulant feed in real time, reducing alum residuals by 18% at pilot sites.
White-space contenders such as Puraffinity secure GBP 16.93 million to scale precision PFAS adsorbents, signaling venture-capital appetite for point-solution disruptors. Still, stringent DWI product approvals slow rapid scaling, cushioning incumbents. Partnerships between chemical majors and sensor firms proliferate; Ecolab’s collaboration with Siemens bundles 24/7 quality analytics with reagent consumption KPIs, promising 10% sludge-cake reduction. Ultimately, vendors that embed chemical expertise within data platforms fortify stickiness across the competitive United Kingdom water treatment chemicals market.
United Kingdom Water Treatment Chemicals Industry Leaders
Ecolab
Kemira
Solenis
Veolia Water Solutions & Technologies
SNF
- *Disclaimer: Major Players sorted in no particular order

Market Opportunities and Future Outlook
Utility investment programs and permitting scrutiny are creating whitespace for suppliers that can pair chemicals with engineered dosing upgrades, monitoring, and auditable compliance support. Ofwat AMP8 funding of GBP 104 billion through 2030 supports a multi-year pipeline of treatment upgrades, and recent procurement points to near-term pull-through for higher-value chemical systems. For instance, in February 2026, Thames Water awarded a GBP 280 million contract covering primary and secondary chemical dosing system upgrades at Maple Lodge STW. Separately, United Utilities awarded a five-year framework in August 2025 for strategic process chemicals, including sodium hypochlorite, sulphuric acid, and ferric sulphate, reinforcing the opportunity for incumbents and qualified challengers to win share via supply assurance, service coverage, and performance-based contracting.
Policy-led reform and emerging contaminant focus are also expanding premium sub-segments beyond commodity coagulants. In February 2026, Defra published a new Water White Paper that highlights critical supply chain assessment with attention to chemicals, and Defra also issued a PFAS plan in February 2026 that expands monitoring requirements and consults on future statutory limits. Together, these developments support demand for specialist adsorbents, oxidants, and low-residual chemistries that can be supported with robust technical dossiers. Process design changes in wastewater treatment also affect the chemicals mix. In February 2026, DuPont secured an MBR technology contract for United Utilities, which points to more membrane-integrated treatment trains and increases the need for membrane-compatible coagulants, antiscalants, and biocide regimes, along with digital dosing to manage fouling risk and optimize total chemical use.
Recent Industry Developments
- April 2026: Veolia completed the installation and commissioning of two AnoxKaldnes moving bed biofilm reactor (MBBR) systems for Severn Trent Water at Clowne, Derbyshire, to meet tighter phosphorus (0.2 mg/L) and ammonia (4 mg/L) permit requirements. The upgrade changes treatment performance demands and feeds into the chemical program for nutrient compliance, polishing, and process stability. It also strengthens Veolia's position in integrated solutions where chemicals, biological process upgrades, and monitoring are sold together.
- December 2025: Ecolab closed the acquisition of Ovivo's electronics ultrapure water business. The deal broadens Ecolab's circular water management and high-purity water capabilities, adding advanced treatment know-how that complements chemical dosing and services. This expands cross-industry reach, especially where ultrapure and reuse requirements tighten procurement criteria beyond commodity chemical supply.
- September 2024: Kemira completed the acquisition of Purton Carbons Limited, Norit's UK reactivation business, entering activated carbon for micropollutant removal. Adding reactivated carbon strengthens Kemira's portfolio for emerging contaminants and supports utility tenders that require evidence-backed performance on trace pollutants. The acquisition also tightens competitive dynamics by linking coagulant and polymer supply with adsorption-based polishing options under one supplier relationship.


Research Methodology Framework and Report Scope
Market Definition and Coverage
For this report, the market covers the value of chemicals used to condition, treat, and protect water and water systems across the United Kingdom, spanning municipal water and wastewater as well as industrial water uses.
Scope exclusions: This sizing does not include water treatment equipment, membranes, dosing pumps, monitoring hardware, or outsourced water treatment services.
Segmentation Overview
- By Product Type
- Flocculants and Coagulants
- Biocides and Disinfectants
- Defoamers and Defoaming Agents
- pH Adjusters and Softeners
- Scale and Corrosion Inhibitors
- Others
- By End-user Industry
- Power
- Oil and Gas
- Chemical and Petrochemical
- Mining and Mineral Processing
- Municipal
- Food and Beverage
- Pulp and Paper
- Others
Data Sources, Market Sizing, and Validation
Desk Research
Desk research was used to set the UK country context and build clean input ranges before any modeling started. We relied on public UK water and environment releases, including regulator and national statistics publications, as well as utility performance dashboards. We also pulled in notes tied to UK legislation that affects chemical usage intensity.
To keep the model tied to real consumption behavior, we reviewed technical references and safety documentation, including peer-reviewed papers, standards body publications, and chemical classification guidance. We also checked company annual reports, investor decks, and credible press coverage on treatment upgrades. Where needed, paid subscriptions that compile company financials, patent records, and import or export shipment data were used to cross-check revenue direction and supplier activity. This list is illustrative only, and many other sources were reviewed for data capture, validation, and clarification.
Primary Interviews and Surveys
Primary work focused on validating how chemical demand changes by end use, and which product groups are gaining or losing share as water companies and industrial plants respond to tighter discharge limits. Interviews and surveys were conducted with manufacturers, distributors, EPC and service participants, and large end users across the United Kingdom to confirm volume drivers, pricing practices, and typical contract reset timing.
Across interviews, assumptions were stress-tested around treatment intensity, substitution between chemistries, and pass-through of raw material swings, then reconciled back to desk indicators to close gaps in the model.
Distribution of primary research fieldwork respondents
| Company type | Respondent position |
|---|---|
| Top tier: 37% | CXOs: 16% |
| Mid tier: 43% | Functional/Unit leaders: 36% |
| Smaller Players: 20% | Managers: 48% |
Market-Sizing & Forecasting
The sizing starts with a top-down build where we reconstruct the addressable chemicals demand pool from UK treated water and wastewater volumes, industrial water use patterns, and typical dosing intensity by application, then convert that into value through blended price bands. Selective bottom-up checks are added so totals remain realistic, including supplier revenue direction, channel feedback on product mix, and sampled price-times-volume sanity checks for high-use chemistries.
Key inputs tracked include municipal capex and opex signals tied to compliance, wastewater load indicators that drive coagulant and polymer use, cooling and boiler water activity in power and process industries, biocide and disinfectant usage patterns, and the pace of changes in scale and corrosion control programs. For pricing, we used a simple ASP logic that reflects contract structures and reset cycles rather than assuming a single flat inflation curve.
Forecasting uses scenario analysis, where macro drivers, regulatory tightening, and industrial output assumptions are varied, then aligned to what primary respondents see as plausible adoption and pricing paths for 5-year planning.
Data Validation & Update Cycle
Model outputs were checked against independent signals such as utility spending direction, industrial activity markers, and the expected shift in product mix by end use, followed by outlier review at the product and end-user level. If a variance appeared large, we rechecked the input ranges, re-ran sensitivity cases, and in some instances re-contacted respondents to confirm whether the gap was driven by scope, timing, or pricing.
Before sign-off, the full workbook is reviewed in steps so assumption changes remain traceable and totals reconcile across views. Reports are refreshed annually, with interim updates when material events occur, including regulation changes, major contract resets, or sharp feedstock moves. Right before delivery, a final pass is completed so clients receive the most current view available.
Mordor Intelligence's United Kingdom Water Treatment Chemicals Market Market Size Compared Against Other Published Estimates
Different published numbers for this market typically come from timing and pricing choices as much as from scope. If one estimate uses an older base year, a different exchange-rate point, or a blended price curve that does not reflect contract resets, the total can drift even when the same end users are being discussed.
In this study, the refresh cadence and currency timing are kept consistent with the base year and stress-tested through validation calls. That discipline is a key reason the 2025 value reported by Mordor Intelligence does not match figures that lean on older ASP assumptions or longer update cycles.
Benchmark comparison
| Source | Market Size | Gaps in Research Methodology |
|---|---|---|
| Mordor Intelligence | USD 1.22 B (2025) | |
| Industry Publisher A | USD 1.69 B (2024) | Uses a 2024 base and a longer forecast window, and the total appears sensitive to higher blended pricing, which can happen when older contract pricing and currency timing are not aligned to the report base year. |
| Global Publisher B | USD 1.28 B (2026) | Starts the series from a later year, which can compress or expand the implied growth path depending on how step-changes like compliance-driven upgrades are treated between 2025 and 2026. |
Overall, the spread is mainly explained by base-year selection, how ASPs are rolled forward, and whether the model is re-checked against recent utility and industrial signals. By keeping inputs traceable to treated volumes, dosing intensity, and price-reset logic, the final number stays easier to reproduce and interpret for planning.


Key Questions Answered in the Report
What is the projected value of the United Kingdom water treatment chemicals market by 2031?
The market is forecast to reach USD 1.66 billion by 2031.
Which product category leads revenue share?
Flocculants and coagulants led with 33.78% market share in 2025.
Which end-user segment is growing fastest?
Food and beverage is expected to register a 5.96% CAGR between 2026-2031.
How will PFAS regulations affect chemical demand?
The January 2025 PFAS limit of 0.1 µg/L will spur uptake of specialized adsorbents and oxidants across utilities.
Why are digital dosing systems gaining traction?
Utilities adopting sensor-driven dosing report 8%-12% chemical savings and improved compliance consistency.
What challenges do suppliers face with hazardous-chemical phase-outs?
REACH-aligned restrictions on hydrazine and other toxic agents require R&D into safer alternatives and re-certification of formulations.
Page last updated on:


 Your data is secure and never sold or shared.


