Direct Reduced Iron Market Size and Share
Market Overview
| Study Period | 2019 - 2030 |
|---|---|
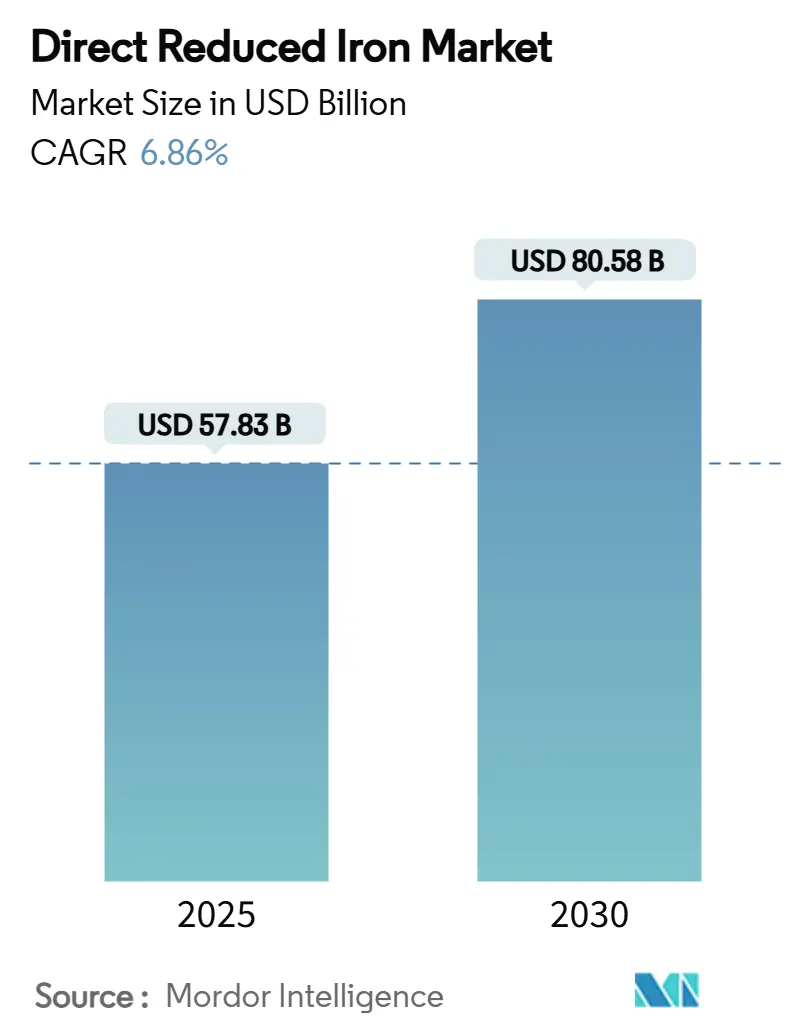
| Market Size (2025) | USD 57.83 Billion |
| Market Size (2030) | USD 80.58 Billion |
| Growth Rate (2025 - 2030) | 6.86% CAGR |
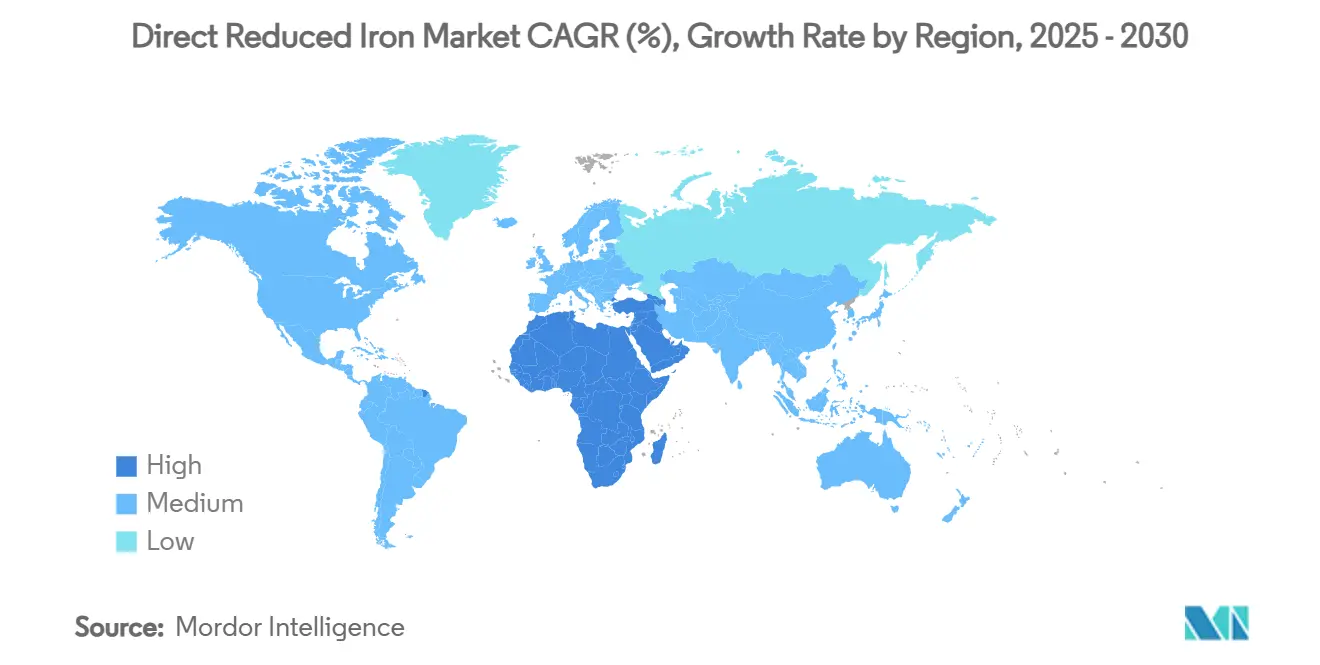
| Fastest Growing Market | Middle East and Africa |
| Largest Market | Asia Pacific |
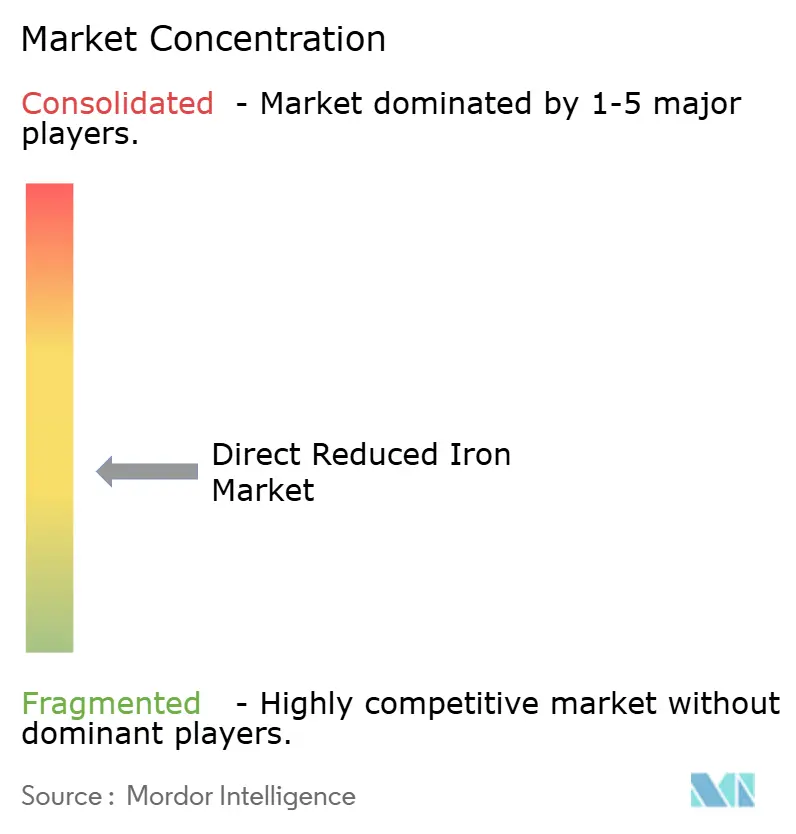
| Market Concentration | Medium |
Major Players *Disclaimer: Major Players sorted in no particular order Image © Mordor Intelligence. Reuse requires attribution under CC BY 4.0. | |
Direct Reduced Iron Market Analysis by Mordor Intelligence
The Direct Reduced Iron Market size is estimated at USD 57.83 billion in 2025, and is expected to reach USD 80.58 billion by 2030, at a CAGR of 6.86% during the forecast period (2025-2030). The growth reflects the steel sector’s migration toward lower-carbon production, the rapid build-out of electric arc furnace (EAF) capacity, and tighter decarbonization mandates worldwide. Premium pricing for DR-grade pellets, expanding hydrogen pilot programs, and new merchant hot-briquetted iron (HBI) corridors add momentum. Gas-based plants still anchor supply thanks to mature infrastructure, yet hydrogen-based systems record the fastest expansion as subsidies, carbon prices near USD 200 per tCO₂, and falling renewable-power costs speed parity. Regional dynamics are equally transformative: Asia-Pacific keeps the largest Direct Reduced Iron market share, while the Middle East and Africa (MENA) is the fastest-growing cluster, leveraging low-cost gas and nascent green-hydrogen projects. On the demand side, construction remains the prime off-taker, but the energy sector—especially renewables—delivers the highest incremental pull.
Key Report Takeaways
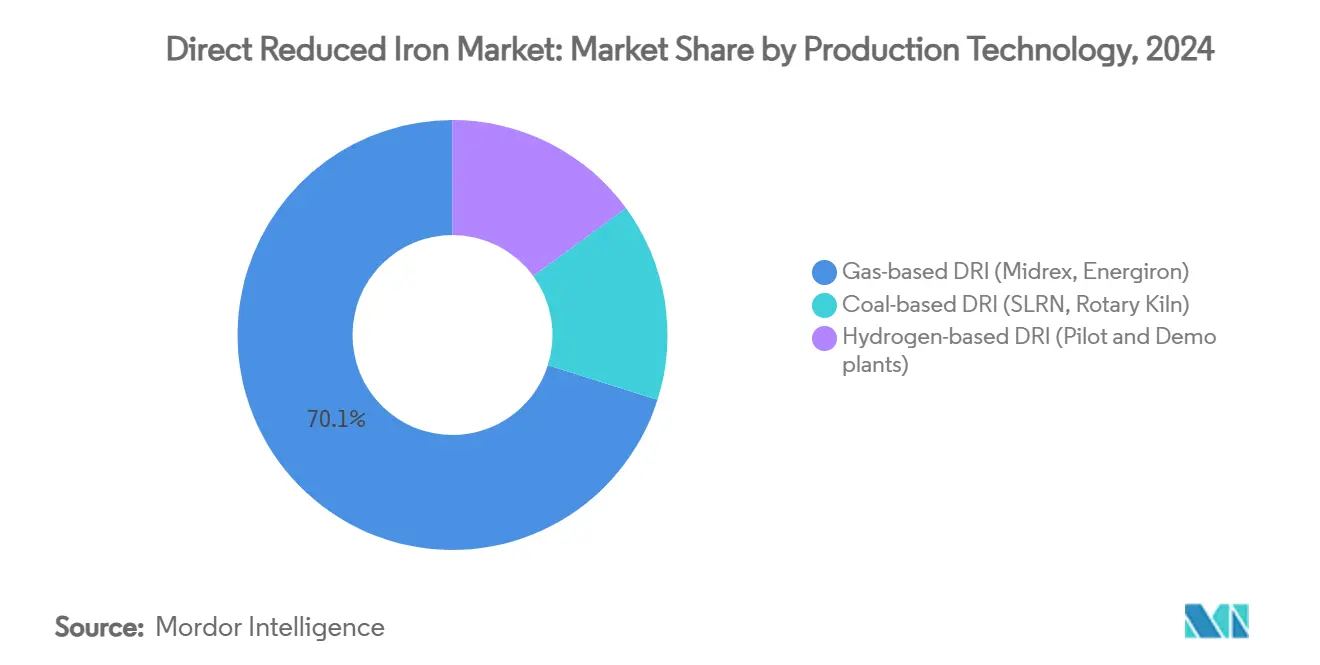
- By production technology, gas-based units led with 70.13% of the Direct Reduced Iron market share in 2024; hydrogen-based routes are projected to deliver a 7.45% CAGR through 2030.
- By product form, cold DRI held 63.45% share of the Direct Reduced Iron market size in 2024, while Hot Briquetted Iron (HBI) is set to expand at 7.12% CAGR over the same horizon.
- By application, Electric Arc Furnaces (EAF) accounted for 65.23% of the Direct Reduced Iron market size in 2024 and also post the fastest 7.46% CAGR through 2030.
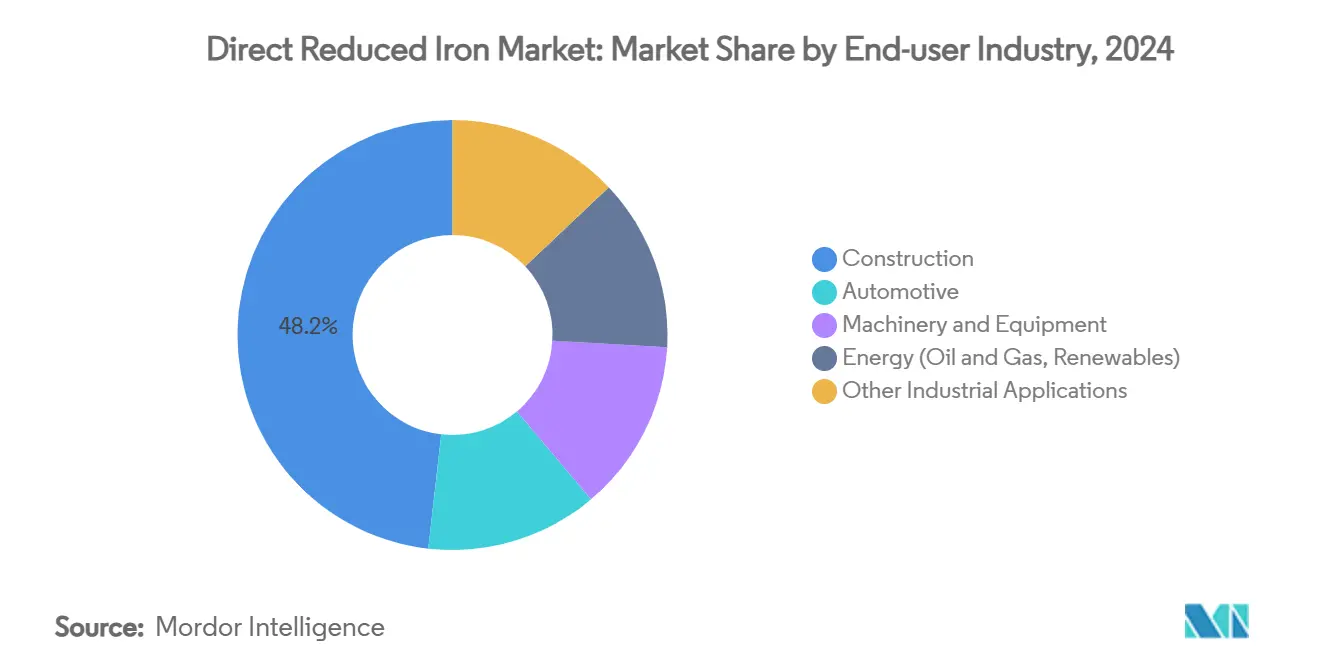
- By end-user industry, construction captured 48.20% share in 2024; the energy segment is advancing at a 7.88% CAGR to 2030.
- By geography, Asia-Pacific commanded 43.34% share in 2024, while Middle-East and Africa is forecast to grow at 7.03% CAGR through 2030.
Global Direct Reduced Iron Market Trends and Insights
Drivers Impact Analysis*
| Driver | (~) % Impact on CAGR Forecast | Geographic Relevance | Impact Timeline |
|---|---|---|---|
| Surging demand for low-carbon steel in construction and automotive | +1.8% | Global, with concentration in EU, North America, and developed APAC markets | Medium term (2-4 years) |
| Government decarbonization mandates and carbon-pricing schemes | +1.5% | EU, North America, with emerging adoption in APAC and select MEA markets | Long term (≥ 4 years) |
| Accelerating global shift toward EAF capacity additions | +1.2% | Global, led by India, China, and North America expansions | Medium term (2-4 years) |
| Investments in DR-grade pelletizing and ore beneficiation capacity | +0.9% | Global, concentrated in major iron ore producing regions | Long term (≥ 4 years) |
| Emergence of green-iron export corridors (HBI shipping) | +0.7% | MENA, Australia, Brazil as exporters; EU, APAC as importers | Long term (≥ 4 years) |
| Source: Mordor Intelligence | |||
Surging Demand for Low-Carbon Steel in Construction and Automotive
Construction and automotive manufacturers accelerate procurement of low-carbon steel to curb Scope 3 emissions, fueling incremental Direct Reduced Iron market growth. Automotive electrification compounds the pull; Hyundai Steel alone budgeted USD 5.8 billion for a Louisiana EAF complex aimed at 2.7 million t of auto-grade plate by 2029[1]Hyundai Steel, “Louisiana EAF Complex Announcement,” hyundaisteel.com . Environmental Product Declarations grant early movers a 10-15% price premium in green-building tenders, and the US Federal Buy Clean Initiative codifies CO₂-intensity thresholds that directly privilege DRI-EAF routes. DRI grades tailored for vehicle bodies now require metallization above 94% and carbon adjustability up to 4.5% to meet forming demands. On construction sites, green-steel certificates help developers secure sustainability-linked finance, reinforcing a virtuous cycle for Direct Reduced Iron market adoption.
Government Decarbonization Mandates and Carbon-Pricing Schemes
The EU carbon border adjustment mechanism, rising national emissions-trading systems, and sectoral roadmaps make hydrogen-based DRI economically credible when carbon hits USD 200 per tCO₂. Salzgitter AG locked in EUR 1 billion in German aid to erect a 2 million t Energiron plant, underscoring sovereign willingness to bankroll first-wave assets. India’s steel ministry targets 35-40% EAF penetration by 2030, while South Korea’s state-led HyREX platform foresees USD 14.8 billion of expenditure for full hydrogen deployment by 2050. This regulatory mosaic spurs companies to site mills where credits, grants, and low-carbon power converge, reshaping the Direct Reduced Iron market’s geographic footprint.
Accelerating Global Shift Toward EAF Capacity Additions
EAFs made up 93% of all steelmaking capacity announcements in 2024, guaranteeing sustained appetite for DRI feed. ArcelorMittal pumped EUR 213 million into a 1.1 million t EAF in Gijón, Spain, while British Steel earmarked GBP 1.25 billion to overhaul Scunthorpe along similar lines. DRI enhances EAF performance: metallization beyond 97% fosters foamy slag that shields refractories and cuts electrode wear by up to 20%. China issued a moratorium on new blast furnaces, signaling irreversible momentum toward DRI-enabled electric steelmaking and adding structural depth to the Direct Reduced Iron market.
Investments in DR-Grade Pelletizing and Ore Beneficiation Capacity
Only 4% of global iron-ore output qualifies as DR-grade, so miners rush to close the gap. United States Steel spent USD 150 million on a Minnesota pellet line yielding 4 million t a year, switchable between DR-grade and BF-grade products. Kumba Iron Ore’s USD 600 million Sishen upgrade boosts premium ore share from 18% to 55%, lifting EBITDA margins above 50% while stretching mine life to 2044. Rio Tinto’s Simandou venture eyes 120 million t of high-grade ore by late 2025, aligning upstream geology with downstream Direct Reduced Iron market growth. Emerging beneficiation kits even enable 62-65% Fe fines to meet DRI specs, broadening the feedstock funnel.
Restraints Impact Analysis*
| Restraint | (~) % Impact on CAGR Forecast | Geographic Relevance | Impact Timeline |
|---|---|---|---|
| High CAPEX and long pay-back periods for large-scale DRI plants | -1.4% | Global, particularly affecting emerging markets and smaller players | Long term (≥ 4 years) |
| Volatility of natural-gas prices and supply security | -1.1% | Regions dependent on gas-based DRI, particularly Europe, North America, and MENA | Short term (≤ 2 years) |
| Scarcity and price spikes of DR-grade iron ore | -0.8% | Global, with acute impact on regions lacking high-grade ore deposits | Short term (≤ 2 years) |
| Source: Mordor Intelligence | |||
High CAPEX and Long Pay-Back Periods for Large-Scale DRI Plants
Greenfield units of 2 million t a year demand USD 400-600 million and seven-to-ten-year paybacks. Cleveland-Cliffs’ hydrogen-ready build at Middletown Works costs USD 1.3 billion and hinges on USD 575 million in US Department of Energy support. Hydrogen storage and safety systems raise capital bills by another 20-30%. Smaller mills struggle to finance such tickets, pushing the Direct Reduced Iron industry toward consolidation as only balance-sheet-strong players stay competitive. Vendors offer modular reactors, but per-ton costs still run 15-25% above integrated lines.
Volatility of Natural-Gas Prices and Supply Security
Gas forms up to 70% of a DRI plant’s cash cost, so the spike in European spot prices—above USD 15 per MMBtu in 2024 squeezed margins. MENA producers retain an edge via subsidized gas, whereas EU operators hedge through MIDREX Flex setups capable of burning hydrogen blends when economics flip[2]Midrex Technologies, “Flex Technology White Paper,” midrex.com . Carbon levies further muddy the picture by penalizing residual CO₂ from reformers, accelerating a pivot to hydrogen yet exposing producers to electrolyzer price swings. These dual volatilities temper near-term Direct Reduced Iron market growth even as long-term fundamentals stay bullish.
*Our forecasts treat driver/restraint impacts as directional, not additive. The impact forecasts reflect baseline growth, mix effects, and variable interactions.
Segment Analysis
By Production Technology: Hydrogen Emergence Challenges Gas Dominance
Gas-based plants retained 70.13% share in 2024, anchoring the Direct Reduced Iron market. HYBRIT posted 5,000 t of zero-carbon sponge iron, demonstrating hydrogen feasibility at industrial scale. As renewable-power prices drop, hydrogen units are on track to post a 7.45% CAGR, chipping at gas supremacy. MIDREX and Energiron now sell reactors that toggle between methane and H₂, future-proofing capex while smoothing fuel arbitrage. Government grants and border-carbon-fees hasten crossover, especially in Europe.
Gas lines, however, still rule capacity additions in India, Iran, and the United States where reliable pipeline gas undercuts hydrogen. Coal-based rotary kilns persist in locales with lax emission rules, yet fade in regulated markets. Collectively, the interplay ensures a diversified but steadily decarbonizing Direct Reduced Iron market.


By Product Form: HBI Gains Momentum Through Trade Corridors
Cold DRI accounted for 63.45% of shipments in 2024 because in-house EAFs consume it hot, sidestepping reoxidation. HBI, denser and more stable, logs the fastest 7.12% CAGR as new export flows connect solar-rich MENA with scrap-short Europe. Reoxidation risks fall drastically—an HBI briquette loses under 0.5% metallization after four weeks at sea, versus up to 4% for cold DRI. Merchant hubs such as Vale’s Louisiana briquette plant (USD 283 million) will scale 2 million t a year by 2031 and deepen spot liquidity. The trend equips the Direct Reduced Iron market to serve distant mills deficient in prime scrap.
By Application: EAF Dominance Drives Market Evolution
EAFs captured 65.23% of volume in 2024 and mirror the top 7.46% CAGR through 2030, ensuring the largest Direct Reduced Iron market pull. DRI’s 2-4.5% controllable carbon helps build foamy slag that shields refractories and trims electricity costs by 15-20% compared with scrap-only charges. Hybrid BF-BOF injects DRI as an interim decarbonization step but remains a bridge rather than an end state. Blast furnaces use DRI mainly to shave coke rates, yet they require further CO₂ abatement to survive policy tightening.
By End-User Industry: Construction Leads While Energy Accelerates
Construction consumed 48.20% of Direct Reduced Iron market output in 2024 as urban-infrastructure pipelines swelled across India, ASEAN, and Gulf states. Even so, the energy sector posts the sharpest 7.88% CAGR—wind-tower plate, solar-rack steel, and grid hardware all demand consistent chemistry that DRI-EAF furnaces supply. Automakers shift toward advanced high-strength low-carbon steels for EV crashworthiness, increasing DRI’s share in hot-stamping feedstock. Machinery, equipment, and oil-and-gas components round out applications, each valuing DRI’s low-residual content for weldability.
Geography Analysis
Asia-Pacific’s dominant footprint originates from its steel capacity scale and policy mix that now prefers electric routes. China tightened scrap quality standards and capped new blast furnaces, steering mill owners toward DRI-EAF hybrids that protect flat-steel output quality. India’s strong GDP trajectory sustains construction steel demand even as policy pushes blast furnace retrofits into gas-based or hydrogen-ready DRI units. Japan and South Korea act as technology incubators, exporting know-how albeit with modest domestic tonnage growth.
The Middle East and Africa outperforms on growth pace, advantaged by proximal iron-ore resources, low-cost solar, and port access to Europe. Gulf Cooperation Council nations plan more than 10 GW of green hydrogen electrolysis by 2030, underpinning future HBI corridors to German and Italian buyers. Iran, currently the largest DRI producer by plant count, continues to add modules despite sanctions, servicing regional rolling mills.
North America’s momentum is shaped by federal grants and EV supply-chain reshoring. Cleveland-Cliffs’ hydrogen-ready project and Nucor’s record direct-reduction throughput illustrate operational learning curves that stabilize ramp-up risk. Europe, though volume constrained, commands premium pricing and is likely to import green HBI while its own electrolysis capacity scales. South America’s Bahia and Minas Gerais wind-solar belts offer prospective 20–25 USD/MWh power, giving future projects favorable hydrogen economics.

Competitive Landscape
The Direct Reduced Iron market is moderately concentrated. Integrated majors such as ArcelorMittal and Cleveland-Cliffs combine captive iron ore, DRI modules, and downstream mills to secure feedstock and carbon compliance. Technology licensors MIDREX and Energiron dominate process IP, delivering >80% of installed gas-based capacity. New entrants include merchant HBI firms in energy-rich jurisdictions aiming to monetize abundant renewables.
Competitive levers shift from cost per tonne to verified CO₂ intensity. MIDREX Flex and Energiron ZR reactors command a premium for their ability to run on any methane-hydrogen mix, future-proofing capital outlays. Digital twins and AI-driven furnace control cut electrode consumption and tap-to-tap times, adding further differentiation; SMS group embeds such suites in its turnkey offerings.
Strategic playbooks fall into three buckets: (1) vertical integration for closed-loop green steel, (2) regional merchant supply escorted by export corridors such as HBI from MENA to EU, and (3) pure-play technology licensing. Patent filings focus on hydrogen shaft reduction, CO₂ capture integration, and modular plant designs, highlighting where the next wave of value capture lies.
Direct Reduced Iron Industry Leaders
ArcelorMittal
Emirates Steel Arkan
Nucor Corporation
JSW Steel Ltd.
QATAR STEEL
- *Disclaimer: Major Players sorted in no particular order

Recent Industry Developments
- January 2024: Baosteel Co.,Ltd. began operations at its new Energiron Direct Reduced Iron (DRI) plant in Guangdong Province. The facility includes a hydrogen-compatible DRI reactor with an annual capacity of 1 million tonnes and metallization rates reaching 96%, making it the largest of its kind globally.
- May 2023: A consortium of Tenova, Danieli, and DSD Steel Group received a contract from Salzgitter AG to construct a direct reducted iron (DRI) plant at Salzgitter Flachstahl GmbH. The plant, with an annual production capacity exceeding 2 million tons of DRI, represents the largest component in the initial phase of the SALCOS® - Salzgitter Low CO2 Steelmaking transformation program. This program aims to achieve near-zero CO2 steel production by 2033.


Global Direct Reduced Iron Market Report Scope
| Gas-based DRI (Midrex, Energiron) |
| Coal-based DRI (SLRN, Rotary Kiln) |
| Hydrogen-based DRI (Pilot and Demo plants) |
| Hot Briquetted Iron (HBI) |
| Cold DRI (CDRI) |
| Electric Arc Furnaces (EAF) |
| Blast Furnaces and Hybrid BF-BOF |
| Construction |
| Automotive |
| Machinery and Equipment |
| Energy (Oil and Gas, Renewables) |
| Other Industrial Applications |
| Asia-Pacific | China |
| India | |
| Japan | |
| South Korea | |
| Rest of Asia-Pacific | |
| North America | United States |
| Canada | |
| Mexico | |
| Europe | Germany |
| United Kingdom | |
| Russia | |
| Italy | |
| Rest of Europe | |
| South America | Brazil |
| Argentina | |
| Rest of South America | |
| Middle-East and Africa | Saudi Arabia |
| United Arab Emirates | |
| South Africa | |
| Rest of Middle-East and Africa |
| By Production Technology | Gas-based DRI (Midrex, Energiron) | |
| Coal-based DRI (SLRN, Rotary Kiln) | ||
| Hydrogen-based DRI (Pilot and Demo plants) | ||
| By Product Form | Hot Briquetted Iron (HBI) | |
| Cold DRI (CDRI) | ||
| By Application | Electric Arc Furnaces (EAF) | |
| Blast Furnaces and Hybrid BF-BOF | ||
| By End-user Industry | Construction | |
| Automotive | ||
| Machinery and Equipment | ||
| Energy (Oil and Gas, Renewables) | ||
| Other Industrial Applications | ||
| By Geography | Asia-Pacific | China |
| India | ||
| Japan | ||
| South Korea | ||
| Rest of Asia-Pacific | ||
| North America | United States | |
| Canada | ||
| Mexico | ||
| Europe | Germany | |
| United Kingdom | ||
| Russia | ||
| Italy | ||
| Rest of Europe | ||
| South America | Brazil | |
| Argentina | ||
| Rest of South America | ||
| Middle-East and Africa | Saudi Arabia | |
| United Arab Emirates | ||
| South Africa | ||
| Rest of Middle-East and Africa | ||


Key Questions Answered in the Report
What is the current value of the Direct Reduced Iron market?
The Direct Reduced Iron market size reached USD 57.83 billion in 2025 and is projected to climb to USD 80.58 billion by 2030.
Which production technology leads in global shipments?
Gas-based processes dominate with 70.13% share, although hydrogen-based systems register the fastest growth at 7.45% CAGR.
Why is HBI gaining popularity over cold DRI?
HBI’s dense briquettes resist reoxidation, enabling safe ocean transport and facilitating new merchant trade corridors from MENA to Europe.
Which end-user sector is expanding the fastest?
Renewable-energy infrastructure drives the energy segment to the highest 7.88% CAGR, even though construction remains the largest consumer.
Page last updated on:


