
Depth Filtration Market Size and Share
Market Overview
| Study Period | 2020 - 2031 |
|---|---|
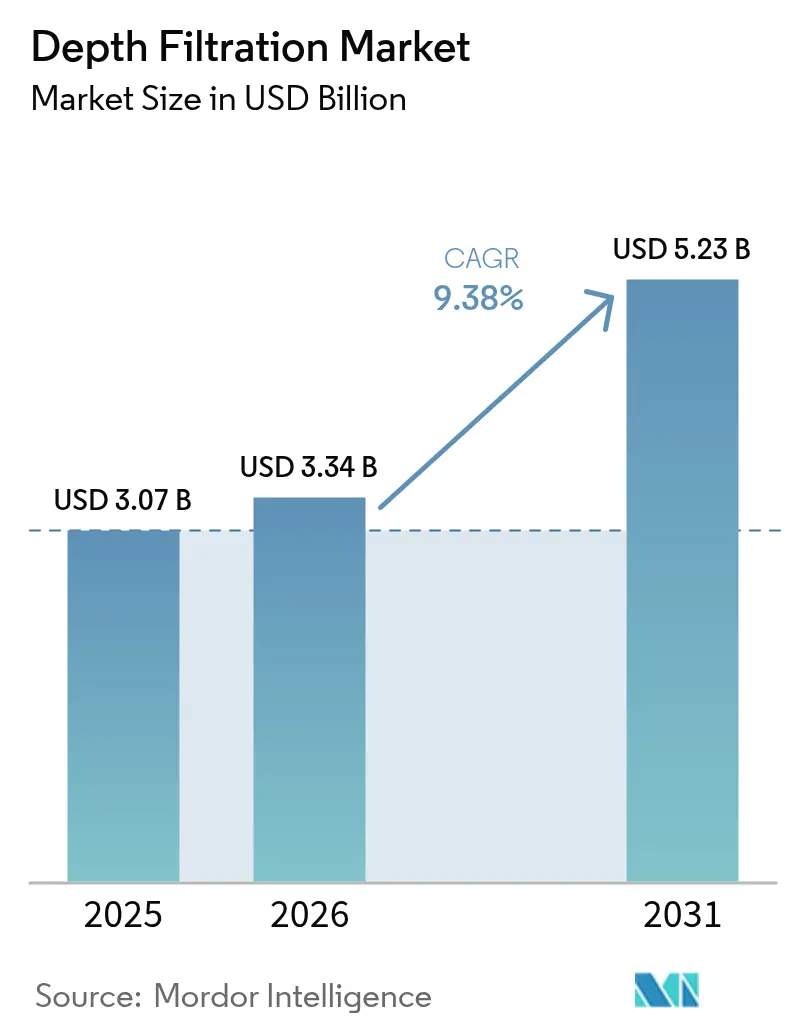
| Market Size (2026) | USD 3.34 Billion |
| Market Size (2031) | USD 5.23 Billion |
| Growth Rate (2026 - 2031) | 9.38 % |
| Fastest Growing Market | Asia Pacific |
| Largest Market | North America |
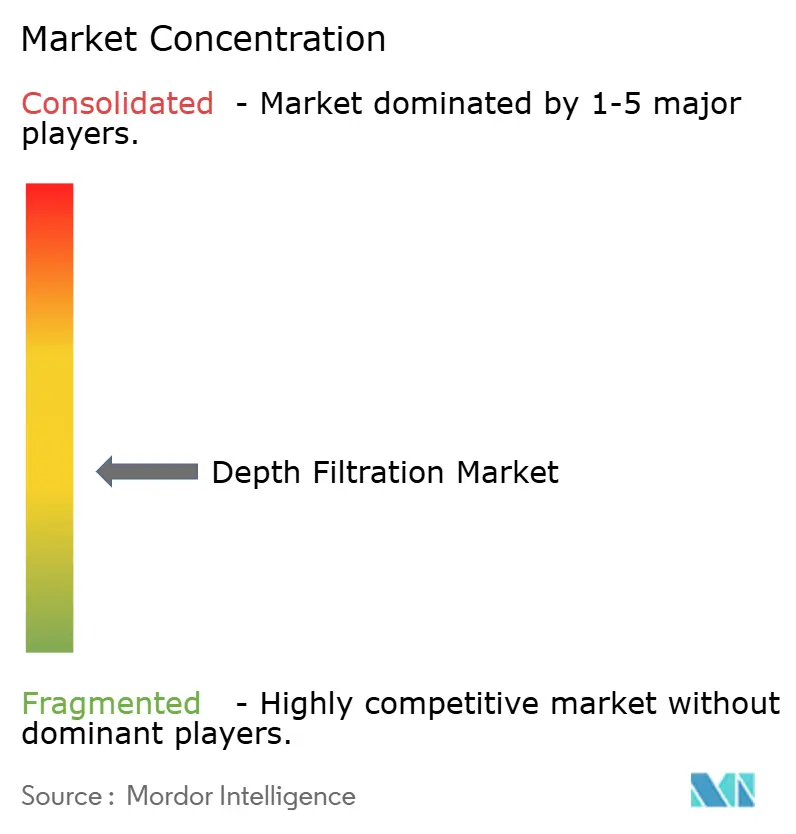
| Market Concentration | Medium |
Major Players *Disclaimer: Major Players sorted in no particular order Image © Mordor Intelligence. Reuse requires attribution under CC BY 4.0. | |
Depth Filtration Market Analysis by Mordor Intelligence
The Depth Filtration Market size is projected to expand from USD 3.07 billion in 2025 and USD 3.34 billion in 2026 to USD 5.23 billion by 2031, registering a CAGR of 9.38% between 2026 to 2031.
Robust uptake of single-use depth filters in cell- and gene-therapy manufacturing, a wave of FDA approvals in 2024, and the need for disposable clarification trains that prevent cross-batch contamination are accelerating demand. Contract development and manufacturing organizations (CDMOs) are moving faster than captive facilities because modular filter systems allow product changeovers in days, not weeks. Specialty media, such as activated-carbon blends, are penetrating beverage and micro-algae protein lines, while gamma-sterilizable capsules are reducing validation time in fill-finish suites. Raw-material price swings in cellulose and diatomaceous earth remain a structural headwind, but suppliers are answering with nanocellulose composites and hybrid depth-TFF cassettes that protect margins and open new applications.
Key Report Takeaways
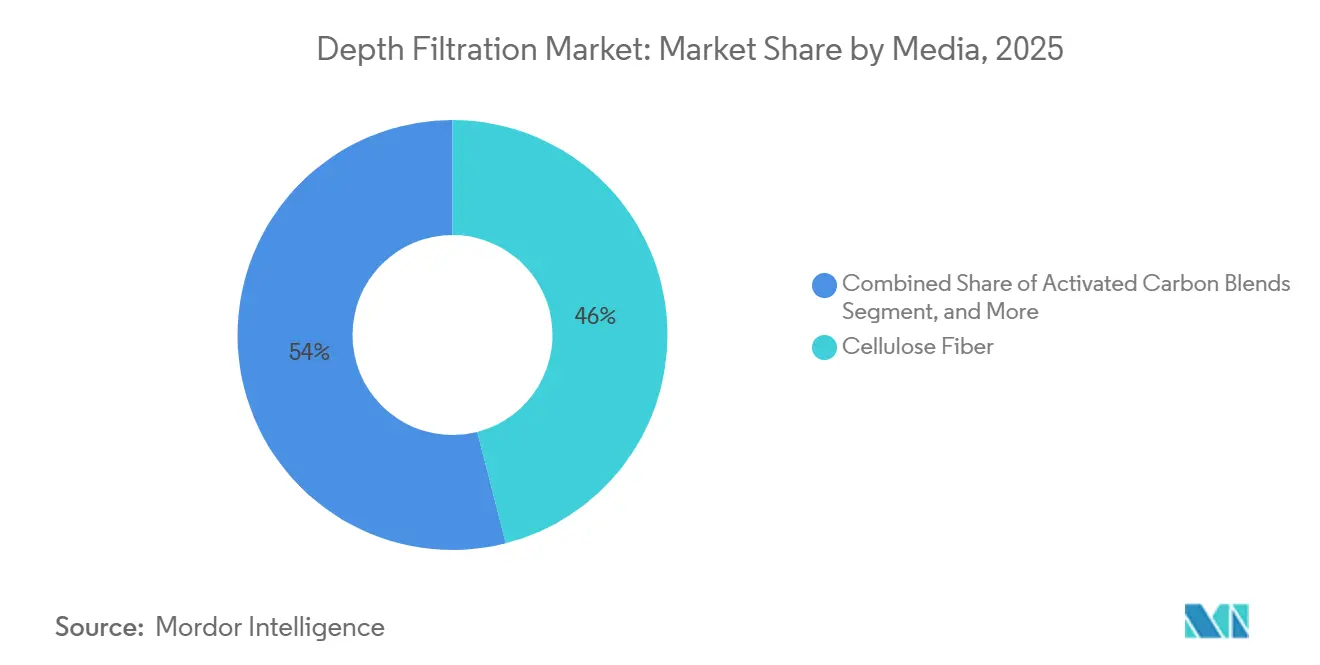
- By media, cellulose fiber led with 46.02% of depth filtration market share in 2025, while activated-carbon blends are forecast to register a 10.06% CAGR through 2031.
- By product, cartridge filters accounted for 38.27% of 2025 revenue; capsule filters are set to expand at a 11.63% CAGR through 2031.
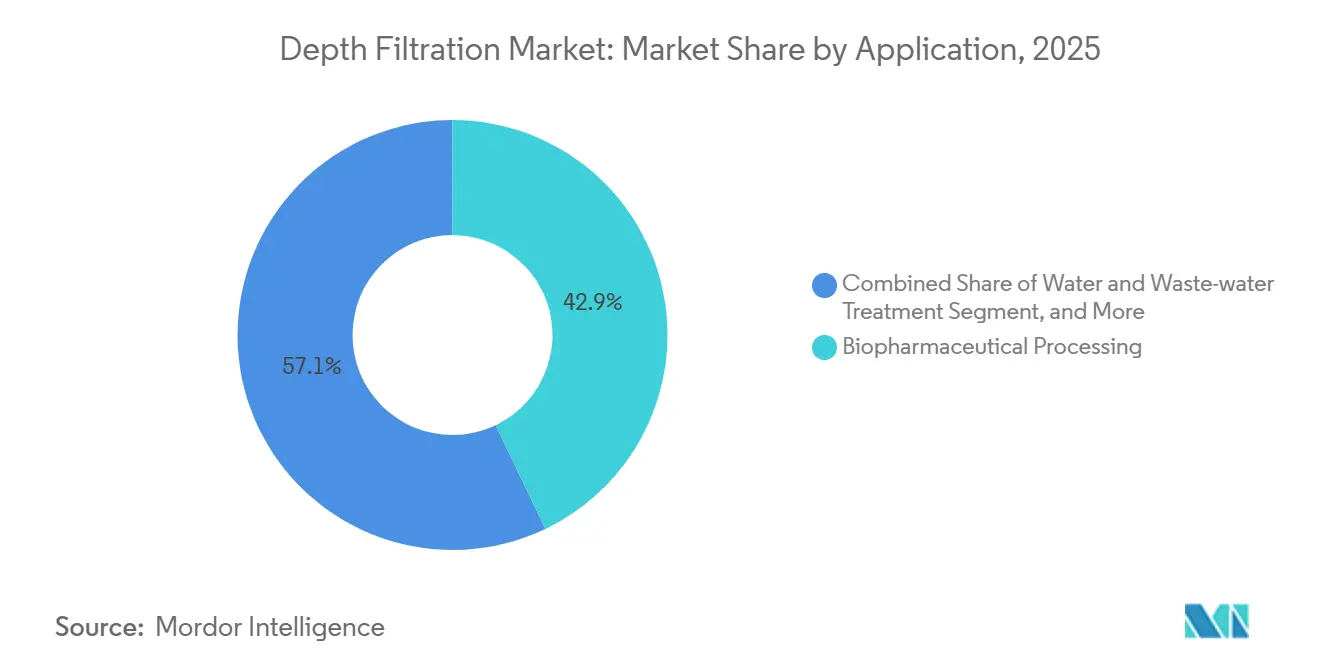
- By application, biopharmaceutical processing accounted for 42.89% of the depth filtration market in 2025, and water and wastewater treatment is advancing at a 9.98% CAGR through 2031.
- By end-user, pharmaceutical and biotechnology companies captured 37.78% of 2025 demand, and CDMOs are projected to grow at a 10.41% CAGR through 2031.
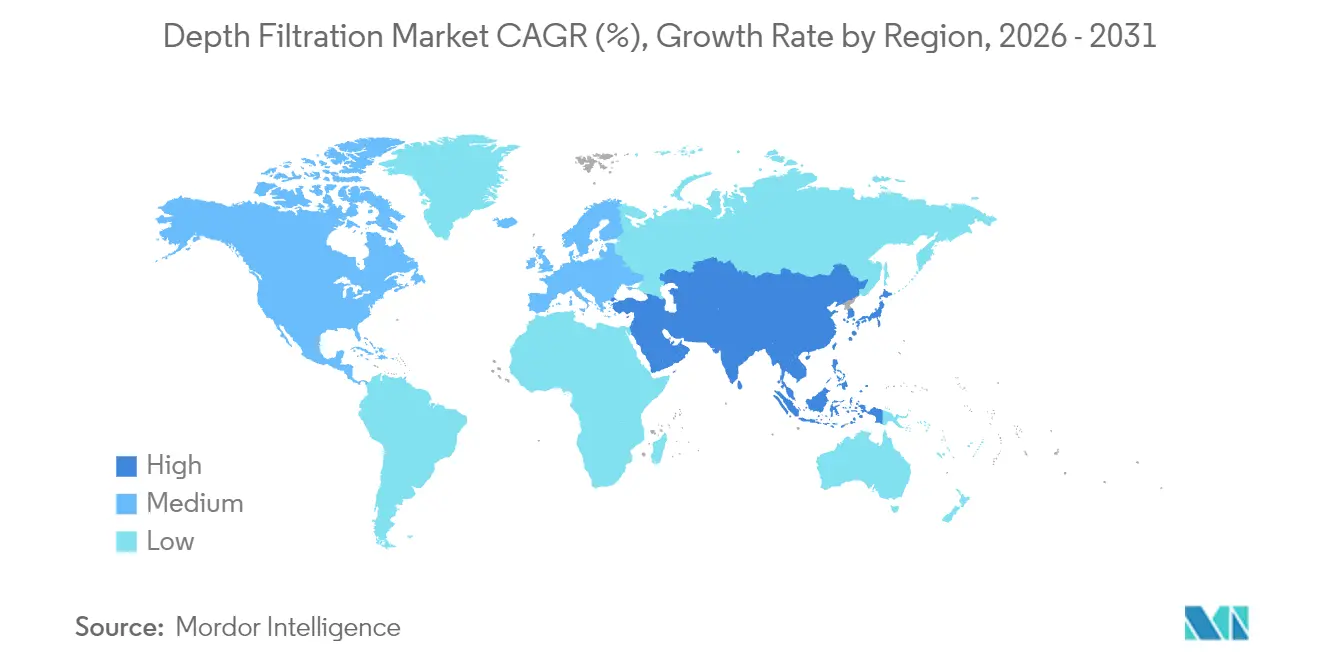
- By geography, North America accounted for 34.08% of 2025 revenue, while Asia-Pacific is on track for an 11.07% CAGR during 2026-2031.
Note: Market size and forecast figures in this report are generated using Mordor Intelligence’s proprietary estimation framework, updated with the latest available data and insights as of 2026.
Market Trends and Insights
Drivers Impact Analysis of Depth Filtration Market*
| Driver | (~) % Impact on CAGR Forecast | Geographic Relevance | Impact Timeline |
|---|---|---|---|
| Rising Biologics & Cell-Gene Therapy Volumes | +2.1% | Global with North America and EU concentration | Medium term (2-4 years) |
| Single-Use Depth Filter Adoption in Modular Bioprocessing | +1.8% | North America and core APAC with EU spill-over | Short term (≤ 2 years) |
| Stringent Food & Beverage Clarity Standards | +1.3% | EU, North America, Australia | Long term (≥ 4 years) |
| Growth of Craft Breweries & Micro-Wineries | +1.0% | North America, EU, select APAC | Medium term (2-4 years) |
| Emerging Demand for Exosome & Viral-Vector Purification | +1.6% | Global early adopters in North America & EU | Long term (≥ 4 years) |
| Micro-Algae Protein Extraction Scale-Up | +0.9% | APAC core with North America pilots | Long term (≥ 4 years) |
| Source: Mordor Intelligence | |||
Rising Biologics & Cell-Gene Therapy Volumes
Single-use bioreactor capacity additions totaled 4.2 million L in 2024, and 31% of those vessels support cell- and gene-therapy programs that require multiple depth-filtration steps. Each 2,000 L CAR-T perfusion run yields up to 80 L of harvest, which must be clarified without damaging viral vectors. BARDA earmarked USD 500 million in 2024 for vaccine fill-finish expansions that mandate the use of disposable depth filters, institutionalizing this workflow in federally funded plants.[1]U.S. Department of Health and Human Services, “BARDA Investments,” phe.gov Filters now incorporate co-layers of activated carbon or charged diatomaceous earth to capture sub-200 bp DNA fragments while preserving 20 nm virus particles, locking suppliers into long-term deals with therapy sponsors.
Single-Use Depth Filter Adoption in Modular Bioprocessing
Prefabricated cleanroom pods can be commissioned in 18 months versus 36 months for traditional builds, a schedule advantage CDMOs exploit to win late-phase projects. Lonza’s Visp site came online in October 2024 with fully disposable clarification trains that cut water-for-injection use by 40% compared with stainless-steel clarifiers.[2]Lonza Group, “Modular Facility Opening,” lonza.com The latest ISPE Baseline Guides classify single-use depth filters as low-risk, exempting them from site-to-site revalidation and accelerating multi-facility rollouts. Supply-chain fragility surfaced when a Finnish pulp mill fire in March 2025 added six-week lead times, reminding CDMOs to dual-source critical filters.
Stringent Food & Beverage Clarity Standards
The EU tightened turbidity limits for craft beer in 2025, driving breweries toward depth filters that remove polyphenols without stripping flavor. Activated-carbon blends deliver color removal and microbial reduction in a single pass, a dual function that reduces filter changeouts by 30% in micro-wineries. The U.S. Alcohol and Tobacco Tax and Trade Bureau now lets breweries market “unfiltered” beers when only depth filters are used, a regulatory nuance boosting adoption.
Growth of Craft Breweries & Micro-Wineries
U.S. craft breweries totaled 9,683 in 2024, each spending roughly USD 10,000 annually on depth-filter media. European micro-wineries have followed suit by installing lenticular modules that reduce the cellar footprint and deliver 25% higher flow rates than sheet filters. Activated-carbon-cellulose composites reduce chill haze in unfiltered ales, commanding a 15% shelf-price premium and improving brewery margins.
Restraints Impact Analysis of Depth Filtration Market*
| Restraint | (~) % Impact on CAGR Forecast | Geographic Relevance | Impact Timeline |
|---|---|---|---|
| Membrane & Tangential-Flow Filtration Price Competition | −1.4% | Global, sharpest in APAC | Short term (≤ 2 years) |
| Raw Material (Cellulose/ Diatomite) Supply Volatility | −1.1% | North America & EU | Medium term (2-4 years) |
| High Disposal Cost for Single-Use Filter Waste | −0.7% | EU and select U.S. states | Long term (≥ 4 years) |
| Regulatory Push Toward Plastic-Free Consumables | −0.6% | EU, California, Canada | Long term (≥ 4 years) |
| Source: Mordor Intelligence | |||
Membrane & Tangential-Flow Filtration Price Competition
TFF cassette prices slid 22% between 2022 and 2025, narrowing the historic cost gap with depth filters. Hybrid trains now pair one disposable depth filter with a 0.45 µm TFF step, trimming clarification spends 15-20% per batch. Pall’s Depth-TFF module, launched in September 2024, targets this workflow consolidation and intensifies price pressure, especially in cost-sensitive biosimilar plants.
Raw Material (Cellulose/ Diatomite) Supply Volatility
Scandinavian mill closures cut global pulp output by 1.8 million t in 2024, raising filter-grade cellulose premiums to 40% over commodity pulp.[3]Food and Agriculture Organization, “Global Pulp Statistics,” fao.org Lompoc mine shutdowns removed 180,000 t of diatomaceous earth, forcing suppliers to consider higher-impurity Chinese ore that demands costly acid leaching. Media substitution with perlite or nanocellulose needs 12-18 months of validation, delaying commercial rollout and exposing vendors to price shocks.
*Our forecasts treat driver/restraint impacts as directional, not additive. The impact forecasts reflect baseline growth, mix effects, and variable interactions.
Depth Filtration Market Segment Analysis
By Media:
Specialty Blends Erode Cellulose DominanceCellulose fiber accounted for the largest share of the depth filtration market in 2025, at USD 1.41 billion, or 46.02% of revenue. Activated-carbon blends will outpace all rivals with a 10.06% CAGR, fueled by craft breweries that demand simultaneous aroma polishing and microbial reduction. Diatomaceous earth remains preferred for high-solids wine lees and municipal water pre-treatment, but disposal fees under the EU Waste Framework Directive are tilting wineries toward low-waste cellulose sheets. Synthetic nanocellulose, although nascent, unlocks electrostatic capture of host-cell DNA, trimming nuclease steps in gene-therapy lines and protecting depth filtration market share in premium bioprocess applications.
Media innovation is shifting the depth filtration industry toward multifunctional filters that marry mechanical sieving with adsorptive chemistry. Activated carbon’s capacity to strip polyphenols aligns with consumer “clean label” trends and boosts shelf stability. Charged nanocellulose reduces DNA loads by 99.5%, meeting stringent regulatory requirements without adding unit operations. Suppliers that qualify these blends gain first-mover lock-in because therapy sponsors resist media switches mid-trial.



By Product:
Capsules Outstrip Cartridges on Validation SpeedCartridge filters accounted for 38.27% of the depth filtration market in 2025, yet capsule formats will post an 11.63% CAGR through 2031. Capsules arrive gamma-sterilized, eliminating 4-6 h steam-in-place cycles and cutting per-batch validation labor by USD 1,800 in clinical runs. RFID-enabled cartridges still dominate legacy stainless lines because they integrate with existing housings, but fill-finish suites built since 2024 default to capsules to shave changeover time.
Modules and lenticular systems are concentrating flow capacity into smaller footprints, a decisive factor when cleanroom rent exceeds USD 3,000/m²/y. Sheets and pads, long used in wine cellars, are ceding ground to lenticular stacks that reduce operator exposure to diatomaceous earth dust. Specialty in-line capsules serve point-of-use lead removal in U.S. municipal upgrades, adding a steady but low-margin revenue tail.
By Application:
Biopharma Anchors, Water Treatment ClimbsBiopharmaceutical plants accounted for 42.89% of 2025 revenue, a dominance sustained by validated single-use workflows that support premium pricing. A monoclonal-antibody fed-batch consumes up to ten depth-filter cartridges from harvest to final fill. Cell- and gene-therapy lines impose harsher viscosity and DNA loads but reward performance with contracts worth USD 8,000-12,000 per 500 L batch.
Food and beverage remain volume pillars, with the Brewers Association tallying nearly 9,700 craft breweries in 2024. Water and wastewater utilities are the fastest-growing non-pharma users, advancing at a 9.98% CAGR, driven by depth filters that extend reverse-osmosis life from 3 y to 5 y in U.S. desalination retrofits. Other industrial streams, including coolant and chemical filtrate, supply a diversified baseline that cushions sector cyclicality.
By End-User:
CDMOs Build Share on AgilityPharma and biotech owners controlled 37.78% of 2025 sales, but CDMOs will capture incremental market share in depth filtration as they add single-use bioreactor farms. New capacity totaling 1.2 million L announced in 2024 by Lonza, Samsung Biologics, and WuXi embeds disposable clarification as a platform step, driving a 10.41% CAGR through 2031.
Academic labs and pilot centers seed future demand by validating niche media. The MIT Biomanufacturing Innovation Center proved that charged diatomaceous earth can displace protein-A columns for certain fragments, slashing purification costs by 60% and signaling long-term substitution potential. Municipal utilities, food processors, and chemical plants round out demand with more price-sensitive yet stable procurement.
Geography Analysis
North America Depth Filtration Market
North America generated 34.08% of 2025 revenue, underwritten by FDA fast-track pathways that speed single-use devices through 510(k) clearance. Boston, San Francisco, and RTP anchor cell-therapy clusters that mandate disposable clarification to mitigate cross-contamination, bolstered by BARDA’s USD 500 million fill-finish expansion that codified depth filtration as standard equipment. Canada and Mexico contribute biosimilar output, with Pfizer’s Sanford site expanding single-use trains in 2024 for EU and LATAM supply.
APAC Depth Filtration Market
Asia-Pacific is poised for an 11.07% CAGR, the fastest worldwide. China’s NMPA cleared seven domestic CAR-T therapies in 2024, each produced in facilities that reject stainless-steel clarifiers to sidestep cross-program carryover risks. India’s biosimilar plants retrofit depth-filter cartridges to satisfy EMA data-integrity rules mandating real-time pressure-drop logs. Japan shortened regenerative-medicine approval timelines to 12 months for processes featuring validated single-use depth filtration, spurring CDMO investment.
EMEA and South America Depth Filtration Market
Europe, MEA, and South America supply the balance. EU sustainability directives are pushing suppliers toward recyclable cartridges; Sartorius is piloting take-back loops to recover cellulose for non-pharma reuse. Brazil’s ethanol and Argentina’s wine sectors maintain steady diatomaceous earth demand, while GCC desalination plants add depth pre-filters to extend RO life. South American uptake remains commodity-price sensitive but benefits from beverage exports that require haze-free clarification.

Regulatory Landscape
Depth filtration used in regulated bioprocessing and sterile manufacturing is governed by a mix of medical-device quality requirements and GMP expectations for sterile product manufacture and filtration validation. In the United States, FDA medical device oversight links filtration hardware and single-use assemblies to Quality System requirements and inspection readiness, and in February 2026 the FDA discontinued QSIT as its inspection approach. Manufacturers therefore need to keep documentation, CAPA, and process controls aligned with the updated inspection model. Compendial guidance such as USP general chapters on sterilizing filtration further emphasizes validated filtration processes, integrity testing, and bioburden control for liquid filtration workflows.
In Europe, EudraLex Volume 4 and EU GMP Annex 1 (sterile medicinal products) set expectations for filtration steps used in sterile manufacturing, including the use of bioburden reduction filters ahead of sterilizing-grade filtration and the focus on integrity testing practices such as PUPSIT, alongside bacterial retention expectations for sterilizing filters. These requirements raise the bar for depth filtration suppliers supporting prefiltration and clarification trains, especially on extractables and leachables files, performance reproducibility, and traceable batch documentation that can be referenced in validated dossiers across multi-site operations.
Competitive Landscape
Five global suppliers, Danaher (Pall), Sartorius, Merck (MilliporeSigma), 3M, and Eaton, collectively have significant revenue, leaving meaningful whitespace for agile regional entrants. Strategy pivots around media chemistry, format convenience, and integration with upstream or downstream unit operations. Sartorius notes that 38% of bioprocess consumables revenue now comes from products co-developed during Phase I/II trials, locking in demand throughout commercialization but extending R&D payback periods.
Regional challengers, including Cobetter and GS-Filt, undercut Western prices by up to 30% in APAC biosimilar lines, yet still lack comprehensive extractables files required for U.S. or EU commercial launches. Innovation momentum is visible in the 47 U.S. patents granted in 2024, spanning charged nanocellulose, asymmetric dual-layer media, and RFID-enabled cartridges with embedded pressure sensors. Hybrid depth-TFF skids blur category lines and apply additional pricing pressure on commodity cartridges.
Media security remains paramount after 2024 outages at the pulp mill and diatomite mine exposed single-source vulnerabilities. Suppliers now dual-source cellulose from Canada and Scandinavia and maintain 6-month safety stocks. Partnerships with therapy sponsors for early media selection provide revenue stability but narrow aftermarket opportunities for challengers once a filter is locked into a validated dossier.
Depth Filtration Industry Leaders
Amazon Filters Ltd
3M
Merck KGaA
Sartorius Stedim Biotech
Parker Hannifin Corp.
- *Disclaimer: Major Players sorted in no particular order
Depth Filtration Market Companies Covered in this Report
- 3M
- Amazon Filters Ltd.
- Cobetter Filtration
- Critical Process Filtration
- Danaher Corp. (Pall)
- Eaton Filtration
- FILTROX
- Gemü Group
- Graver Technologies
- GS-Filt
- Hangzhou Darlly Filtration
- Meissner Filtration Products
- Merck
- Microclar
- Microdyn-Nadir
- Parker Hannifin
- Pentair
- Porvair Filtration
- Saint-Gobain Life Sciences
- Sartorius

Market Opportunities and Future Outlook
One opportunity sits in intensified upstream bioprocessing, where high cell-density and perfusion harvests increase solids, colloids, and DNA loads that drive fouling and expand filter-area needs. Bioprocess clarification practice points to pretreatment (for example, flocculation using calcium phosphate or polycationic polymers) as a lever that can cut the required filter-area multiple-fold for monoclonal antibody harvest clarification. That creates whitespace for suppliers that co-develop depth media and process aids as an integrated clarification package. It also fits the report context on modular, single-use depth filtration modules that remove cleaning validation burdens and support rapid changeovers, especially in CDMO environments.
A second opportunity involves depth filtration shifting from a standalone clarification step to a monitored, standardized unit operation inside broader single-use trains and hybrid workflows, including cases where depth is used alongside downstream steps such as TFF. Trade and academic discussions around real-time monitoring and low-fouling, high-capacity media support demand for smarter cartridges and capsules and higher-throughput media chemistries, aligning with the report context on RFID-enabled cartridges and hybrid depth-TFF approaches. In parallel, tightening clarity and quality requirements in food and beverage, combined with sustainability pressure on disposable waste in the EU and certain US states, opens product-design whitespace for lower-waste formats and take-back or recycling programs that reduce disposal burdens without changing validated performance.
Recent Industry Developments in Depth Filtration Market
- July 2026: Amazon Filters opened a 2,800 square meter expanded manufacturing hub at CTPark Nowy Konik near Warsaw, Poland, adding production and storage capacity. The expansion improves European supply responsiveness for process filtration products used in regulated and industrial applications and supports shorter lead times for customers qualifying depth and related filtration consumables.
- February 2025: Thermo Fisher Scientific announced the acquisition of Solventum’s purification and filtration business for USD 4.1 billion. The deal consolidates filtration capabilities under a major bioprocessing supplier and can reshape portfolio breadth and bundling across clarification and downstream filtration workflows.
- December 2024: Amazon Filters launched the SupaPore TMB high-temperature-resistant membrane product aimed at sterile air venting in pharmaceutical and biotech applications. Extending performance under high-temperature conditions broadens the company’s sterile-utility filtration offering around bioprocess facilities that also procure depth filtration for harvest and clarification trains.


Depth Filtration Market Report Scope and Research Methodology
Market Definition and Coverage
This market covers revenues generated from depth filtration products used to remove particles and impurities from liquids and process streams in industrial and lab settings, where separation happens through a porous media depth rather than a surface screen.
Scope exclusions: We do not count downstream equipment that is not a depth filtration step, such as membrane-only filtration skids, pumps, and general plant piping.
Segments Covered in This Report
- By Media
- Cellulose Fiber
- Diatomaceous Earth
- Activated Carbon Blends
- Perlite & Others
- By Product
- Cartridge Filters
- Capsule Filters
- Filter Sheets & Pads
- Modules & Lenticular Systems
- Other Products
- By Application
- Biopharmaceutical Processing
- Food & Beverage Clarification
- Water & Waste-water Treatment
- Other Applications
- By End-user
- Pharmaceutical & Biotechnology Companies
- Contract Development & Manufacturing Organizations (CDMOs)
- Academic & Research Institutes
- Other End Users
- By Geography
- North America
- United States
- Canada
- Mexico
- Europe
- Germany
- United Kingdom
- France
- Italy
- Spain
- Rest of Europe
- Asia-Pacific
- China
- Japan
- India
- Australia
- South Korea
- Rest of Asia-Pacific
- Middle East & Africa
- GCC
- South Africa
- Rest of Middle East & Africa
- South America
- Brazil
- Argentina
- Rest of South America
- North America
Data Sources, Market Sizing, and Validation
Desk Research
Desk work starts with building the demand context and the supply footprint so our model is grounded in real activity. We used public sources such as US FDA guidance and databases for biologics manufacturing context, USGS and other government material statistics where relevant to filtration media inputs, US International Trade Commission data for trade direction signals, and World Bank macro indicators to normalize country level demand.
Alongside those, we leaned on company annual reports, investor presentations, product catalogs, and reputable press coverage to understand product mix shifts across cartridges, capsules, sheets and pads, and modules and lenticular formats. Patent databases were reviewed to track where product improvements are moving, and an import and export shipment-level database was selectively used to sanity check cross-border flows for key filtration components. This list is not exhaustive, and many other public sources were also referred to for data collection, validation, and clarification.
Primary Interviews and Surveys
Primary work was used to pressure test the desk assumptions and to convert product and application trends into usable sizing inputs. We spoke with a mix of manufacturers, distributors, and end users across biopharmaceutical processing, food and beverage plants, and water treatment operators, and we also validated views with technical managers who own filtration step selection. For a global read, inputs were balanced across APAC, EMEA, and the Americas so that regional price levels and adoption rates did not get overstated.
Distribution of primary research fieldwork respondents
| Company type | Respondent position | Region |
|---|---|---|
| Top tier: 34% | CXOs: 14% | APAC: 48% |
| Mid tier: 44% | Functional/Unit leaders: 29% | EMEA: 34% |
| Smaller Players: 22% | Managers: 57% | Americas: 18% |
Market-Sizing & Forecasting
Our sizing logic uses a top-down build that starts from filtration demand pools by application and region, which are reconstructed using manufacturing activity signals and process step penetration for depth filtration. Results are then corroborated with selective bottom-up approximations, like sampled price per unit for key formats multiplied by estimated consumption volumes, followed by channel checks to adjust for distribution markups and mix.
A few practical variables were used to keep the model tied to market reality, such as biologics production scale-up trends that drive clarification needs, installed capacity and utilization changes in bioprocessing and beverage processing, replacement and change-out frequency for depth media, the shift toward single-use formats in sensitive workflows, and regional pricing differences driven by material costs and regulatory compliance. Where a clean roll-up was not possible for smaller product lines or niche applications, gaps were handled through proportional allocation based on validated mix shares and then reviewed again with interview feedback.
For forecasting, scenario analysis was applied around the most sensitive drivers, and then the base case was aligned with expert consensus on capacity additions, adoption pace, and typical price progression. This approach stays repeatable because each assumption is traceable to a variable that can be refreshed annually.
Data Validation & Update Cycle
Validation is done through a few layers of checks so the final number is not driven by a single data point. Model outputs are compared against independent signals like trade direction, end-market production indicators, and observed pricing bands, and then unusual jumps are reviewed to confirm they are real and not a timing or conversion issue.
Before sign-off, the work goes through multi-step analyst reviews, and we re-contact sources when a key assumption moves outside the expected range for usage rates, mix, or regional splits. Reports are refreshed annually, and interim updates are made when material events occur, such as regulatory changes, large capacity expansions, or major pricing resets. Right before delivery, a fresh review pass is completed so clients receive the latest updated view.
Mordor Intelligence's Depth Filteration Market Sizing Compared With Other Published Estimates
Published market sizes for depth filtration often look different because each publisher sets its own product scope, base year, and forecasting window, and then applies its own assumptions for pricing and adoption. When those choices vary, the numbers can move even if the underlying industry trend is similar.
Some external estimates bundle a wider set of systems and services or use a longer horizon that pushes a higher end-year value. In Mordor Intelligence, the count is kept to depth filtration products across defined formats and applications, and it is anchored to a 2026 starting point that is then extended to 2031 using validated adoption and price inputs.
Benchmark comparison
| Source | Market Size | Gaps in Research Methodology |
|---|---|---|
| Mordor Intelligence | USD 3.34 B (2026) | |
| Industry Research Publisher A | USD 2.70 B (2024) | Uses a 2024 base year and a different historical window, which can shift the starting demand pool and price level before forecasting begins. |
| Market Publisher B | USD 3.08 B (2025) | Includes a broader commercial scope that can fold in adjacent systems, accessories, or validation support, and it also uses a longer 2035 horizon that amplifies compounding effects. |
The table shows that the spread is mainly explained by base year selection and what is counted as part of a depth filtration purchase. By keeping the scope tied to identifiable product formats and by checking assumptions with users and suppliers, we keep the estimate easier to audit and refresh when market conditions change.


Key Questions Answered in the Report
How fast is the depth filtration market expected to grow to 2031?
Revenue is forecast to climb from USD 3.34 billion in 2026 to USD 5.23 billion by 2031, registering a 9.38% CAGR.
Which media type is expanding the quickest?
Activated-carbon blends will rise at a 10.06% CAGR, outpacing cellulose, diatomaceous earth, and perlite alternatives.
Why are CDMOs increasing their filter purchases?
Modular single-use depth-filtration trains let CDMOs switch client programs in days and avoid the high capital and cleaning costs of stainless-steel clarifiers, driving a 10.41% CAGR in their purchases.
What is driving Asia-Pacific demand?
Domestic CAR-T approvals in China, biosimilar scale-ups in India, and Japan’s fast-track regenerative-medicine rules combine to deliver an 11.07% CAGR through 2031.
How are suppliers addressing raw-material volatility?
Vendors are dual-sourcing cellulose, validating alternative perlite or nanocellulose media, and holding six-month safety stocks to buffer pulp and diatomite price swings.
Page last updated on:


 Your data is secure and never sold or shared.


