Dental Simulator Market Size and Share
Market Overview
| Study Period | 2020 - 2031 |
|---|---|
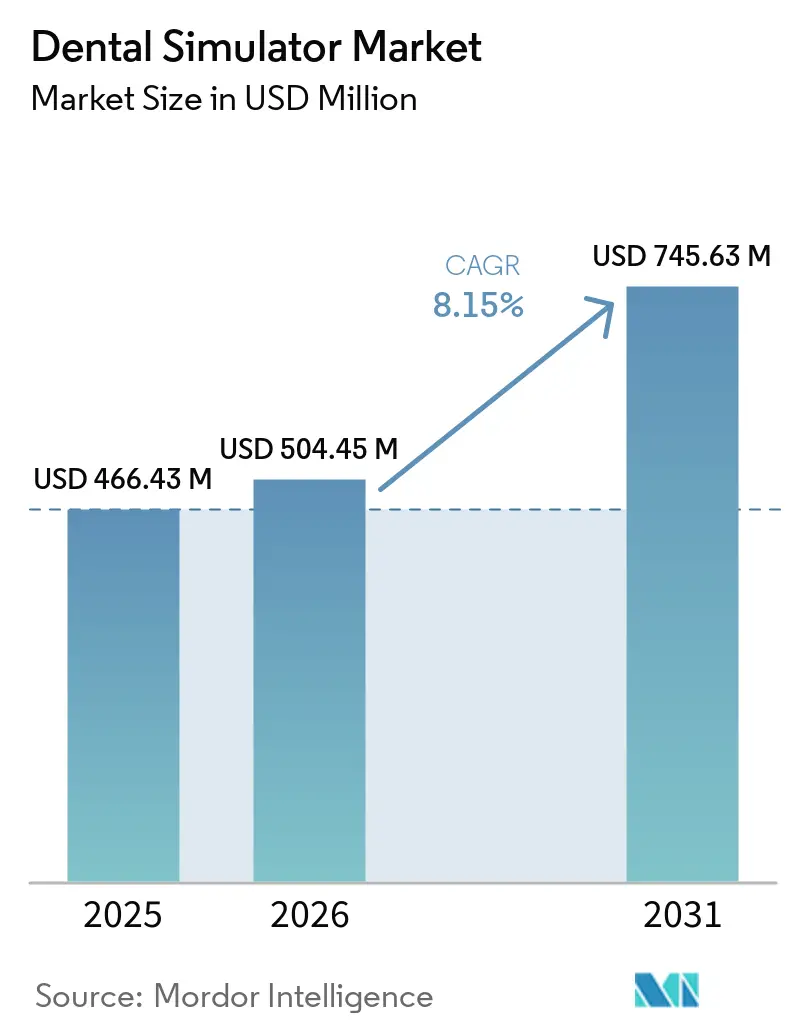
| Market Size (2026) | USD 504.45 Million |
| Market Size (2031) | USD 745.63 Million |
| Growth Rate (2026 - 2031) | 8.15% CAGR |
| Fastest Growing Market | Asia Pacific |
| Largest Market | North America |
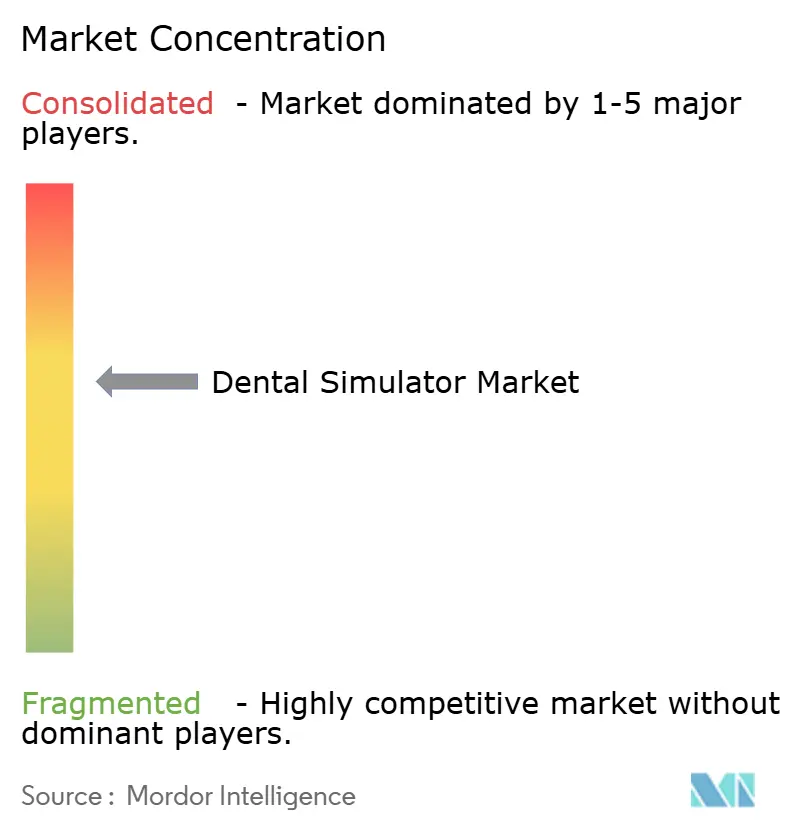
| Market Concentration | Medium |
Major Players *Disclaimer: Major Players sorted in no particular order Image © Mordor Intelligence. Reuse requires attribution under CC BY 4.0. | |
Dental Simulator Market Analysis by Mordor Intelligence
Dental simulator market size in 2026 is estimated at USD 504.45 million, growing from 2025 value of USD 466.43 million with 2031 projections showing USD 745.63 million, growing at 8.15% CAGR over 2026-2031. Sustained expansion reflects the switch from plastic typodonts to immersive virtual-reality and haptic systems that cut consumable waste, shorten learning curves, and support larger class sizes without proportional faculty increases. Hardware remains the largest cost center, yet the most rapid value creation now lies in cloud software that tracks performance data and supports remote learning. Institutions embrace these tools because they lower per-student training costs once the initial infrastructure is in place. Regional demand patterns show mature North American schools upgrading legacy manikins, while Asia-Pacific universities build new capacity that leapfrogs straight to VR.
Key Report Takeaways
- By component, hardware held 63.72% of the dental simulator market share in 2025; software is projected to grow at a 10.05% CAGR to 2031.
- By technology, mechanical simulators led with 35.98% revenue share in 2025, whereas virtual reality solutions are set to expand at a 10.42% CAGR through 2031.
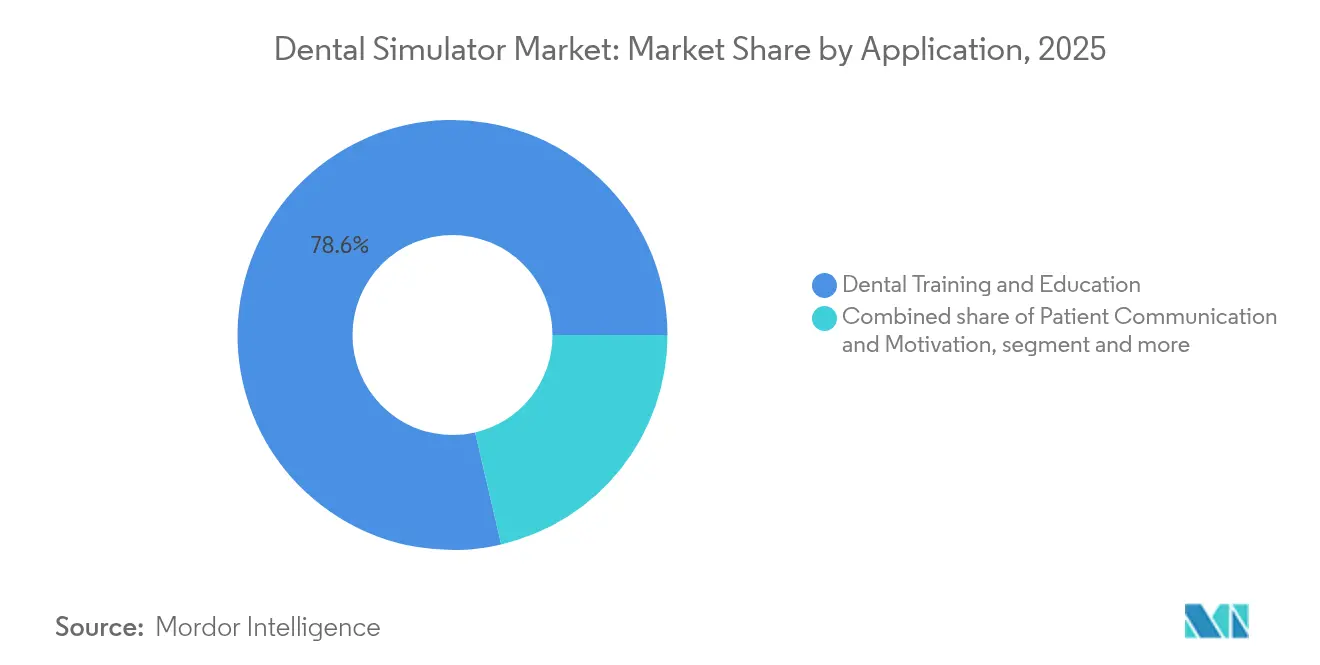
- By application, dental training and education commanded 78.64% share of the dental simulator market size in 2025 and treatment planning is poised for 9.26% CAGR growth to 2031.
- By end user, dental schools accounted for 55.12% of the dental simulator market size in 2025, while dental clinics record the fastest uptake at 9.34% CAGR.
- By geography, North America captured 38.45% of the dental simulator market share in 2025; Asia-Pacific registers the highest CAGR at 10.61% through 2031.
Note: Market size and forecast figures in this report are generated using Mordor Intelligence’s proprietary estimation framework, updated with the latest available data and insights as of 2026.
Global Dental Simulator Market Trends and Insights
Drivers Impact Analysis*
| Driver | (~)% Impact on CAGR Forecast | Geographic Relevance | Impact Timeline |
|---|---|---|---|
| Rising VR/AR & haptic-feedback innovations | +2.1% | Global, led by North America & Europe | Medium term (2-4 years) |
| Expansion of dental education programs & seats | +1.8% | Asia-Pacific core; MEA & Latin America follow | Long term (≥4 years) |
| Demand for minimally-invasive, simulation-based skill assessment | +1.4% | Global, especially regulated markets | Short term (≤2 years) |
| AI-driven performance analytics integration | +1.2% | North America & EU expanding to APAC | Medium term (2-4 years) |
| Synergy with low-cost 3-D-printed anatomical models | +0.9% | Cost-sensitive markets worldwide | Short term (≤2 years) |
| Sustainability push to curb plastic typodont waste | +0.7% | EU leads; North America follows | Long term (≥4 years) |
| Source: Mordor Intelligence | |||
Rising VR/AR & haptic-feedback innovations
Institutions increasingly deploy haptic devices that replicate tissue resistance, allowing students to refine fine-motor skills without patient risk. A 2024 multi-country study of 156 dental schools reported higher manual-dexterity scores and lower anxiety among cohorts trained first on VR simulators.[1] The growing adoption of VR- and AI-enabled Simulation Software is transforming dental education by improving real-time skill assessment, treatment planning, and immersive clinical training experiences. Immersive systems also compress practice hours needed to reach competency, freeing pre-clinical chair time for larger intakes. The result is a compelling payback story that offsets hardware sticker prices and drives procurement cycles. Vendors respond by upgrading force-feedback fidelity and expanding procedure libraries, supporting wider curriculum coverage. As costs fall, smaller programs join early adopters, broadening the installed base worldwide.
Expansion of dental education programs & seats
Governments tackling oral-health workforce shortages authorize new schools and raise seat caps, especially across China, India, and Southeast Asia. The U.S. Senate’s 2025 appropriations bill further funds pre-doctoral grants tied to competency-based learning environments.[2]VideaHealth, “Ascend Academic Platform Expansion,” videa.ai More seats intensify pressure on physical clinics, making simulation suites a necessity rather than a luxury. Accreditation boards now expect objective performance data, pushing institutions to integrate digital logbooks and analytics dashboards. Capital earmarks for faculty recruitment increasingly bundle requests for modern training labs, reinforcing steady hardware pipelines and subsequent software subscriptions.
Demand for minimally-invasive, simulation-based skill assessment
Faculty shift toward data-driven rubrics that grade prep depth, marginal integrity, and cutting angles in microns instead of subjective pass-fail judgments. A 2025 cross-sectional study at Ziauddin University found 68.6% of students rating VR and manikin training equally useful, yet 77.7% felt more confident when simulators quantified their work. Objective metrics satisfy regulators and reduce variance between examiners, streamlining remediation. The approach gained urgency during the COVID-19 pandemic, proving that skill verification can proceed when patient access is restricted. Institutions now embed digital assessments into summative exams, cementing demand for analytics-ready simulators.
AI-driven performance analytics integration
Machine-learning modules compare hand-piece angles and bur pressure against expert datasets, generating real-time hints and adaptive lesson plans. VideaHealth’s cloud engine, recently added to Henry Schein One’s Ascend Academic platform, exemplifies this shift toward intelligent tutoring systems. Automated scoring reduces faculty workload, allowing instructors to focus on coaching higher-order reasoning. Investors notice: dental AI firms attracted more than USD 140 million in venture funding during 2024, supporting continued algorithm improvements. The net effect is faster skill acquisition, lower remediation hours, and higher overall pass rates, reinforcing the technology’s return-on-investment case.
Restraints Impact Analysis*
| Restraint | (~)% Impact on CAGR Forecast | Geographic Relevance | Impact Timeline |
|---|---|---|---|
| High capital & maintenance outlay | -1.9% | Global; hardest on small schools | Short term (≤2 years) |
| Sparse reimbursement / institutional funding pathways | -1.3% | Developing markets; some EU regions | Medium term (2-4 years) |
| Validation & accreditation hurdles for new simulators | -0.8% | Worldwide; strictest in regulated areas | Long term (≥4 years) |
| Faculty digital-pedagogy skill gap | -0.6% | Global; more in traditional settings | Medium term (2-4 years) |
| Source: Mordor Intelligence | |||
High capital & maintenance outlay
Top-tier VR-haptic rigs cost USD 150,000–300,000 each, plus annual service contracts reaching 20% of purchase price. A 2024 survey ranked financial limitation as the second-largest barrier to adoption, cited by 28% of respondents. Smaller programs struggle to secure loans or grants, delaying fleet upgrades. Total cost also includes HVAC retrofits, IT support desks, and instructor retraining, doubling headline figures. Vendors now offer lease models and usage-based pricing, but up-front sticker shock still slows near-term demand.
Sparse reimbursement / institutional funding pathways
Unlike diagnostic scanners that bill insurers, simulation units generate no direct revenue, leaving schools to reallocate tuition or rely on philanthropy. U.S. federal grants do not earmark capital for simulators, forcing deans to justify spend against scholarships and faculty hires. Public universities in emerging economies face similar constraints, with currency swings inflating import prices. Without clear ROI metrics, finance committees often defer purchases, creating elongated sales cycles.
*Our forecasts treat driver/restraint impacts as directional, not additive. The impact forecasts reflect baseline growth, mix effects, and variable interactions.
Segment Analysis
By Component: Hardware Infrastructure Drives Market Foundation
Hardware captured 63.72% revenue in 2025, underscoring that physical rigs remain the entry ticket to simulation-enabled curricula. Institutions allocate grant funds first to multi-station haptic labs, then layer software licences that enrich user experience. Once installed, the same rig can support new modules, so incremental growth skews toward SaaS. Software’s 10.05% CAGR through 2031 outpaces hardware because cloud dashboards and AI scoring engines carry lower marginal cost and tap wider cohorts. Remote-access capability gained relevance during pandemic disruptions, prompting schools to budget for secure VPNs and web-based viewers. Vendors ship frequent updates that add procedures, ensuring that earlier hardware investments stay current without repeat capital outlays. On-premises solutions persist where internet bandwidth is limited or data privacy laws restrict cloud storage. Yet multi-campus institutions increasingly favour centralised platforms to streamline IT support. The interplay between servers, sensors, and analytic layers means procurement teams now negotiate total-cost bundles rather than piecemeal items, reshaping the sales cycle of the dental simulator market.
Second-generation rigs also prolong the hardware replacement cycle, as modular controllers accept new handpieces and imaging peripherals. Schools planning expansions prefer scalable rack designs that grow from 10 to 40 seats without rewiring electrical grids. Refurbished units hit secondary markets, widening geographic reach into lower-income countries. The cascading effect sustains baseline demand even as mature campuses transition to software-led value creation. Consequently, hardware remains the largest line item, yet value capture steadily migrates toward the predictive-analytics layer.


By Technology: VR Disrupts Mechanical Simulator Dominance
lower initial costs. They excel at teaching hand-piece angulation and basic ergonomics, so many programs use them as first-step practice. However, the virtual reality segment expands at 10.42% CAGR, signalling a paradigm shift toward immersive fidelity. A 2024 Finnish study showed VR-first cohorts outperforming peers on manual-dexterity metrics and reporting reduced stress. VR’s ability to simulate soft-tissue feedback and real-time bleeding scenarios better mirrors clinical complexity, shortening transition time to live patients. Augmented-reality overlays add dynamic guides to physical typodonts, blending tactile familiarity with digital cues. Mixed-reality suites, though niche, integrate live CBCT images into procedural rehearsal for complex surgeries. As GPU prices drop and optic-tracking latency improves, VR units move beyond early adopter labs into mainstream classroom layouts, solidifying their role as core infrastructure across the dental simulator market.
Open-platform architectures enable third-party developers to push specialty modules such as implantology or microscopic endodontics, increasing utilisation rates. Eye-tracking sensors log gaze patterns, allowing AI tutors to coach ergonomic positioning. These micro-innovations differentiate premium systems and justify higher pricing tiers. Mechanical rigs evolve too, increasingly embedding force sensors and digital scoring, blurring categorical lines. Still, institutional spending tilts toward VR because it packages training, assessment, and feedback in one environment, yielding measurable competency gains.
By Application: Treatment Planning Emerges Beyond Traditional Training
Training and education represented 78.64% revenue in 2025, reflecting long-standing dependence on simulators for pre-clinical skill building. Yet treatment planning applications grow at 9.26% CAGR, signalling broader clinical integration. AI engines now overlay radiographs onto virtual jaws, letting students simulate crown prep and orthodontic alignments before touching a patient. A 2025 case-based teaching study reported improved diagnostic accuracy and communication skills when VR planning was part of daily coursework.Such capabilities elevate simulators from practice dummies to decision-support tools. Patient-motivation uses also rise as clinicians invite individuals to explore interactive models of proposed restorations, improving consent rates.
Simulation-enabled planning aligns with value-based care incentives because mistakes are caught digitally rather than chairside, lowering material waste and appointment times. As AI prognostic modules mature, they integrate insurance codes and cost estimates, aiding case acceptance. Continuing-education providers bundle these features into subscription portals, contributing steady annuity income to vendors. Therefore, market value migrates toward multi-functional platforms that accompany learners through the full clinical lifecycle.
By End User: Dental Clinics Accelerate Adoption for Continuing Education
Dental schools held 55.12% of spending in 2025 thanks to curriculum mandates and accreditation criteria that require objective skill-log evidence. However, dental clinics show 9.34% CAGR as practitioners face rapid technology turnover—from CAD/CAM to laser dentistry—that necessitates ongoing up-skilling. Larger group practices install compact simulators in break rooms for refresher drills, cutting downtime caused by external CE courses. Hospitals employ specialty modules for maxillofacial residents, while research institutes leverage high-fidelity rigs to test biomaterials under repeatable conditions.
Clinic adoption also capitalizes on broader tele-dentistry trends; staff rehearse digital workflows involving intra-oral scanners and AI radiograph triage before rolling out to patients. Insurance providers begin to reimburse remote competencies, encouraging practice owners to invest. Institutional learning-management systems now integrate CE credits auto-generated from simulator logs, streamlining licensure renewal. This blurs the line between education and service delivery, anchoring long-term device utilization and recurring SaaS revenue within the dental simulator market.
Geography Analysis
North America commands 38.45% of 2025 revenue, anchored by well-funded U.S. dental schools that replace legacy mechanical units on predictable grant cycles. Federal grants tied to pediatric dentistry specify competency-based outcomes, nudging programs toward metrics-rich VR platforms. Canada’s public universities follow suit, and Mexican private schools view simulators as differentiators in student recruitment. Venture capital ecosystems in Boston, San Francisco, and Toronto back AI firms that plug seamlessly into hardware makers, accelerating regional ecosystem maturity.
Asia-Pacific posts the fastest 10.61% CAGR through 2031. China adds new dental programs each year to meet national oral-health targets, often skipping manikins entirely in favour of VR-first labs. India’s private colleges compete for student fees by advertising simulator seat-hours, while government subsidies offset customs duties on imported rigs. Japan and South Korea lead in mixed-reality applications, pairing simulators with robotic patient mannequins for comprehensive OSCE exams. Australia leverages distance-learning features to service remote campuses, highlighting software’s role in bridging geographic gaps across the dental simulator market.
Europe benefits from a robust regulatory push toward sustainability, favouring digital platforms that eliminate single-use plastics. Germany’s engineering sector supplies precision haptic components, while the UK integrates AI modules into national dental curriculum standards. Nordic countries pioneer carbon-accounting frameworks that treat simulator adoption as a measurable emissions-reduction action. Southern European schools upgrade more slowly due to fiscal austerity, yet EU development funds earmarked for digital education close part of the gap.
The Middle East and Africa remain nascent but promising. Gulf universities position top-tier simulators as magnets for international students, whereas South Africa’s public system pilots low-cost manikin-VR hybrids. South America shows steady adoption; Brazilian universities incorporate VR in specialty diplomas, while Chile’s public-private partnerships subsidize technology upgrades in exchange for rural service commitments.


Competitive Landscape
Competition is moderately fragmented with a blend of long-standing dental-equipment brands and newer pure-play simulation firms. Market leaders bundle haptic hardware, procedural software, and analytics dashboards into turnkey suites, brushing aside single-function rivals. AI start-ups such as Pearl integrate diagnostic engines that cross-sell into simulation subscriptions, demonstrating software’s power to lock in customers. Established vendors court academic consortia to validate educational outcomes, knowing peer-review publications drive procurement approvals.
Partnerships dominate strategy. Hardware makers team with 3-D-printing specialists to deliver mixed packages of reusable teeth and virtual drills. Cloud providers integrate with university learning-management systems to automate grade export, improving stickiness. The FDA Safety and Performance Based Pathway for dental devices lowers entry barriers for innovative modules, encouraging small companies to focus on niche indications like pediatric pulp therapy. As a result, incumbents hedge by investing in or acquiring agile software firms to maintain ecosystem control.
Price competition centers on total-cost-of-ownership; vendors tout lower servicing ratios, energy-efficient stations, and subscription models that bundle hardware refresh after five years. Clinics increasingly demand portable rigs, opening a segment for tablet-based haptic pens that fit small operatories. Regional distributors add value via local language content and on-site technician networks, influencing adoption curves in emerging markets. Intellectual-property moats hinge on multi-axis force-feedback patents and AI training datasets collected from thousands of student sessions, creating scale advantages yet leaving room for differentiated user-experience design within the dental simulator market.
Dental Simulator Industry Leaders
Dentsply Sirona
3Shape A/S
NISSIN DENTAL PRODUCTS INC.
KaVo Dental
HRV Simulation.
- *Disclaimer: Major Players sorted in no particular order

Recent Industry Developments
- April 2025: University of Eastern Finland’s International Endodontic Journal article showed VR-first protocols reduce learner stress while improving dexterity metrics.
- February 2025: VideaHealth and Henry Schein One deepened collaboration to embed AI diagnostic tools in the Ascend Academic cloud platform, bringing real-time feedback to 7,000 dental-hygiene students entering clinical practice each year.
- January 2025: Ziauddin University published findings showing 68.6% of students rate VR and manikin practice equally useful, with 77.7% reporting higher confidence after manikin training.
- December 2024: University of Eastern Finland research confirmed VR-haptic simulators significantly boost manual skills transfer to clinics.


Global Dental Simulator Market Report Scope
As per the scope of the report, a dental simulator is a training tool used in dental education to simulate various aspects of dental procedures, allowing students to practice and develop their skills in a controlled and realistic environment before working on actual patients.
The dental simulator market is segmented by component, application outlook, end user, and geography. The market is segmented by component into hardware and software. The market is segmented by application outlook into dental training & education and treatment planning. Based on end user, the market is segmented into dental schools, hospitals, and dental clinics. By geography, the market is segmented into North America, Europe, Asia-Pacific, and Rest of the World. The report also offers the market sizes and forecasts for 13 countries across the regions. For each segment, the market sizing and forecasts were made on the basis of value (USD).
| Hardware | |
| Software | On-premise |
| Cloud-based |
| Virtual Reality (VR) |
| Augmented Reality (AR) |
| Mechanical Simulators |
| Others |
| Dental Training and Education |
| Treatment Planning |
| Patient Communication and Motivation |
| Dental Schools |
| Hospitals |
| Dental Clinics |
| Academic & Research Institutes |
| North America | United States |
| Canada | |
| Mexico | |
| Europe | Germany |
| United Kingdom | |
| France | |
| Italy | |
| Spain | |
| Rest of Europe | |
| Asia-Pacific | China |
| Japan | |
| India | |
| Australia | |
| South Korea | |
| Rest of Asia-Pacific | |
| Middle East and Africa | GCC |
| South Africa | |
| Rest of Middle East and Africa | |
| South America | Brazil |
| Argentina | |
| Rest of South America |
| By Component | Hardware | |
| Software | On-premise | |
| Cloud-based | ||
| By Technology | Virtual Reality (VR) | |
| Augmented Reality (AR) | ||
| Mechanical Simulators | ||
| Others | ||
| By Application | Dental Training and Education | |
| Treatment Planning | ||
| Patient Communication and Motivation | ||
| By End User | Dental Schools | |
| Hospitals | ||
| Dental Clinics | ||
| Academic & Research Institutes | ||
| Geography | North America | United States |
| Canada | ||
| Mexico | ||
| Europe | Germany | |
| United Kingdom | ||
| France | ||
| Italy | ||
| Spain | ||
| Rest of Europe | ||
| Asia-Pacific | China | |
| Japan | ||
| India | ||
| Australia | ||
| South Korea | ||
| Rest of Asia-Pacific | ||
| Middle East and Africa | GCC | |
| South Africa | ||
| Rest of Middle East and Africa | ||
| South America | Brazil | |
| Argentina | ||
| Rest of South America | ||


Key Questions Answered in the Report
What is the current size of the dental simulator market?
The dental simulator market stands at USD 504.45 million in 2026 and is projected to reach USD 745.63 million by 2031.
Which component segment grows fastest?
Software registers the quickest pace, expanding at a 10.05% CAGR as institutions add cloud analytics once hardware labs are installed.
Why are dental clinics investing in simulators?
Clinics adopt simulators for continuing education and new-procedure training, recording a 9.34% CAGR because in-house practice reduces travel and course fees.
Which region shows the highest growth rate?
Asia-Pacific leads with a 10.61% CAGR through 2031, driven by new dental schools in China, India, and Southeast Asia.
Page last updated on:


