
Mobile Clinics Market Size and Share
Market Overview
| Study Period | 2020 - 2031 |
|---|---|
| Market Size (2026) | USD 6.24 Billion |
| Market Size (2031) | USD 9.15 Billion |
| Growth Rate (2026 - 2031) | 7.96 % |
| Fastest Growing Market | Asia-Pacific |
| Largest Market | North America |
| Market Concentration | Medium |
Major Players *Disclaimer: Major Players sorted in no particular order Image © Mordor Intelligence. Reuse requires attribution under CC BY 4.0. | |
Mobile Clinics Market Analysis by Mordor Intelligence
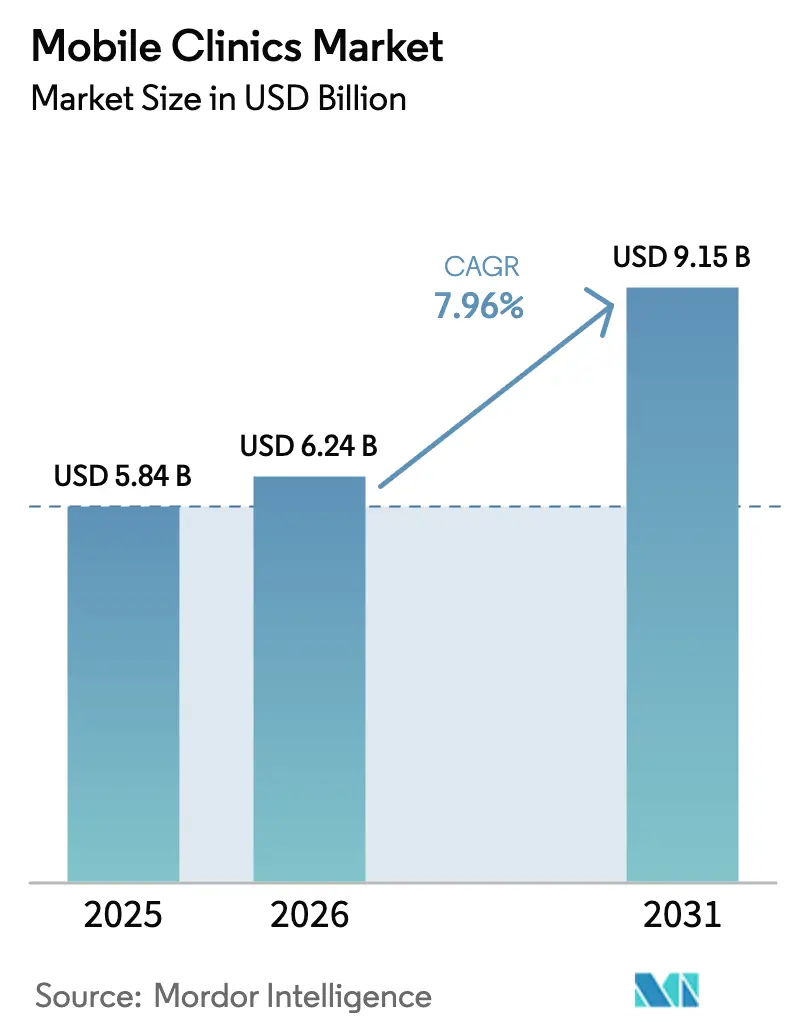
The Mobile Clinics Market size is expected to grow from USD 5.84 billion in 2025 to USD 6.24 billion in 2026 and is forecast to reach USD 9.15 billion by 2031 at 7.96% CAGR over 2026-2031.
The shift toward distributed care, backed by federal and state incentives, is reshaping capital allocation as health systems look for faster payback alternatives to brick-and-mortar builds. Medicaid parity laws, multi-year rural-health grants, and clearer licensing rules are pushing mobile units into mainstream strategy. Operators are broadening service menus, adding AI diagnostics and telehealth links to raise reimbursement levels while holding down fixed costs. At the same time, cash-flow pressure, workforce shortages, and unit throughput limits temper expansion plans, forcing providers to weigh fleet mix, route density, and staffing models with greater precision.
Key Report Takeaways
- By clinic type, OPD clinics led with 27.63% revenue share in 2025; maternal health units are projected to grow at a 10.34% CAGR through 2031.
- By vehicle type, mobile medical vans accounted for 49.75% share in 2025; trailers are set to record the fastest 11.33% CAGR to 2031.
- By design layout, single-exam-room configurations held 78.24% share in 2025; expandable modular pods are poised for a 12.53% CAGR across the forecast.
- By service model, primary and preventive care dominated with 31.63% share in 2025; telehealth-enabled follow-up is forecast to advance at a 12.84% CAGR through 2031.
- By end user, hospitals and health systems captured 39.74% share in 2025; military and defense deployments are expected to expand at a 10.44% CAGR to 2031.
- By technology integration, telehealth-enabled units led with 36.37% share in 2025; AI-supported diagnostics configurations are projected to witness an 11.65% CAGR over the period.
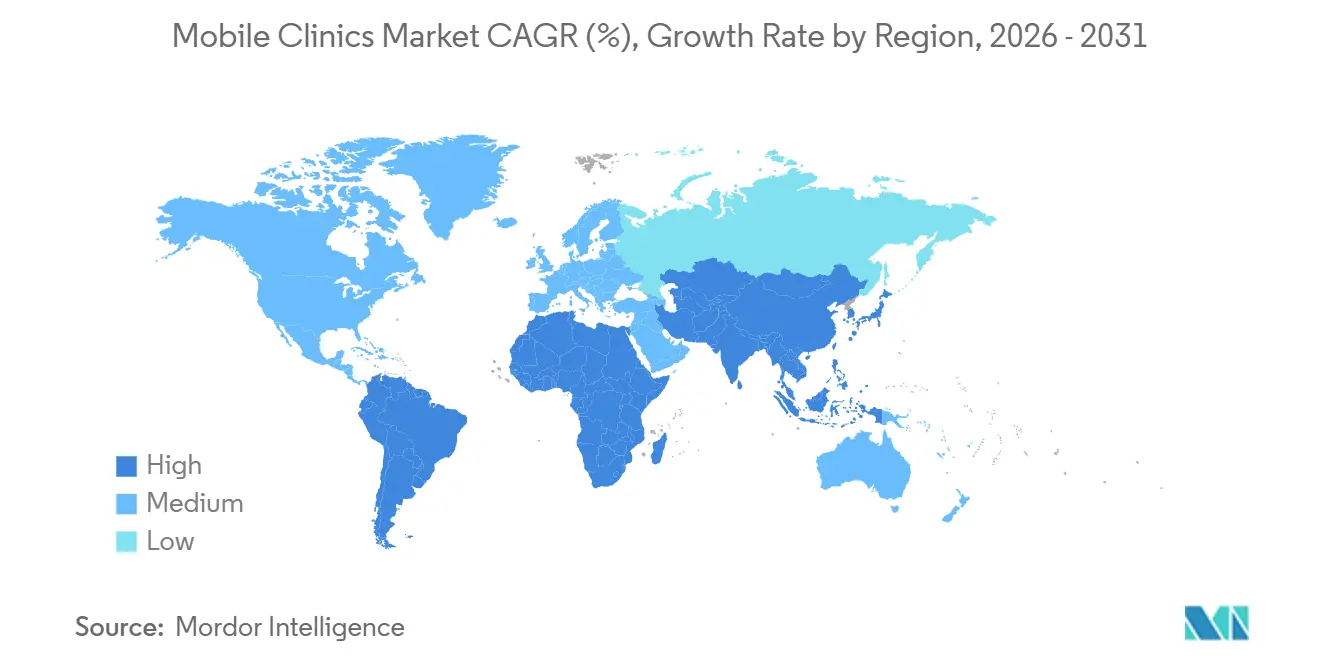
- By geography, North America held 35.84% of revenue in 2025; Asia-Pacific is anticipated to grow at a 9.32% CAGR, the fastest among regions.
Note: Market size and forecast figures in this report are generated using Mordor Intelligence’s proprietary estimation framework, updated with the latest available data and insights as of January 2026.
Global Mobile Clinics Market Trends and Insights
Drivers Impact Analysis*
| Driver | (~) % Impact on CAGR Forecast | Geographic Relevance | Impact Timeline |
|---|---|---|---|
| Rising burden of chronic diseases & emergencies | +1.8% | North America, Europe | Medium term (2-4 years) |
| Cost-effective remote patient monitoring | +1.5% | United States, India, China | Short term (≤ 2 years) |
| Growth in geriatric population | +1.3% | Japan, Germany, Italy | Long term (≥ 4 years) |
| Government funding for rural outreach | +1.6% | North America, Sub-Saharan Africa, India | Short term (≤ 2 years) |
| AI-enabled portable diagnostics | +1.2% | North America, Europe, urban APAC | Medium term (2-4 years) |
| Shift to zero-emission or solar powertrains | +0.9% | Europe, select U.S. states, East Africa | Long term (≥ 4 years) |
| Source: Mordor Intelligence | |||
Rising Burden of Chronic Diseases & Emergencies
Higher rates of diabetes, hypertension, and trauma keep mobile units busy because they shorten the distance between patients and first-line care. A study conducted in the United States in 2025 found that transportation barriers were linked to greater emergency-department use in 2024, highlighting the value of near-home checkups.[1]Fangyuan Chen, “Transportation Barriers, Emergency Department Use, and Mortality Risk Among US Adults: A National Health Interview Survey Analysis,” BMC Public Health, ncbi.nlm.nih.govCommunity paramedicine teams that ride mobile platforms have already cut 30-day revisit rates, proving the model works for value-based contracts. A single USD 150 mobile visit can avert a USD 1,500 ED episode, an equation that resonates with payers. Unit builders are therefore adding medication reconciliation stations, connected diagnostic kiosks, and home-monitoring device kits so chronic-care workflows fit inside small footprints.
Cost-Effective Remote Patient Monitoring Models
Bluetooth blood-pressure cuffs, glucometers, and pulse oximeters handed out during a mobile visit feed continuous data streams to clinicians. Removing follow-up travel lowers the cost to serve by up to 30% compared with repeat walk-in appointments. The World Health Organization’s 2024 toolkit for AI devices in low-resource settings cleared regulatory doubt and accelerated device rollouts. As infectious-disease testing alone passed USD 12 billion in 2024, mobile units became a preferred distribution channel, earning margin on both the initial visit and data-management services.
Government Funding for Rural-Health Outreach
The Health Resources and Services Administration reserved USD 50 million for new mobile access points in its 2025 budget, making vans and trailers eligible for grants that once favored fixed clinics.[2]Health Resources and Services Administration, “Fiscal Year 2025 New Access Points Funding Opportunity for Health Centers,” Health Resources and Services Administration, hrsa.gov Construction of a rural health center costs USD 2-5 million and needs years to break even, while a mobile unit reaching 25 daily encounters can pay for itself within 18 months. Seventeen U.S. states now reimburse mobile encounters at parity, giving providers the confidence to expand fleets.
AI-Enabled Portable Diagnostics Integration
FDA-cleared AI algorithms now guide ultrasound probes and flag anomalies instantly, letting general practitioners handle scans that once required a radiologist. The National Institutes of Health is funding outcome research on these tools through 2027, signaling likely payment upgrades. A visit that includes an AI ultrasound reimburses at USD 200-300, roughly double a basic primary-care encounter, and thus lifts unit economics.
Restraints Impact Analysis*
| Restraint | (~) % Impact on CAGR Forecast | Geographic Relevance | Impact Timeline |
|---|---|---|---|
| Limited daily patient throughput | -0.8% | Global | Short term (≤ 2 years) |
| High capital and maintenance costs | -1.1% | Low-income markets, global nonprofits | Medium term (2-4 years) |
| Regulatory complexity across jurisdictions | -0.6% | United States, Europe, fragmented APAC | Long term (≥ 4 years) |
| Shortage of dual-licensed driver-clinicians | -0.9% | North America, Europe | Medium term (2-4 years) |
| Source: Mordor Intelligence | |||
Limited Daily Patient Throughput
A single exam room supports roughly 32 encounters in an eight-hour shift. Doubling staff without doubling rooms stalls revenue because space, not people, is the pinch point. Expandable pods help, yet setup adds 20 minutes and chips away at route density. Break-even generally needs 25 to 30 encounters per day, which ultra-rural zones struggle to supply.
High Capital and Maintenance Costs
A well-equipped van costs USD 250,000-400,000; imaging trucks can top USD 700,000. Yearly servicing, calibration, and IT updates add another 15-20% of purchase price. Interest costs remain high, and grant cycles can leave units idle when funding lags. Lower-cost vans thus dominated 49.75% of 2025 deployments.
*Our forecasts treat driver/restraint impacts as directional, not additive. The impact forecasts reflect baseline growth, mix effects, and variable interactions.
Segment Analysis
By Clinic Type: OPD Dominance Masks Maternal Health Surge
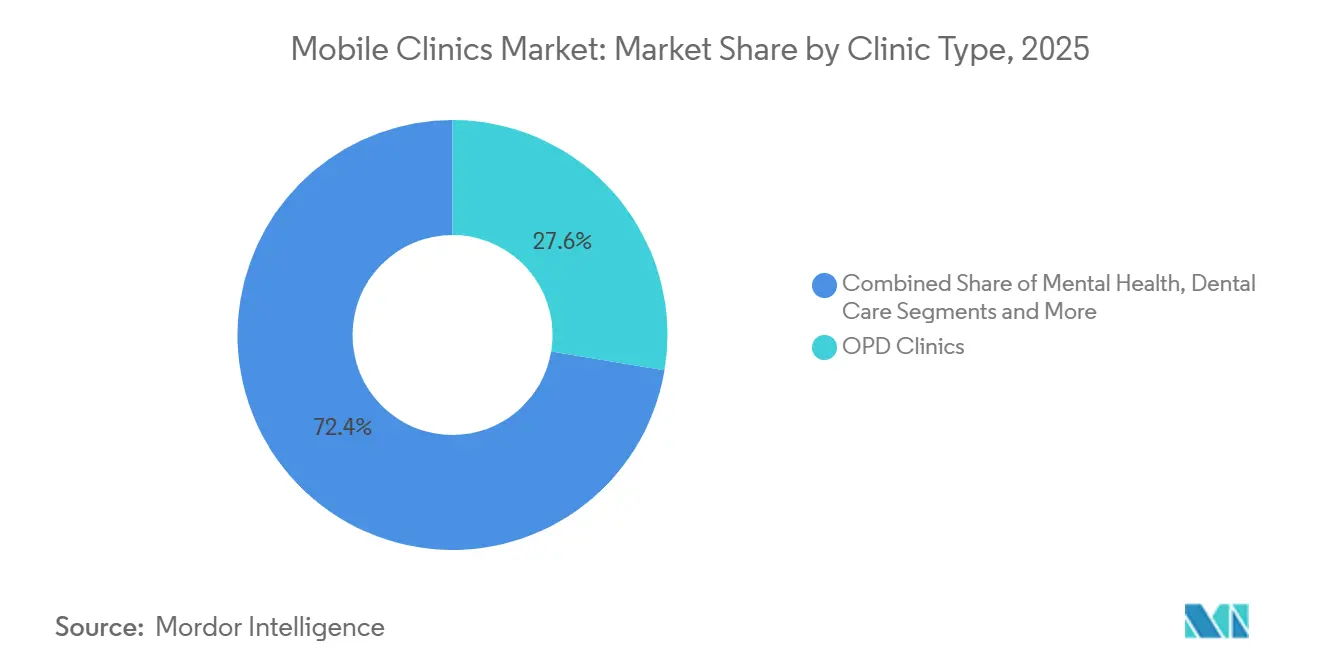
OPD units captured 27.63% of the mobile clinics market share in 2025, due to high-volume vaccinations and chronic-care checkups that require light gear. Maternal health units, though smaller today, are set for a 10.34% CAGR through 2031, powered by prenatal funding priorities and higher per-encounter payments. The World Health Organization positions mobile prenatal care as a pillar of maternal-mortality reduction.[3]World Health Organization Staff, “Maternal Health: Overview,” World Health Organization, who.int These units bundle ultrasound, lab draws, and counseling, turning a single stop into a full visit. Workforce scarcity remains the brake, especially in remote regions where certified midwives are in short supply.



By Vehicle Type: Vans Lead, Trailers Accelerate
Vans owned 49.75% of 2025 revenue because they slip into city blocks and rural lanes at a modest price. Trailers are gaining at an 11.33% CAGR since they decouple clinic modules from tow vehicles, letting owners upgrade interiors without replacing the chassis. Amref’s high-throughput Kenyan fleet shows solar-backed trailers can deliver big-bus capacity for less money. Setup time, however, makes them less ideal for multi-stop days.
By Design Layout: Single Rooms Dominate, Modular Pods Surge
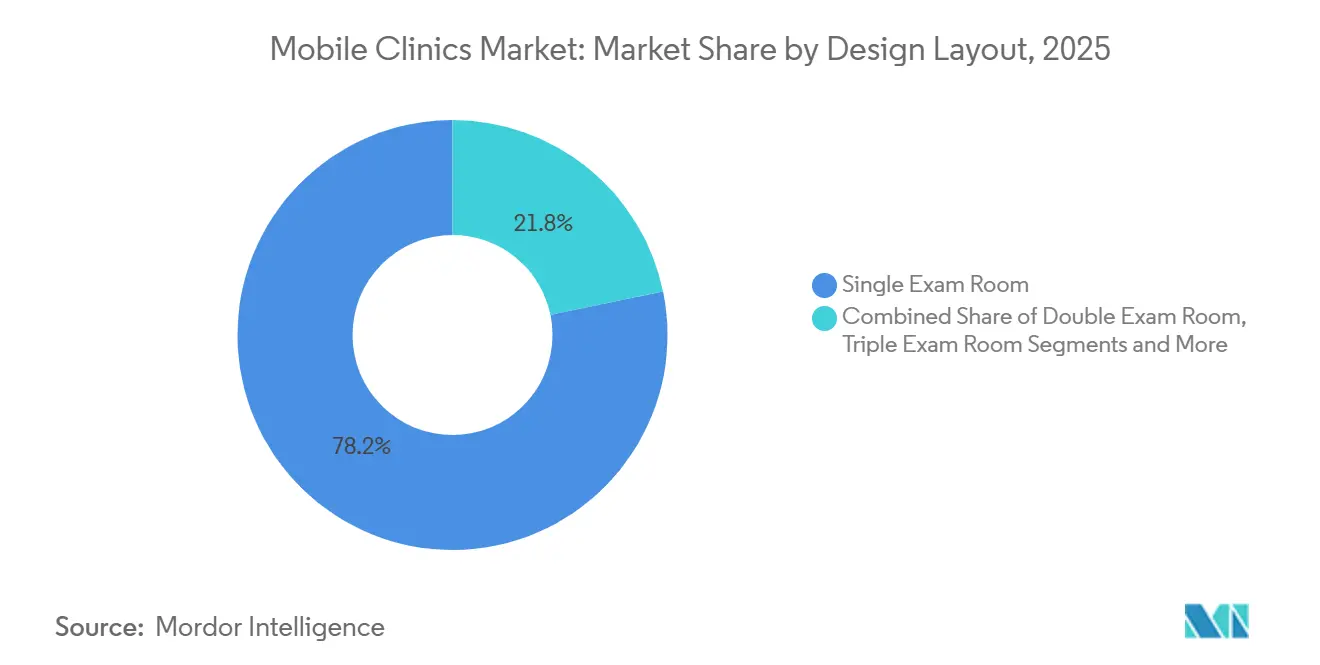
In 2025, single-room layouts accounted for 78.24% of installations due to their straightforward design and ease of staffing. At the same time, convertible pods are growing at a 12.53% CAGR. These pods can expand to accommodate telehealth consultations or rapid screening events and retract for convenient transport. However, certain local regulations classify these pods as temporary structures, requiring fire-code approvals, which extends lead times.
By Service Model: Primary Care Anchors, Telehealth Follow-Up Accelerates
Primary and preventive care held 31.63% of revenue in 2025 as payers reward vaccinations and screenings that stop costlier events downstream. Telehealth follow-up, tied to a 12.84% CAGR, uses the first visit to hand out remote-monitoring kits and schedule virtual reviews, stretching limited clinician-hours. Inconsistent telehealth payment rules remain the primary uncertainty.
By End User: Hospitals Lead, Military Surges
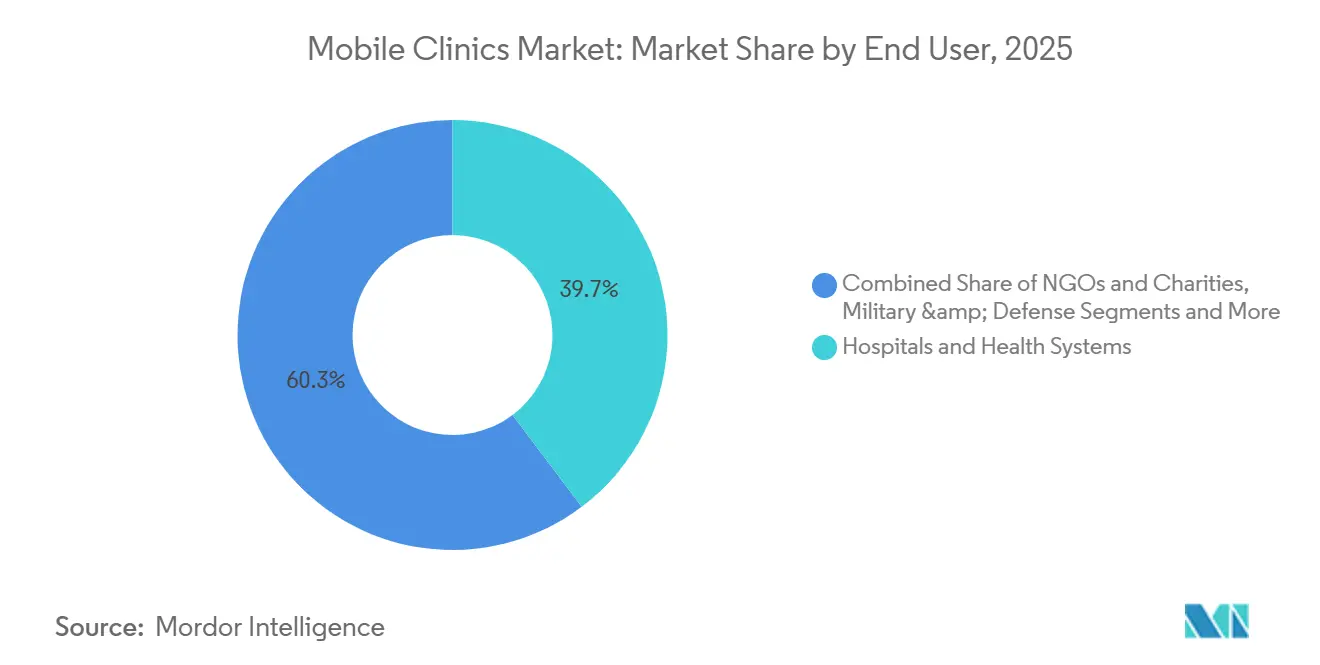
Hospitals and health systems controlled 39.74% of 2025 spend, leveraging balance-sheet heft to fund fleets that support community-benefit goals and lower readmissions. Military and defense users, advancing at 10.44% CAGR, deploy modular, air-liftable clinics that put Role 1 care within minutes of frontline troops. Corporate work-site programs are emerging but need large employee bases to break even.
By Technology Integration: Telehealth Leads, AI Diagnostics Surge
Telehealth-enabled units retained 36.37% share in 2025, reflecting wide acceptance of secure video consults. AI-driven diagnostics, projected at an 11.65% CAGR, promise radiologist-level insights in real time, lifting reimbursement per encounter and shrinking referral costs. Staff training and software updates present ongoing hurdles.
Geography Analysis
North America commanded 35.84% of 2025 revenue on the back of USD 10 billion in annual CMS rural-health disbursements and 17 parity states that pay mobile visits at fixed-clinic rates. Workforce gaps push operators to tele-supervision agreements, yet clinician licensing remains a patchwork.
Asia-Pacific posts the fastest expansion at 9.32% CAGR through 2031. India’s National Health Mission assigned INR 37,000 crore (USD 4.4 billion) for 2024-25, directing mobile fleets into tribal districts. China’s Healthy China 2030 plan funds elder-care vans in rural counties. Regulation, however, varies by country, so local joint ventures often beat direct imports.
Europe, the Middle East and Africa, and South America trail in value but deliver niche upside. The EU’s stricter medical-device rule raises the bar and filters out low-grade imports. Uganda’s USD 5 million solar-clinic program validates renewables in off-grid zones. Brazil and Argentina invest in community outreach to favelas and remote pampas, though currency swings complicate procurement.

Regulatory Landscape
Mobile clinics operate under overlapping rules for healthcare facility licensure, medical-professional practice, and roadworthiness for commercial vehicles, which makes compliance multi-jurisdictional. In the United States, state-level requirements commonly cover registration and inspection of mobile or transportable medical units (for example, Massachusetts Department of Public Health checklists). The clinical technology installed inside the unit also has to meet medical-device regulation, including US FDA oversight for device software functions and certain mobile medical applications.
Outside the United States, dedicated frameworks for mobile healthcare operations are getting clearer. Abu Dhabi Department of Health publishes standards for mobile healthcare services, and Oman Ministry of Health has a Mobile Healthcare Clinics Policy and Guideline that sets operational expectations for staffing, scope of services, and safety. Across deployments, operators and builders also map designs to recognized guidance such as Australasian Health Facility Guidelines for mobile healthcare units and ISO/IWA standards relevant to temporary and rapid-build medical facilities, alongside local fire and life-safety code requirements where units are permitted to park and operate.
Value Chain Analysis
The value chain begins with chassis and specialty upfit, where integrators and converters design and fabricate clinic interiors, power, HVAC, and accessibility features, then integrate clinical equipment such as imaging, screening, point-of-care diagnostics, and IT. The next step is software and connectivity, including EHR and health information exchange integration, telehealth workflows, and cybersecurity. From there, providers handle commissioning, licensing support, and end-user training, followed by ongoing operations that cover recurring staffing, fuel or energy, consumables and cold-chain where required, preventive maintenance and calibration, plus depot-style logistics for resupply and kit management.
Key bottlenecks show up in long build cycles (often six to 12 months), parts availability for specialized medical vehicle components, and routing decisions that have to align with staffing and supply replenishment in remote geographies. Public procurement and grant-funded programs also play a larger role in scaling, including the Philippines Department of Health completing delivery of 28 mobile clinics to Mindanao provinces in September 2024, and US federal innovation funding such as ARPA-H PARADIGM supporting next-generation mobile medical suite development (Mission Mobile Medical, February 2025). These programs reinforce a model where manufacturers, technology providers, and care operators coordinate to meet reporting, interoperability, and service-level requirements.
Competitive Landscape
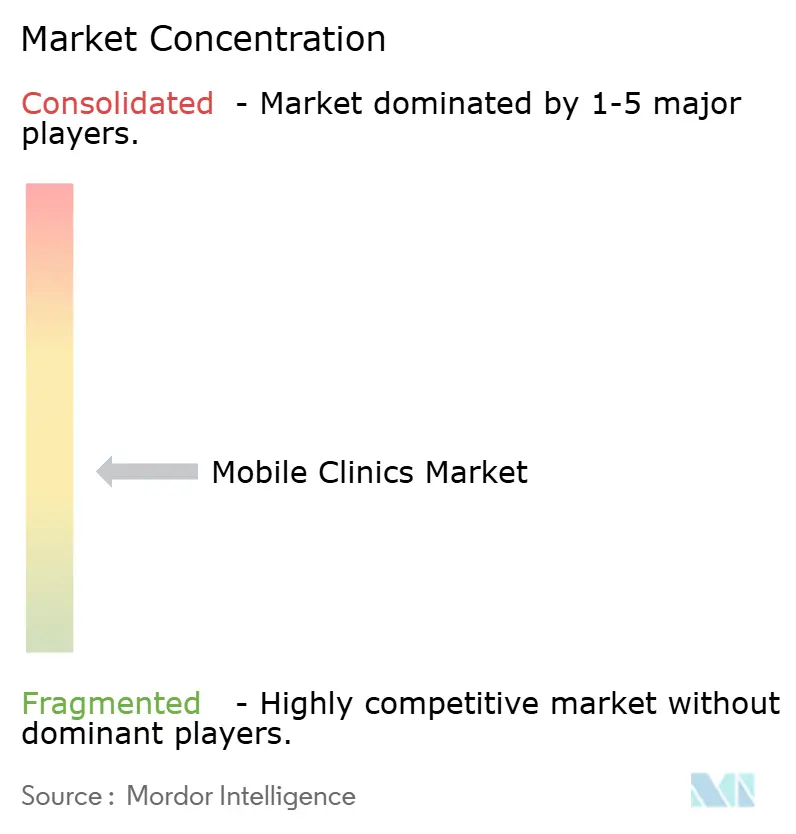
The mobile clinics market remains moderately fragmented. Full-service integrators who bundle chassis, medical gear, EHR links, and maintenance win bigger contracts because they simplify procurement. Small converters survive by tailoring specialty builds such as dental or veterinary vans. Technology is the new battleground. Vendors that drop FDA-cleared AI scanners and telehealth suites into turnkey packages command higher margins. Long build cycles, often six to 12 months, stress cash flow for smaller firms, encouraging future roll-ups.
Mobile Clinics Industry Leaders
ADI Mobile Health
Medical Coaches
Matthews Specialty Vehicles
Odulair LLC.
Farber Specialty Vehicles
- *Disclaimer: Major Players sorted in no particular order

Market Opportunities and Future Outlook
Payment and integration remain the main whitespace for scaling mobile clinics as a routine site of care, especially where reimbursement does not consistently cover travel and setup costs. The United States illustrates the trade-off, with Medicare not treating mobile clinics as a distinct provider category in ways that systematically support mobile delivery economics, while Medicaid flexibility at the state level has enabled parity and broader coverage in some markets. This gap creates room for operators and vendors to package mobile care into contracted, value-based programs with defined outcomes, clear referral pathways, and interoperable data exchange.
Higher-acuity, higher-reimbursement service lines are also gaining traction as a way to improve unit economics, supported by federal and institutional focus on hospital-grade diagnostics, AI-enabled tools, and EHR integration. ARPA-H PARADIGM funding for next-generation mobile medical suites, including Mission Mobile Medical receiving up to USD 26 million in February 2025, points to demand for standardized, technology-forward platforms rather than basic outreach builds. In India, scale is reinforced through formal operating guidance and fleet deployment under the National Health Mission, including 1,453 Mobile Medical Units reported as of September 2025 and updated MMU Guidelines published for 2026, which support repeatable procurement, staffing models, and service menus across states.
Recent Industry Developments
- February 2026: Matthews Specialty Vehicles participated as a sponsor supporting the launch of the National Association of Community Health Centers (NACHC) Center for Mobile Health. The sponsorship links a vehicle builder more closely with a national primary-care network that influences purchasing and operational standards. It also supports more standardized mobile clinic specifications, training, and program replication across community health centers.
- April 2025: Mission Mobile Medical was awarded up to USD 26 million in federal funding under the ARPA-H PARADIGM program to develop next-generation mobile medical suites. The award increases R&D activity around hospital-grade capability in mobile formats, including interoperability and advanced diagnostics. It also raises the bar for competing builders and integrators bidding on government and health-system tenders.
- September 2024: The Philippines Department of Health completed the delivery of 28 mobile clinics to provinces in Mindanao. This delivery added publicly funded capacity and reinforced mobile clinics as a procurement category within government health access programs. Larger multi-unit rollouts like this can shape vendor qualification requirements and local after-sales service expectations.


Research Methodology Framework and Report Scope
Market Definition and Coverage
For this study, the market covers revenues generated by mobile clinics that deliver healthcare and prevention services using movable, self-contained units that travel to communities, and the value is counted based on services delivered through these mobile setups.
Scope exclusions: Fixed-site hospitals and stationary outpatient clinics that do not use mobile units are excluded from this market sizing.
Segmentation Overview
- By Clinic Type
- Emergency Care
- Maternal Health
- ICU & Surgery
- Infant & Neonatal Health
- Geriatric Care
- Diagnostic / Screening
- Mental Health
- Dental Care
- OPD
- Reproductive & Contraceptive Services
- Others
- By Vehicle Type
- Mobile Medical Vans
- Mobile Medical Buses
- Trailers
- Self-Propelled Trucks
- Others
- By Design Layout
- Single Exam Room
- Double Exam Room
- Triple Exam Room
- Expandable Modular Pods
- By Service Model
- Primary & Preventive Care
- Specialty Care
- Diagnostic Imaging Services
- Screening & Vaccination
- Emergency & Disaster Response
- Telehealth-Enabled Follow-Up
- By End-user
- Hospitals & Health Systems
- Government & Public-Health Agencies
- NGOs & Charities
- Private Healthcare Providers
- Military & Defense
- Corporate / Work-Site Programs
- By Technology Integration
- Basic (Minimal Tech)
- Telehealth-Enabled
- AI-Supported Diagnostics
- Advanced Imaging-Equipped
- Renewable / Zero-Emission Powertrain
- By Geography
- North America
- United States
- Canada
- Mexico
- Europe
- Germany
- France
- United Kingdom
- Italy
- Spain
- Rest of Europe
- Asia-Pacific
- China
- Japan
- India
- South Korea
- Australia
- Rest of Asia-Pacific
- Middle East & Africa
- GCC
- South Africa
- Rest of Middle East & Africa
- South America
- Brazil
- Argentina
- Rest of South America
- North America
Data Sources, Market Sizing, and Validation
Desk Research
Desk research starts by mapping mobile healthcare delivery to real world activity, then aligning it with what can be tracked publicly across countries. We reviewed public health statistics and care access indicators from sources such as the World Health Organization, the World Bank, and OECD health datasets, which helped us frame demand signals tied to preventive care and outreach services.
To keep the market definition practical, we also referenced sources such as the US Centers for Disease Control and Prevention, national health ministry releases, and peer-reviewed public health journals for program designs and utilization patterns that often use mobile units. Company annual reports, investor presentations, and reputable news coverage were used to understand service mix, regional focus, and expansion announcements, and we also used a paid subscription database for company financials and another for patent searches to support checks around equipment and care capability claims. The sources listed above are illustrative, and many other public documents were used to collect data, validate assumptions, and clarify gaps.
Primary Interviews and Surveys
Primary work was used to convert broad health access signals into market sizing inputs that fit mobile clinics, where delivery models vary by country and sponsor. We spoke with operators, vehicle upfit and layout specialists, program managers, and care delivery leaders across APAC, EMEA, and the Americas to validate utilization levels, typical service mixes (such as screening versus emergency care), and pricing or reimbursement behaviors, and then to pressure-test growth assumptions before finalizing totals.
Distribution of primary research fieldwork respondents
| Company type | Respondent position | Region |
|---|---|---|
| Top tier: 36% | CXOs: 12% | APAC: 42% |
| Mid tier: 42% | Functional/Unit leaders: 32% | EMEA: 31% |
| Smaller Players: 22% | Managers: 56% | Americas: 27% |
Market-Sizing & Forecasting
The sizing model starts with a top-down build where care access needs and outreach delivery patterns are translated into a demand pool for mobile clinics by region, and then converted into value using service intensity and pricing benchmarks. To keep the result grounded, we corroborated totals with selective bottom-up approximations, such as sampled operator revenue ranges, rough unit counts by program type, and simple ASP x volume checks for high-visibility services like diagnostic and screening visits.
Key inputs used in the model include the regional split of mobile clinic activity, the mix of clinic types (such as diagnostic and screening, maternal health, emergency care, and geriatric care), average days deployed per unit, typical patient throughput per day, and the design layout footprint (single, double, or triple exam rooms) because it influences capacity and revenue potential. Vehicle type assumptions (vans versus buses) were also used as a proxy for service capability and cost structure, and gaps in public data were handled by applying ranges from interviews, followed by conservative midpoint selection when evidence was mixed.
For forecasting, we used scenario analysis anchored on expected outreach funding stability, program scaling speed, and adoption of integrated technology in mobile units, and then aligned those scenarios with expert consensus from interviews. Where regional indicators moved in different directions, we tempered the forecast so implied utilization and price growth stayed consistent with what operators described as feasible.
Data Validation & Update Cycle
Outputs were checked through multiple layers, starting with cross-checks against independent signals like regional healthcare access initiatives, fleet expansion announcements, and shifts in preventive screening programs that commonly use mobile delivery. We then reviewed anomalies, such as sharp regional jumps or unusual price moves, and those points triggered follow-up calls or re-checks of the underlying input ranges.
Before sign-off, the full model is reviewed by another analyst to confirm that scope, math, and assumptions are consistent across regions and clinic types, and that no double counting is introduced between service categories. Reports are refreshed annually, with interim updates made when major policy changes, funding swings, or large deployments materially change the outlook, and a final pre-delivery pass is completed so clients receive the latest updated view.
Mordor Intelligence's Global Mobile Clinics Market Size Versus Other Published Estimates
Published market values for mobile clinics often do not match because groups define a mobile clinic differently, and because they apply different utilization and pricing assumptions by region. Currency conversion timing, the year selected for the base value, and how quickly inputs get refreshed also drive visible gaps.
The main gap comes from whether adjacent categories like broader mobile medical units are blended into the same bucket, where Mordor Intelligence counts only mobile clinic revenues tied to defined clinic types and layouts, and then tests the totals using deployment and throughput checks by region.
Benchmark comparison
| Source | Market Size | Gaps in Research Methodology |
|---|---|---|
| Mordor Intelligence | USD 5.84 B (2025) | |
| Industry Research Group A | USD 2.10 B (2025) | Often closer to mobile health clinic programs only, which can exclude higher-acuity clinic types and undercount larger vehicle formats, thereby compressing the revenue pool. |
| Global Analytics Publisher B | USD 3.50 B (2023) | Uses an earlier base year and tends to blend a wider set of mobile clinic types, while applying broad growth assumptions that are not always tied back to regional deployment intensity or exam room capacity. |
The spread in the table mostly reflects scope choice and the year used for sizing, followed by differences in how utilization and pricing are converted into revenue. When the market is anchored to observable clinic types, vehicle formats, and practical capacity signals, the resulting total is easier to reproduce and update as conditions change.


Key Questions Answered in the Report
How large is the mobile clinics market in 2026?
The mobile clinics market size is USD 6.24 billion in 2026.
What is the expected CAGR for mobile clinics through 2031?
The market is forecast to expand at a 7.96% CAGR to 2031.
Which clinic type is growing the fastest?
Maternal health units are projected to post a 10.34% CAGR between 2026 and 2031.
Why are trailers gaining popularity?
Trailers let operators upgrade clinical modules without replacing the tow vehicle and are growing at an 11.33% CAGR.
Which region is expanding the quickest?
Asia-Pacific is the fastest-growing region, advancing at a 9.32% CAGR through 2031.
Page last updated on:





