Deep Packet Inspection And Processing Market Size and Share
Market Overview
| Study Period | 2020 - 2031 |
|---|---|
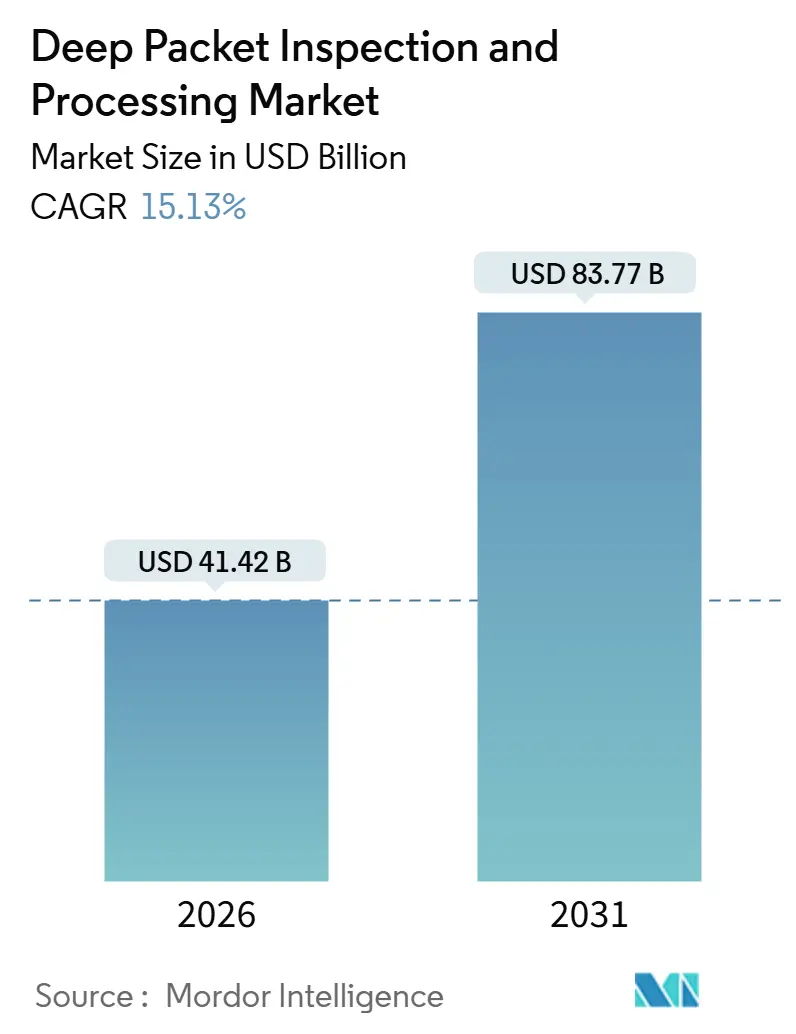
| Market Size (2026) | USD 41.42 Billion |
| Market Size (2031) | USD 83.77 Billion |
| Growth Rate (2026 - 2031) | 15.13% CAGR |
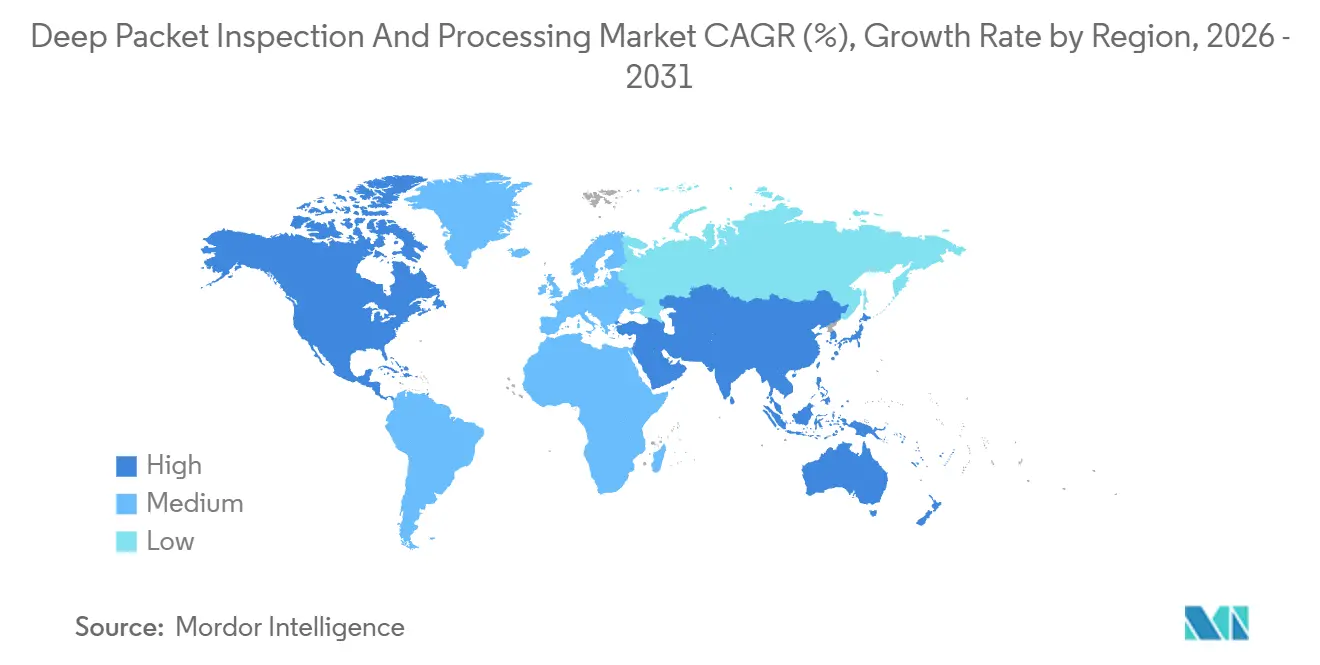
| Fastest Growing Market | Asia Pacific |
| Largest Market | North America |
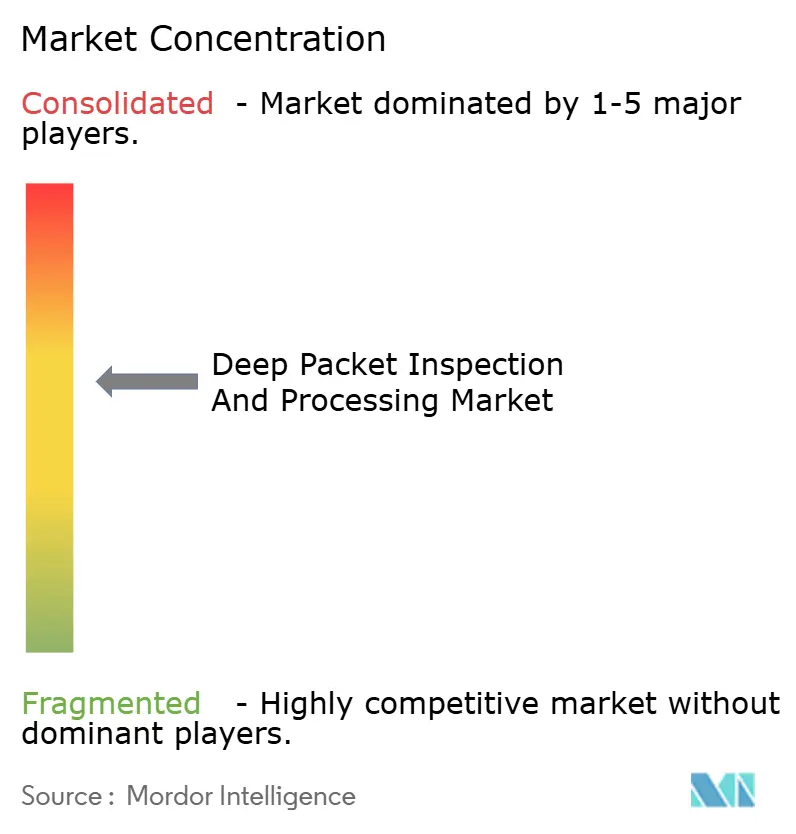
| Market Concentration | Medium |
Major Players *Disclaimer: Major Players sorted in no particular order Image © Mordor Intelligence. Reuse requires attribution under CC BY 4.0. | |
Deep Packet Inspection And Processing Market Analysis by Mordor Intelligence
The deep packet inspection market size is valued at USD 41.42 billion in 2026 and is projected to reach USD 83.77 billion by 2031, translating into a 15.13% CAGR. Encrypted web traffic now eclipses 95% of enterprise sessions, pushing security teams to seek packet-level insight without decryption; 5G network slicing embeds policy enforcement inside the user-plane, forcing operators to inspect flows at the radio edge; and zero-trust frameworks require continuous verification of every packet, erasing what is left of the perimeter. Software-defined engines are outpacing purpose-built appliances because carriers and cloud providers need elastic capacity that scales from 10 Gbps at branch sites to terabit rates in hyperscale data centers. Regulation adds fuel, as data-retention rules in Europe and lawful-intercept mandates in the Middle East oblige service providers to archive metadata for up to two years while staying within latency and privacy guardrails.
Key Report Takeaways
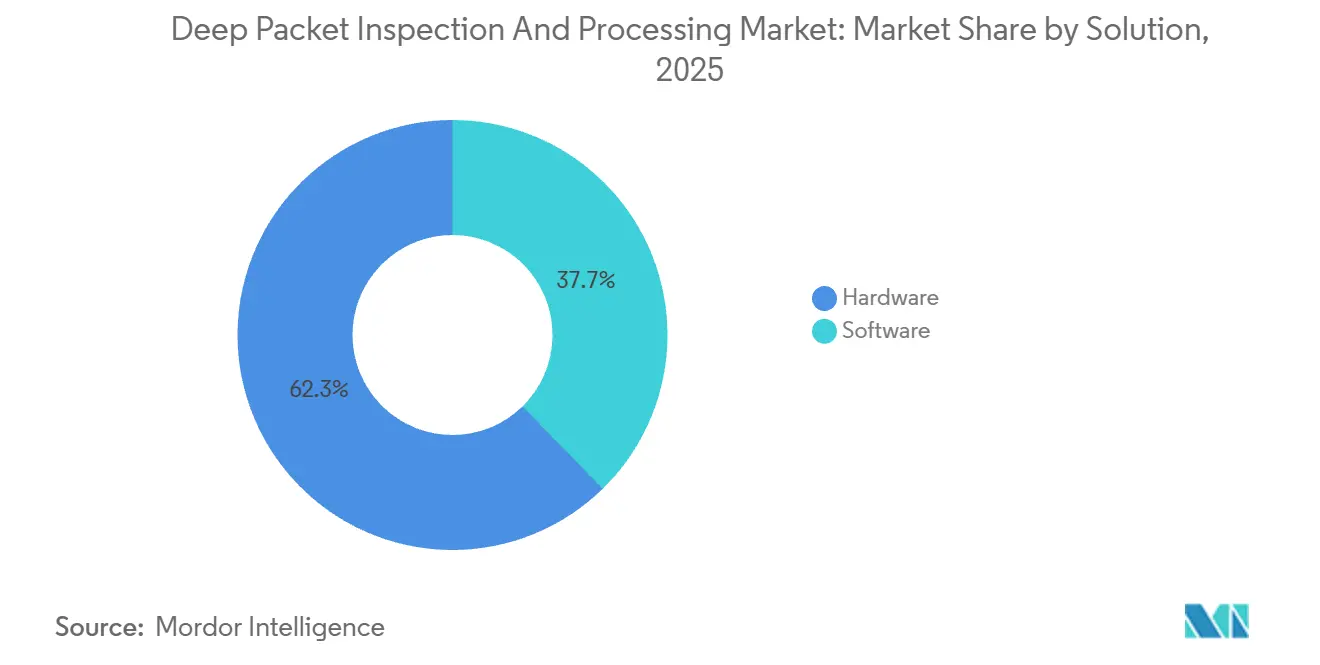
- By solution, hardware led with 62.32% of the deep packet inspection market share in 2025, while software is poised to expand at an 18.41% CAGR through 2031.
- By deployment mode, on-premise implementations accounted for 71.51% of 2025 revenue, whereas cloud and software-as-a-service models are forecast to grow at 17.23% CAGR.
- By application, traffic management and quality of service commanded 38.43% share in 2025, yet network performance monitoring is advancing at a 17.32% CAGR to 2031.
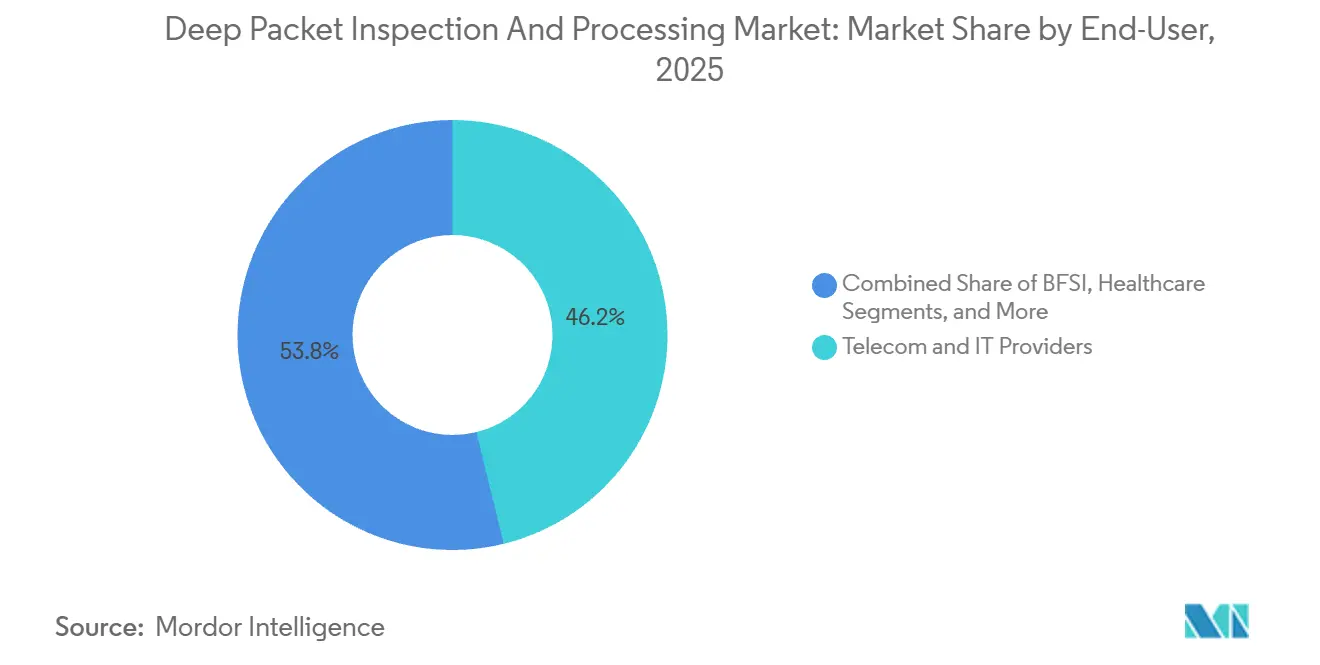
- By end-user, telecom and IT providers dominated with 46.17% share in 2025, while healthcare adoption is accelerating at an 18.31% CAGR as telemedicine scales.
- By organization size, large enterprises held 64.76% of 2025 spending, but small and medium-sized enterprises are set to grow at 15.69% CAGR as managed services mature.
- By geography, North America remained the largest region at 33.26% share in 2025, whereas Asia Pacific is projected to record a 16.19% CAGR on the back of 5G rollouts.
Note: Market size and forecast figures in this report are generated using Mordor Intelligence’s proprietary estimation framework, updated with the latest available data and insights as of January 2026.
Global Deep Packet Inspection And Processing Market Trends and Insights
Drivers Impact Analysis*
| Driver | (~) % Impact on CAGR Forecast | Geographic Relevance | Impact Timeline |
|---|---|---|---|
| Surge in Encrypted Traffic Visibility Tools | +3.2% | Global, concentrated in North America and Europe | Medium term (2-4 years) |
| 5G Network Slicing Driving Policy-Aware DPI | +2.8% | Asia Pacific core, spill-over to Middle East and South America | Long term (≥ 4 years) |
| Mandatory Data-Retention and Lawful-Intercept Laws | +2.1% | Europe, Middle East, India and Australia | Short term (≤ 2 years) |
| AI-Powered Traffic Analytics for Zero-Trust Security | +2.6% | North America and Europe, early adoption in Asia Pacific financial hubs | Medium term (2-4 years) |
| Edge and IoT Micro-Segmentation Requirements | +1.9% | Global, early gains in manufacturing regions such as Germany and Japan | Long term (≥ 4 years) |
| Integration of DPI with SASE Platforms | +2.5% | North America and Europe, expanding to Asia Pacific and Middle East | Medium term (2-4 years) |
| Source: Mordor Intelligence | |||
Surge in Encrypted Traffic Visibility Tools
TLS 1.3 removed the certificate exchange that legacy engines parsed for application fingerprinting, prompting vendors to ship analytics that exploit cipher-suite patterns, certificate lifetimes, and handshake timing instead of payload decryption. Cisco’s Encrypted Traffic Analytics and ipoque’s Encrypted Traffic Intelligence now classify more than 4,000 applications with 95% accuracy, allowing banks to uncover data-exfiltration attempts inside fully encrypted sessions. The U.S. National Institute of Standards and Technology endorsed this approach in its 2024 guidelines, balancing monitoring needs with privacy preservation. Enterprises adopting these tools in 2025 shortened mean-time-to-detect advanced threats by 34%, freeing analyst hours for remediation work.
5G Network Slicing Driving Policy-Aware DPI
Standalone 5G cores disaggregate control and user planes, enabling operators to sell dedicated slices for autonomous driving, industrial automation, and augmented reality.[1] Internet Engineering Task Force, “TLS 1.3 and Encrypted Client Hello,” ietf.org Each slice carries its own latency and reliability envelope, so packets must be inspected inline to enforce service-level thresholds that can fall below 1 millisecond for ultra-reliable low-latency communications. Nokia’s MX Industrial Edge embeds DPI inside the user-plane function, cutting processing latency by 40% versus legacy service-chaining. Japanese and South Korean operators that implemented policy-aware DPI in 2025 monetized premium slices at USD 1.8-2.3 per subscriber per month, offsetting heavy spectrum outlays.
AI-Powered Traffic Analytics for Zero-Trust Security
Zero-trust frameworks generate tens of terabytes of inspection traffic daily in mid-sized enterprises, overwhelming human analysts. Fortinet’s FortiAI and Palo Alto Networks’ Precision AI solutions baseline normal traffic and surface anomalies, trimming false positives by 60% and cutting incident-response costs by 28% during 2025 pilot programs. The technology aligns with NIST’s Zero Trust Architecture model, which positions DPI as the enforcement point where policy decisions translate into forwarding actions. Financial institutions that adopted AI-driven DPI reported faster containment of lateral movement, preventing several seven-figure breach payouts.
Integration of DPI with SASE Platforms
Secure access service edge converges firewall, secure web gateway, and zero-trust network access into a single cloud service, with DPI furnishing the classification engine that feeds every module. Zscaler’s cloud nodes process more than 300 billion transactions daily, inspecting encrypted traffic for data-loss patterns and command-and-control activity in sub-10-millisecond paths. Cloudflare’s Magic WAN applies similar logic across a 310-city anycast network, letting global enterprises enforce unified policy without backhauling traffic. Customers shifting to SASE collapsed multiple point products, trimming wide-area-network expenses by up to 45% in 2025.
Restraints Impact Analysis*
| Restraint | (~) % Impact on CAGR Forecast | Geographic Relevance | Impact Timeline |
|---|---|---|---|
| Privacy Backlash and DPI Transparency Mandates | -1.8% | Europe, expanding to North America and selected Asia Pacific markets | Short term (≤ 2 years) |
| Increasing TLS 1.3 / QUIC Adoption Limits Payload View | -2.3% | Global, acute in consumer-internet and cloud-native environments | Medium term (2-4 years) |
| High Capex for Tera-Scale Inline Inspection | -1.4% | Telecom operators in South America, Africa and Southeast Asia | Long term (≥ 4 years) |
| Evasive Techniques Reduce DPI Efficacy | -1.6% | Global, strongest in restrictive-policy regions | Medium term (2-4 years) |
| Source: Mordor Intelligence | |||
Privacy Backlash and DPI Transparency Mandates
Article 5 of the General Data Protection Regulation requires transparent handling of personal data, yet DPI inevitably processes payloads that may hold identifiers such as email addresses and location metadata.[2]European Union, “General Data Protection Regulation Article 5,” europa.eu Civil-liberties groups filed complaints in 2025 against three European operators, asserting unlawful profiling through DPI-derived analytics. The European Data Protection Board responded with guidance that obliges operators to publish data-processing impact assessments detailing inspected fields and retention periods, a disclosure burden that legal teams estimate will cost USD 2-4 million per carrier. California’s Consumer Privacy Act amendments carried similar obligations in 2024, forcing U.S. providers to embed consent workflows into inspection platforms. Operators failing to demonstrate lawful basis faced average penalties of USD 1.2 million per incident in 2025, nudging some toward less intrusive analytics models.
Increasing TLS 1.3 / QUIC Adoption Limits Payload View
Google Chrome pushed QUIC share to 42% of browser traffic by mid-2025, encrypting transport-layer metadata that DPI engines once parsed to infer application intent. TLS 1.3, coupled with encrypted client hello, hides the destination hostname until after the handshake, hampering domain-based filtering. Heuristic classifiers that rely on packet size and timing maintain only 82% accuracy on encrypted QUIC flows versus 97% on legacy HTTP, according to ipoque benchmarks published in 2025. Telecom operators in restrictive jurisdictions reported a 23% drop in content-filtering efficacy between 2024 and 2025, undercutting analytics revenue streams tied to subscriber behavior. Vendors are racing to regain visibility through machine-learning fingerprinting, but the window of full-packet transparency has closed for good.
*Our forecasts treat driver/restraint impacts as directional, not additive. The impact forecasts reflect baseline growth, mix effects, and variable interactions.
Segment Analysis
By Solution: Software Adoption Accelerates as Virtualization Reshapes Inspection
Hardware platforms retained a 62.32% share of the deep packet inspection market in 2025 because telecom operators refreshed appliance fleets with 400-gigabit products that keep encrypted traffic at line rate.[3] Cisco’s Catalyst 9000 switches and Juniper’s MX routers integrate acceleration blocks, eliminating the need for external taps. In parallel, software solutions are projected to grow at an 18.41% CAGR through 2031 as cloud-native deployments spin up containerized inspection instances on commodity servers. Enterprises running Fortinet’s FortiGate virtual machines autoscale capacity during e-commerce peaks, paying only for the compute they consume. This pivot mirrors the broader network-function-virtualization wave that slashed operator capex by 28% in European trials completed during 2025.
Hybrid topologies are taking hold. Banks anchor their data-center perimeters with 100 Gbps hardware appliances, while lightweight agents monitor east-west traffic inside Kubernetes clusters, feeding orchestration engines such as Terraform for instant policy rollouts. Open-source libraries like nDPI and libprotoident gained traction among managed-service providers crafting differentiated analytics layers, eroding the defensive moat that once came from proprietary parsing alone. As basic inspection commoditizes, vendors differentiate on threat-intel feeds and machine-learning precision, setting the stage for convergence with security analytics platforms.


By Deployment Mode: Cloud Models Gain Despite Latency Concerns
On-premise systems accounted for 71.51% of 2025 revenue, a figure shaped by banking and government rules that forbid routing sensitive flows through third-party clouds. The Payment Card Industry Data Security Standard compels card processors to keep inspection inside PCI-compliant facilities, locking them into appliance refresh cycles. Conversely, cloud and software-as-a-service adoption is forecast at a 17.23% CAGR as mid-market firms opt for subscription pricing that starts near USD 15 per user per year, far below the six-figure capital outlays for hardware.
Latency remains the stumbling block. Backhauling branch traffic to regional scrubbing hubs can add 8-15 milliseconds, enough to degrade VoIP or disrupt algorithmic trading. Vendors responded by dropping micro-data centers at internet-exchange points across 310 cities, keeping 95% of users within 50 milliseconds of inspection nodes. A split-tunnel compromise has emerged; enterprises keep sensitive workloads on-prem while sending web traffic to cloud inspection, giving rise to hybrid designs now adopted by 62% of Palo Alto Networks’ SASE customers.
By Application: Performance Monitoring Surges Amid Microservice Complexity
Traffic management retained 38.43% share in 2025 as carriers enforce service-level agreements for enterprise broadband and prioritize streaming packets during primetime. Yet network performance monitoring is on track for a 17.32% CAGR through 2031 because site-reliability engineers instrument every microservice boundary to spot latency spikes in real time. NETSCOUT’s nGeniusONE blends flow records with application telemetry, pinpointing whether a slow checkout page stems from congested links or a brittle database shard. Intrusion detection remains critical for stopping ransomware and insider threats, with Fortinet’s sandboxing blocking zero-day exploits before payloads hit production networks.
Lawful intercept and data retention may be smaller niches, but they carry premium margins. European and Middle Eastern operators spent USD 3.2 billion in 2025 on platforms that export records in ETSI-compliant formats, a capability still limited to a handful of vendors such as Utimaco and Verint. Compliance timelines make these contracts sticky, often spanning 5-7 years, insulating suppliers from commodity price pressure.
By End-User: Healthcare Emerges as the Fastest-Growing Vertical
Telecom and IT providers produced 46.17% of 2025 revenue as 5G standalone cores embed DPI into user-plane functions for real-time policy enforcement. Verizon and AT&T together invested more than USD 1 billion to upgrade cores capable of inspecting encrypted QUIC flows at terabit scale. Healthcare spending is forecast to rise at an 18.31% CAGR to 2031 as telemedicine scales and hospitals enforce HIPAA-compliant controls on video consultations and electronic health records. Early adopters cut breach incidents by 41% in 2025 because DPI blocks unauthorized uploads of patient data to consumer cloud drives.
Financial institutions leverage DPI for fraud analytics, inspecting SWIFT messages for anomalous transfers and flagging employee exfiltration attempts. Retailers optimize content-delivery costs by classifying flows, routing high-margin product pages over premium links and software updates over bargain peering paths. Government agencies remain steady buyers but are hampered by lengthy procurement cycles that stretch refresh intervals to six years or more.

By Organization Size: Managed Services Bring SMEs into the Fold
Large enterprises held 64.76% of 2025 spending because they run dedicated security-operations centers that tune policies and integrate flow data with SIEM platforms. Small and medium-sized enterprises are projected to grow at 15.69% CAGR as managed-security-service providers bundle DPI with extended detection and response for USD 8,000-10,000 annually. Arctic Wolf and Secureworks aggregate thousands of tenants, dropping per-seat inspection costs to USD 12 monthly and satisfying cyber-insurance mandates that require continuous monitoring.
Ransomware pressure is the catalyst. Attackers increasingly target mid-market firms with limited staff yet sufficient cash flow to pay six-figure ransoms, so insurers reward DPI adoption with premium discounts averaging 20%. As underwriters bake continuous packet visibility into coverage, SMEs become an obligatory, not optional, addressable segment for vendors.
Geography Analysis
North America retained 33.26% share of 2025 spending in the deep packet inspection market, buoyed by hyperscale cloud builders and Wall Street institutions that demand sub-millisecond telemetry to protect algorithmic trades. Robust fiber backbones and dense IXPs minimize latency penalties, allowing operators to run terabit inline inspection without degrading user experience. Federal guidance published in 2024 compels firms to detect breaches within 30 days, anchoring zero-trust rollouts that rely on continuous packet visibility. Nonetheless, state-level privacy laws such as California’s CCPA add USD 1.8-2.4 million in compliance costs per operator, nudging some workloads toward less granular analytics models.
Asia Pacific is forecast to log a 16.19% CAGR, the fastest among major regions, as India’s carriers invest USD 19 billion in 5G spectrum and deploy standalone cores with inline DPI for slice monetization. China’s Cybersecurity Law obliges domestic data storage and 24-hour law-enforcement access, generating USD 2.1 billion in 2025 DPI procurement for national carriers. Japan’s Ministry of Internal Affairs and Communications published technical standards in 2025 that link DPI to slice quality-of-service identifiers, enabling carriers to charge premium fees for ultra-reliable services. South Korea’s operators layered AI over DPI to slash distributed-denial-of-service outage minutes by 38% in 2025, proving the business case for machine-learning inspection at scale.
Europe balances strong demand with stringent compliance. GDPR transparency mandates clash with the EU Data Retention Directive, forcing operators to anonymize subscriber IDs in exported records, an engineering overhaul that cost north of USD 15 million per tier-one carrier in 2025. Meanwhile, Middle Eastern regulators in Saudi Arabia and the UAE require lawful intercept by design, keeping contract pipelines open for niche vendors that can certify ETSI compliance. South America and Africa trail in both capital budgets and broadband penetration, yet Brazil’s draft 5G security rules and South Africa’s spectrum licenses include inspection clauses that signal latent demand for 2027-2030 deployments.

Competitive Landscape
The top five suppliers - Cisco, Palo Alto Networks, Fortinet, Nokia, and Huawei - controlled roughly 48% of 2025 revenue, leaving more than 30 specialists to jostle for niches such as subscriber analytics and encrypted-traffic fingerprinting. Incumbents gain lock-in by bundling DPI, firewalls, and secure web gateways under integrated licensing, raising customer switching costs. Cisco’s USD 28 billion acquisition of Splunk in 2024 typifies the trend of marrying network visibility with security analytics, giving clients a single console for flows, endpoints, and threat intel.
Edge computing opens white space for newcomers. Start-ups such as Netify slip lightweight inspection engines into industrial gateways and autonomous-vehicle controllers, markets where traditional IT vendors lack domain credibility. Differentiation is drifting from raw throughput to machine-learning precision; Fortinet trains models on 500 million daily events, while Palo Alto Networks claims a 60% false-positive reduction through Precision AI. Patent filings underscore strategic priorities. Cisco submitted 14 patents on QUIC classification, whereas Huawei logged 22 on AI-driven traffic prediction for 5G slices.
Standards compliance remains a moat. ISO/IEC 27001 and ETSI lawful-intercept certifications gate-keep eligibility for government and telco tenders, winnowing the vendor field to organizations that can finance lengthy audits. As encryption erodes payload visibility, vendors that fuse flow records with external telemetry - endpoint, identity, and cloud control-plane logs - will capture share by providing the context needed for closed-loop automation.
Deep Packet Inspection And Processing Industry Leaders
Cisco Systems, Inc.
Nokia Corporation
Huawei Technologies Co., Ltd.
Allot Ltd.
Enea AB
- *Disclaimer: Major Players sorted in no particular order

Recent Industry Developments
- October 2025: Palo Alto Networks expanded Prisma SASE with AI-powered DPI that identifies encrypted QUIC traffic at 100 Gbps while holding latency under 10 ms. Early banking adopters cut false alarms by 34%.
- September 2025: Fortinet debuted FortiGate 4800F, a firewall appliance delivering 2.4 Tbps of inline inspection and bundled threat intelligence.
- July 2025: Nokia earmarked USD 120 million to scale MX Industrial Edge production in Finland, meeting demand from manufacturers deploying private 5G with embedded DPI.
- June 2025: Cisco integrated Encrypted Traffic Analytics into Hypershield, allowing micro-segmentation rules to adapt in real time based on cipher-suite telemetry.


Research Methodology Framework and Report Scope
Market Definitions and Key Coverage
Our study defines the deep packet inspection and processing market as the revenue generated from hardware appliances and software engines that inspect, classify, and, where permitted, act on Layer 2-7 packet content in real time across fixed and mobile networks. The sizing covers commercial deployments sold to telecom operators, cloud and data-center providers, enterprises, and public-sector bodies; aftermarket service revenues are excluded.
Scope exclusion: Consumer-grade endpoint firewalls and purely statistical flow-monitoring tools (NetFlow/IPFIX only) are not counted.
Segmentation Overview
- By Solution
- Hardware
- Software
- By Deployment Mode
- On-Premise
- Cloud / SaaS
- By Application
- Traffic Management and QoS
- Intrusion Detection / Prevention
- Data Retention and Lawful Interception
- Network Performance Monitoring
- By End-User
- Telecom and IT Providers
- BFSI
- Healthcare
- Retail and eCommerce
- Government and Public Safety
- By Organization Size
- Large Enterprises (?1,000 Employees)
- SMEs
- By Geography
- North America
- United States
- Canada
- Mexico
- Europe
- Germany
- United Kingdom
- France
- Italy
- Spain
- Russia
- Rest of Europe
- Asia Pacific
- China
- Japan
- India
- South Korea
- ASEAN
- Australia and New Zealand
- Rest of Asia Pacific
- South America
- Brazil
- Argentina
- Rest of South America
- Middle East
- Saudi Arabia
- UAE
- Turkey
- Rest of Middle East
- Africa
- South Africa
- Nigeria
- Rest of Africa
- North America
Detailed Research Methodology and Data Validation
Primary Research
We interview network-equipment engineers, threat-hunting leads, and procurement heads across North America, Europe, Asia-Pacific, and the Gulf. Their comments on average selling prices, feature uptake (TLS decryption, 5G UPF integration), and budget triggers let us stress-test secondary findings and close data gaps before final triangulation.
Desk Research
Mordor analysts first canvas open datasets such as ITU broadband statistics, GSMA Intelligence mobile-data volumes, FCC network-outage filings, and ENISA threat bulletins, which frame traffic growth and security incidents. Company 10-Ks and investor decks show vendor shipment trends, while patent abstracts from Questel hint at emerging inspection techniques. Select paywalled platforms, D&B Hoovers for supplier financials and Dow Jones Factiva for deal news, help validate addressable revenue pools. The sources cited are illustrative; many additional references underpin our desk analysis.
Market-Sizing & Forecasting
A top-down reconstruction begins with regional IP-traffic forecasts and subscriber counts, which are then multiplied by modeled inspection penetration rates and blended ASPs. Supplier roll-ups from sampled R&D-driven vendors act as a bottom-up sense-check. Key variables include average encrypted-traffic share, 5G core roll-out pace, regulatory mandates for lawful intercept, security breach frequency, and cloud migration ratios. Multivariate regression with lagged traffic and breach indicators projects demand to 2030, and scenario analysis adjusts for regulation tightening or budget freezes.
Data Validation & Update Cycle
Outputs pass an anomaly screen, peer review, and senior analyst sign-off. We refresh every twelve months, re-opening models sooner if major spectrum auctions, headline cyberattacks, or material vendor mergers alter demand signals.
Why Mordor's Deep Packet Inspection & Processing Baseline Stands Up to Scrutiny
Published estimates vary because firms pick unequal scopes, years, and penetration assumptions.
Our disciplined scope alignment, annual refresh cadence, and dual-track modeling curb these drifts.
Benchmark comparison
| Market Size | Anonymized source | Primary gap driver |
|---|---|---|
| USD 35.89 B (2025) | Mordor Intelligence | - |
| USD 38.30 B (2025) | Global Consultancy A | includes managed-security service fees and consumer endpoint licenses |
| USD 32.22 B (2024) | Trade Journal B | earlier base year and currency fixed at 2023 averages |
| USD 33.65 B (2025) | Industry Association C | assumes uniform 25% TLS-decryption premium worldwide |
The comparison shows that once divergent scopes, timing, and price uplifts are stripped out, Mordor's balanced bottom-up cross-check coupled with a transparent top-down core delivers the most dependable baseline for executives planning DPI investments.


Key Questions Answered in the Report
How large is the deep packet inspection market in 2026?
The deep packet inspection market size stands at USD 41.42 billion in 2026.
What CAGR is expected for deep packet inspection solutions through 2031?
Revenue is forecast to expand at a 15.13% CAGR to reach USD 83.77 billion by 2031.
Which solution type is growing fastest?
Software-based DPI is projected to rise at an 18.41% CAGR as virtualization spreads.
Why is Asia Pacific the fastest-growing region for DPI?
Massive 5G investments and cybersecurity mandates in India, China, Japan and South Korea drive a 16.19% CAGR.
How are privacy regulations affecting DPI adoption?
GDPR and CCPA transparency rules add compliance costs that trim market CAGR by an estimated 1.8%.
What differentiates leading DPI vendors today?
Accuracy of AI-driven detection, integration with threat intelligence and compliance certifications such as ISO/IEC 27001 are the primary differentiators.
Page last updated on:


