
Data Center Rack Power Distribution Unit (PDU) Market Size and Share
Market Overview
| Study Period | 2020 - 2031 |
|---|---|
| Market Size (2026) | USD 3.01 Billion |
| Market Size (2031) | USD 4.62 Billion |
| Growth Rate (2026 - 2031) | 8.96 % |
| Fastest Growing Market | Asia Pacific |
| Largest Market | Asia Pacific |
| Market Concentration | Medium |
Major Players *Disclaimer: Major Players sorted in no particular order Image © Mordor Intelligence. Reuse requires attribution under CC BY 4.0. | |
Data Center Rack Power Distribution Unit (PDU) Market Analysis by Mordor Intelligence
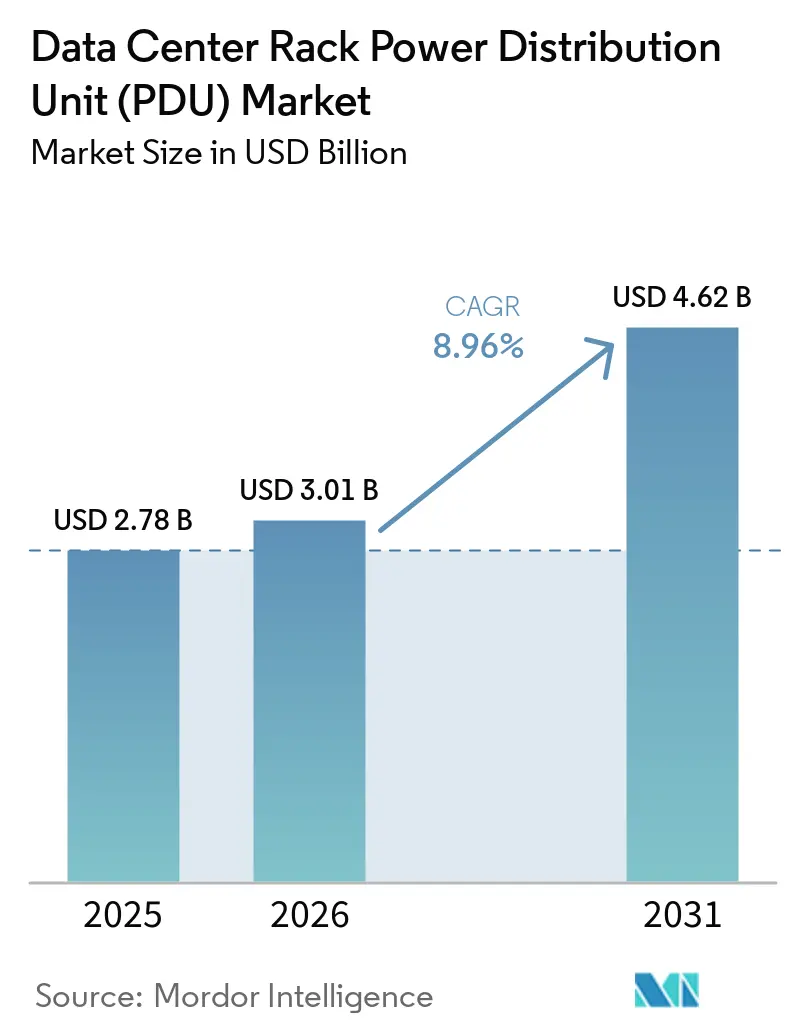
The data center rack power distribution unit (PDU) market size is expected to increase from USD 2.78 billion in 2025 to USD 3.01 billion in 2026 and reach USD 4.62 billion by 2031, growing at a CAGR of 8.96% over 2026-2031. Momentum stems from hyperscale expansion, high-density AI workloads, and liquid-cooling adoption, all of which demand redesigned power delivery at the rack level. Growing electricity expense, now equal to 40-50% of total site operating cost, keeps power-usage effectiveness (PUE) in sharp focus and accelerates the shift toward intelligent units that enable real-time insight and remote control. Vendors are extending firmware capabilities to embed machine-learning models that predict breaker trips and guide dynamic load shedding, thereby turning PDUs into active grid participants rather than passive distribution strips. The competitive field shows moderate consolidation because the top five suppliers account for 55-60% of global revenue, yet niche entrants win share in segments below 10 kW where price sensitivity remains acute. Liquid-cooling convergence, retrofit demand in legacy sites, and sovereign-cloud mandates together create incremental volume, positioning the data center rack power distribution unit market for durable mid-single-digit growth beyond the forecast horizon.
Key Report Takeaways
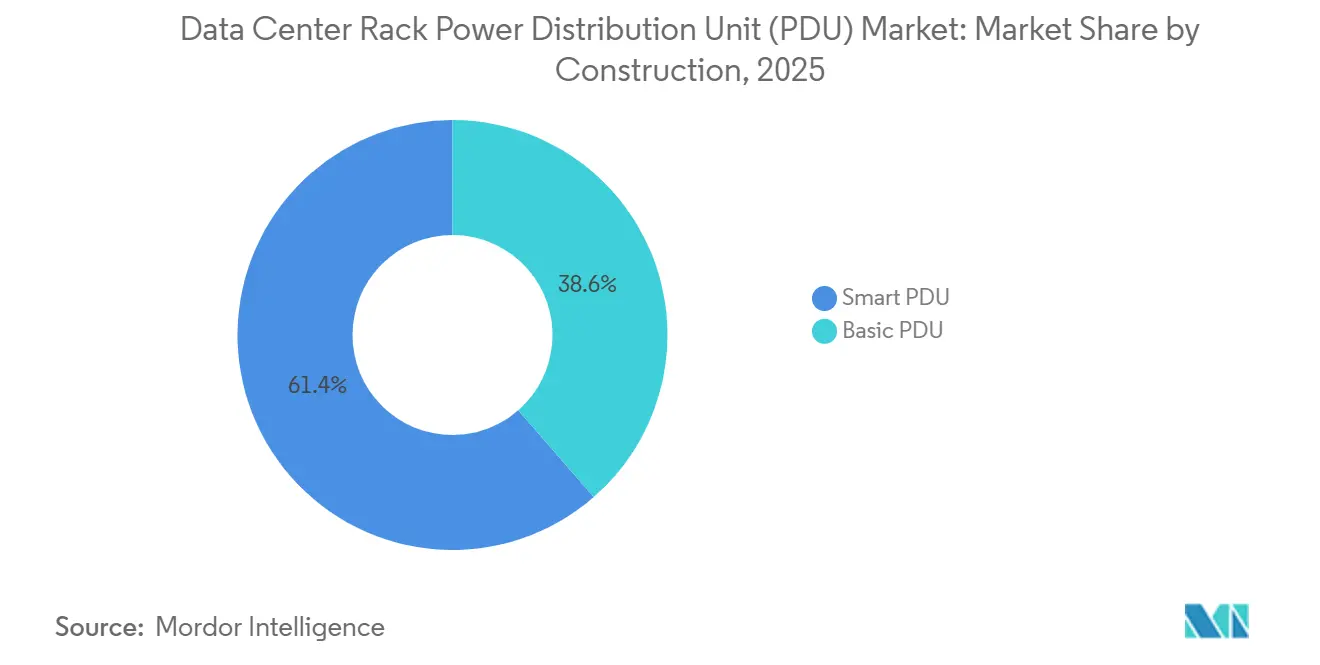
- By construction, smart PDUs led with 61.42% revenue share in 2025; basic PDUs are forecast to trail as the smart segment advances at a 9.43% CAGR to 2031.
- By phase, three-phase equipment accounted for 58.32% of the data center rack power distribution unit market share in 2025 and is projected to post a 9.26% CAGR to 2031.
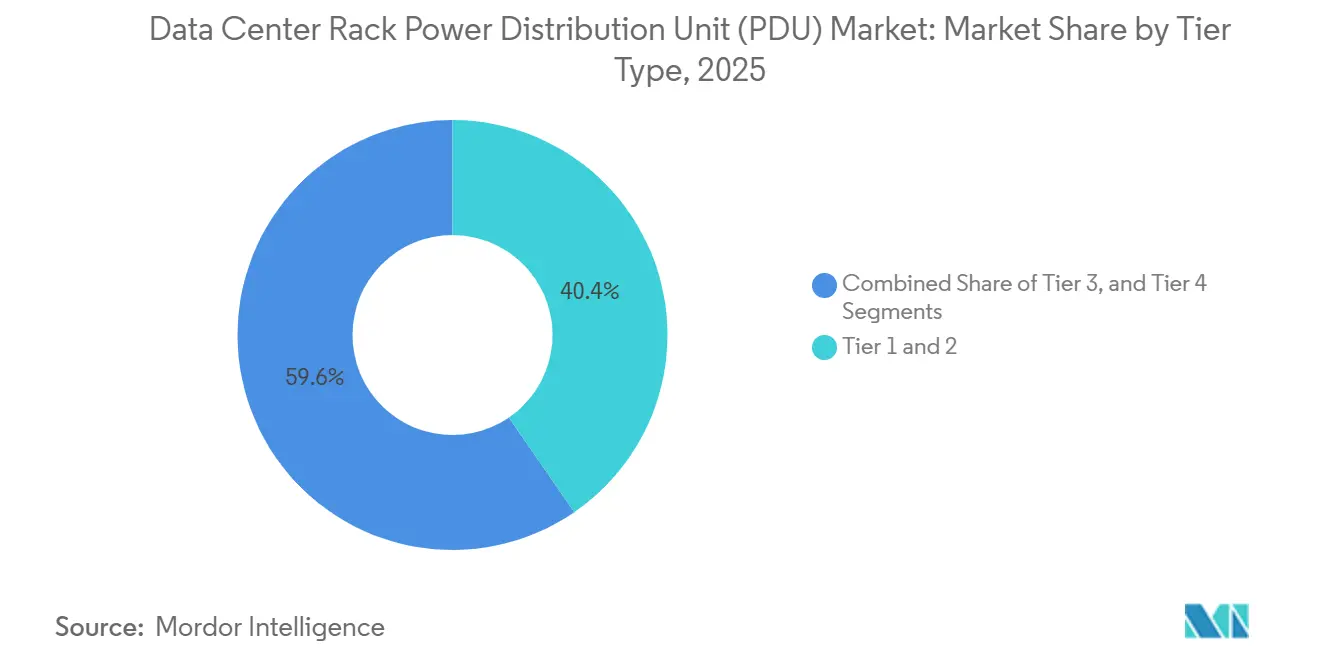
- By tier type, tier 3 facilities recorded the strongest outlook and are poised for a 9.76% CAGR through 2031, while tier 1-2 sites jointly accounted for 40.42% of the share in 2025.
- By data-center size, hyperscale campuses are on track for a 9.12% CAGR to 2031, whereas large data center accounted for 42.24% of the market share in 2025.
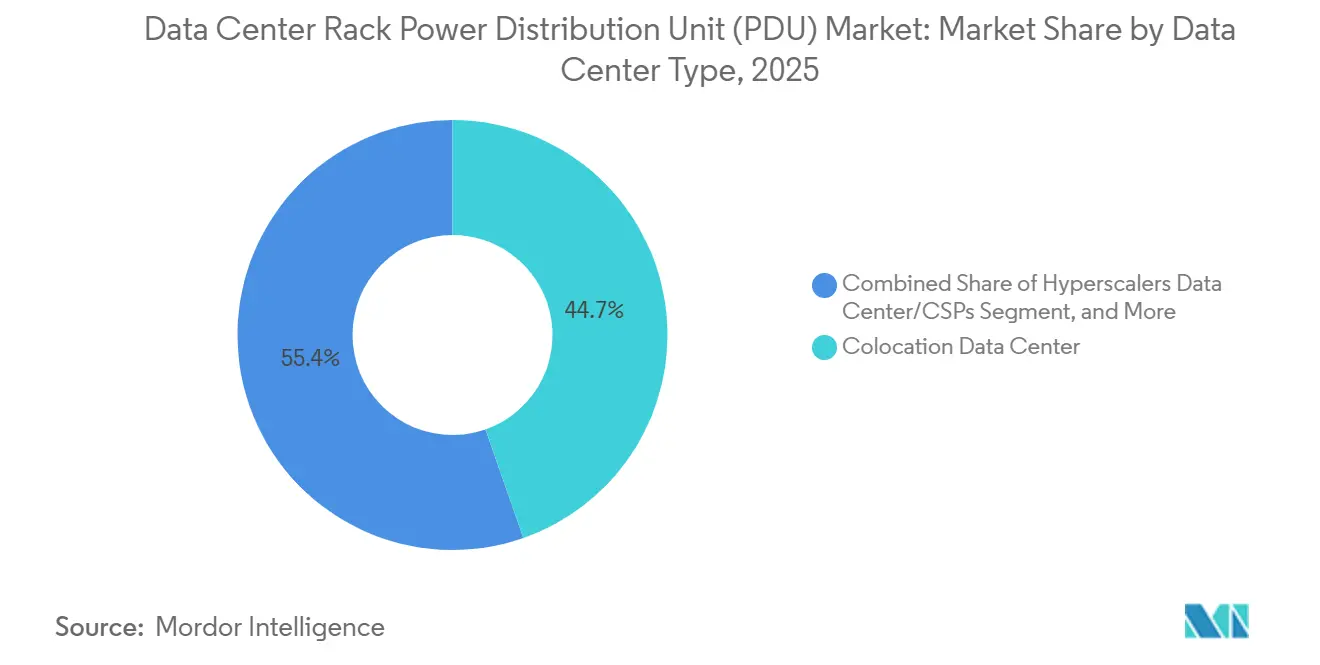
- By data-center type, colocation operators held 44.65% of the share in 2025; enterprise and edge environments are projected to expand at a 10.32% CAGR through 2031.
- By rack density, the above-20 kW segment is forecast to climb at a 10.04% CAGR to 2031, outpacing the 10-20 kW segment that maintained 48.43% share in 2025.
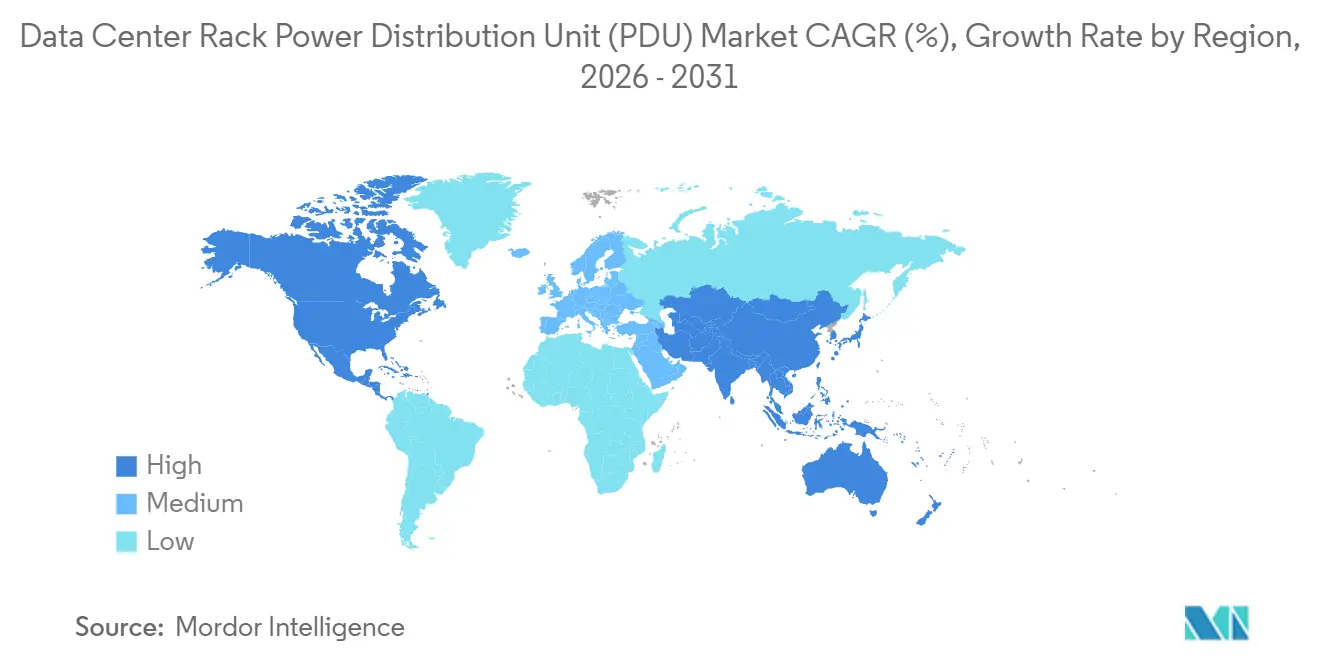
- By geography, Asia-Pacific commanded 40.13% revenue in 2025 and is anticipated to log a 10.14% CAGR through 2031, widening its lead over North America and Europe.
Note: Market size and forecast figures in this report are generated using Mordor Intelligence’s proprietary estimation framework, updated with the latest available data and insights as of January 2026.
Global Data Center Rack Power Distribution Unit (PDU) Market Trends and Insights
Drivers Impact Analysis*
| Driver | (~) % Impact on CAGR Forecast | Geographic Relevance | Impact Timeline |
|---|---|---|---|
| Investments in Hyperscale Data Centers | +2.4% | Global, notably North America, Asia-Pacific, Middle East | Medium term (2-4 years) |
| AI-Driven Energy Management Integration | +1.8% | North America and Europe, spillover to Asia-Pacific Tier 1 cities | Short term (≤ 2 years) |
| High-Density Compute Accelerator Adoption | +2.1% | Global, early use in North America hyperscale sites and Asia-Pacific manufacturing edges | Medium term (2-4 years) |
| Shift to Liquid Cooling with Hybrid CDU-PDU | +1.6% | North America and Europe, pilot Asia-Pacific | Long term (≥ 4 years) |
| Power-Availability Mandates and Software-Defined Data Centers | +1.2% | Global, strongest in Europe and North America | Medium term (2-4 years) |
| Rising Edge-Data-Center Deployment | +1.5% | Asia-Pacific, North America, Middle East | Short term (≤ 2 years) |
| Source: Mordor Intelligence | |||


Investments in Hyperscale Data Centers Continuing to Spur Demand for Smart PDU Installations
Hyperscale operators have accelerated capital plans, with single-campus builds now topping 1 GW. Each site deploys thousands of intelligent PDUs that stream high-resolution telemetry into cloud analytics platforms, letting operators balance phase load, enforce green-energy scheduling, and monetize power data within usage-based billing models. Price premiums on three-phase outlet-level switching hardware average 40-60% over basic units, yet total cost of ownership falls as remote firmware updates eliminate technician truck rolls. Adoption permeates established clusters in Virginia, Tokyo, and Frankfurt, and is spreading to Abu Dhabi and Kuala Lumpur, where sovereign-cloud rules require in-country infrastructure.[1]Amazon Web Services, “Global Infrastructure,” AWS.AMAZON.COM
Integration of AI-Driven Energy Management for Rack-Level Distribution
Edge AI chips embedded inside next-generation PDUs process voltage, harmonic, and thermal readings locally, issuing commands in microseconds to curtail non-critical loads or route power to healthier phases. This closes the loop between compute orchestration and electrical distribution, allowing container platforms to incorporate energy as a real-time scheduling constraint. Colocation providers capitalize on sub-rack metering within ±1% accuracy, enabling transparent tenant billing and supporting greener portfolio financing.
Increasing Adoption of High-Density Compute Accelerators Demanding Advanced PDUs
AI training servers featuring eight NVIDIA H100 or H200 GPUs routinely draw 10-12 kW each. Racks now exceed 80 kW, a demand that legacy single-phase strips cannot satisfy. Modern PDUs deliver 60-amp, 415-V three-phase feeds through C39 outlets, include arc-fault protection, and integrate busbar connectors that minimize IR losses. Capacity growth locks in recurring replacement cycles because older facilities refit strips every three years instead of the historical five-year cadence.
Shift to Liquid Cooling Requiring PDU Redesign for Hybrid Power and Cooling Delivery
As direct-to-chip and immersion systems proliferate, vendors fuse coolant manifolds with power modules in compact 6U chassis. Built-in leak detectors and flow sensors inform machine-learning dashboards that orchestrate both thermal and electrical loads. Safety certification to IEC 61439 becomes pivotal because coolant and high-current conductors coexist in tight envelopes. Early adopters cite 30% higher compute density per square meter and shorter deployment timelines because integrated units ship pre-tested.[2]Vertiv, “Geist rPDU with Xerus Technology,” VERTIV.COM
Restraints Impact Analysis*
| Restraint | (~) % Impact on CAGR Forecast | Geographic Relevance | Impact Timeline |
|---|---|---|---|
| Rising Rack-Power Densities Exceeding Legacy Floor Ratings | -1.4% | Global, acute in North America and Europe retrofits | Short term (≤ 2 years) |
| Cybersecurity Concerns Around Networked PDUs | -1.1% | Global, heightened in finance and government | Medium term (2-4 years) |
| Faster Refresh Lifecycle than Profitable Facility Life Expectancy | -0.8% | Global, especially enterprise and colocation | Long term (≥ 4 years) |
| Semiconductor-Component Supply Volatility | -0.9% | Global, most severe in Asia-Pacific manufacturing hubs | Short term (≤ 2 years) |
| Source: Mordor Intelligence | |||
Rising Rack Power Densities Exceeding Legacy Data Center Floor Ratings
Facilities built before 2020 feature 5-8 kW design envelopes and floor loading below 200 W per square foot; they now confront 20-30 kW demands that require structural reinforcement, busway replacement, and utility transformer upgrades. Retrofit budgets often reach USD 500-800 per square foot, extend over 6-12 months, and interrupt revenue-generating operations. Operators in land-constrained metros such as Singapore and London weigh the cost of upgrades against edge or greenfield deployment, delaying PDU revamps and suppressing overall unit volume.[3]Uptime Institute, “Global Data Center Survey 2024,” UPTIMEINSTITUTE.COM
Cybersecurity Concerns Around Networked PDUs
Ethernet-connected PDUs introduce additional attack surfaces. Recent vulnerability disclosures revealed hard-coded credentials and unencrypted SNMP channels that could allow malicious power cycling or data exfiltration. Compliance bodies now mandate encryption, segmentation, and multifactor authentication, but some financial and public-sector entities disable remote management functions, eroding the energy-optimization value proposition. Vendors must harden firmware, adopt signed updates, and integrate zero-trust frameworks to restore buyer confidence.[4]Cybersecurity and Infrastructure Security Agency, “PDU Firmware Vulnerabilities Analysis 2024,” CISA.GOV
*Our forecasts treat driver/restraint impacts as directional, not additive. The impact forecasts reflect baseline growth, mix effects, and variable interactions.
Segment Analysis
By Construction: Smart PDUs Capture a Premium as Operators Monetize Energy Data
Smart units already command 61.42% market share in 2025, and their higher average selling price continues to lift the intelligent PDU market as operators prioritize granular energy monitoring and remote power management. Intelligent strips enable granular kilowatt-hour tracking, outlet-level switching, and predictive maintenance, capabilities that underpin usage-based colocation pricing and hybrid-cloud orchestration. Service providers report revenue-per-cabinet gains of 12-18% after enabling sub-rack billing. Basic PDUs forecast to advance at a 9.43% CAGR to 2031, viable in low-density and cost-sensitive sites, yet their share erodes as cloud-hosted management portals reduce the total cost of ownership for smart options. Over the forecast horizon, smart units accrue incremental share each year as firmware subscription models make them financially attractive even for small enterprises.
PDUs now integrate with orchestration tools such as VMware vRealize and Red Hat Ansible, creating a feedback loop between IT workloads and electrical capacity. By controlling server spin-up based on real-time power data, operators lower stranded capacity and defer transformer upgrades, a major incentive when utility lead times stretch to 18-24 months. The convergence of AI analytics, secure connectivity, and regulatory push toward PUE transparency further locks in the smart trajectory, ensuring that the data center rack power distribution unit (PDU) market retains this premium profile.

By Phase: Three-Phase Dominance Reflects High-Density Compute Proliferation
In 2025, three-phase equipment held a 58.32% share of the data center rack power distribution unit market and is set to achieve a 9.26% CAGR through 2031. Three-phase architectures satisfy modern rack power needs by distributing load across multiple conductors and elevating the supply voltage to 415 V or 480 V, which halves resistive losses relative to single-phase 208 V. Hyperscale clouds standardized on this topology in 2025 to achieve densities beyond 15 kW and maintain headroom for future liquid-cooled AI servers. Incentive programs in California, New York, and Germany further accelerate transition by rewarding sites that meet sub-1.2 PUE thresholds, which typically require three-phase distribution. Consequently, three-phase remains the cornerstone of capacity expansions and greenfield builds, solidifying its majority position in the data center rack power distribution unit (PDU) market.
Single-phase remains relevant at the edge and in small enterprise rooms because electricians may lack three-phase expertise, and local codes sometimes restrict high-voltage feeders. Vendor roadmaps now include single- and three-phase variants within common firmware and management frameworks, helping operators manage mixed estates. Yet as AI adoption pushes even branch offices beyond 10 kW per rack, demand will continue to tilt toward three-phase, inevitably shrinking single-phase share in total shipment terms.
By Tier Type: Tier 3 Facilities Balance Uptime and Capital Efficiency
By 2031, tier 3 facilities are projected to achieve a robust 9.76% CAGR, outpacing tiers 1 and 2, which together accounted for 40.42% of revenue in 2025. Tier 3 has carved out a niche as the optimal blend of cost and resilience, boasting N+1 redundancy that limits annual downtime to just 1.6 hours, an acceptable threshold for most enterprise workloads and SaaS platforms. While adding dual PDUs with automatic transfer switches increases per-rack capital by about USD 1,000, insurers offset this by reducing premiums. Moreover, colocation customers now view tier 3 compliance as a baseline expectation. This balanced value proposition fuels tier 3's impressive 9.76% CAGR. In contrast, tiers 1 and 2, while losing traction for mission-critical applications, continue to serve archival storage, test environments, and content caching. Meanwhile, tier 4 remains a specialized choice, catering primarily to financial settlements, trading, and public safety workloads within the data center rack power distribution unit (PDU) market.
Modular PDU designs that allow hot-swap expansions under load are gaining traction because they help tier 3 operators scale incrementally without full shutdowns. By decoupling capacity-add projects from annual maintenance windows, operators raise cabinet density and revenue per square foot, strengthening the data center rack power distribution unit market size for tier-3-compliant hardware.

By Data Center Size: Hyperscale Expansion Pivots on AI Demand While Large Sites Anchor Installed Base
Large data centers accounted for 42.24% of the data center rack power distribution unit market share in 2025, underscoring the weight of 10-50 MW campuses that host cloud on-ramps, enterprise colocation suites, and regional internet exchanges. Hyperscale campuses, though a smaller absolute slice today, are projected to grow at a 9.12% CAGR to 2031, propelling the data center rack power distribution unit market size upward as operators build 100 MW-plus mega-facilities to serve generative-AI training clusters. These hyperscale builds specify three-phase PDUs rated at 60 A and above, integrate liquid-cooling manifolds, and standardize on 48 V DC busbars that trim power-conversion loss by 8-12%. Procurement contracts now demand 10-year warranties and on-site spares inventories, creating long-tail service revenue for vendors. In contrast, large data centers seek incremental upgrades, swapping legacy single-phase strips for smart three-phase units that enable sub-rack billing and PUE monitoring without wholesale electrical overhaul. This refresh activity sustains unit volume even as new construction tilts toward hyperscale footprints.
Hyperscale operators concentrate orders into multi-year master-service agreements that lock pricing and capacity for up to five sites at once, smoothing demand visibility for manufacturers yet elevating qualification thresholds around cybersecurity and firmware-update cadence. Their preference for open-compute reference designs nudges suppliers to publish API documentation and open-source management plug-ins, accelerating ecosystem convergence. Large facilities, meanwhile, prioritize retrofit flexibility; modular PDUs that can be field-upgraded from 20 kW to 30 kW circuits allow operators to introduce AI racks in specific cages without re-engineering entire power trunks. Collectively, the dual-track evolution means shipment mix shifts toward hyperscale-grade units by value, while large-site renovations preserve steady volume flow, ensuring that both cohorts remain pivotal contributors to the overall data center rack power distribution unit market size through 2031.
By Data Center Type: Colocation Leads, Enterprise Edge Surges
Colocation retains the largest slice of spending at 44.65% because enterprises favor opex-friendly outsourcing and regulators permit third-party hosting of sensitive data under audited controls. Intelligent PDUs underpin dynamic pricing models that tie monthly fees to precise kilowatt-hour consumption, aligning landlord revenue with client usage. Tenant churn drops once transparent metering is in place, reinforcing the momentum for PDU upgrades. Enterprise and edge facilities, often single-room deployments in hospitals, banks, and factories, are growing faster, with a 10.32% CAGR through 2031, as data-sovereignty rules proliferate. They demand secure, remotely administered units that can tolerate non-IT environments, further diversifying requirements inside the data center rack power distribution unit market.
Hyperscale clouds pursue capacity gains through both colocation halls and purpose-built campuses. They standardize power interfaces and buy in volume, but their long permitting cycles introduce lumpiness, prompting suppliers to hedge by diversifying across enterprise and edge. The multichannel interplay stabilizes overall shipment outlook despite individual sector swings in the data center rack power distribution unit (PDU) market.
By Rack Density: Above-20 kW Segment Surges on AI Workload Intensity
The above-20 kW segment is projected to grow at a CAGR of 10.04% through 2031, outpacing the 10-20 kW segment, which accounted for 48.43% of the market share in 2025. Service providers are implementing a dual-track strategy by allocating new cabinet procurements to the above-20 kW class, while using the 10-20 kW segment for the gradual upgrade of legacy halls. Furthermore, operators are reconfiguring existing rows by positioning AI-optimized racks near chilled-water manifolds and high-capacity busways. This approach enables them to avoid extensive electrical overhauls in the data center rack power distribution unit (PDU) market.
This zoning approach increases site utilization without jeopardizing thermal envelopes, and it prompts incremental orders for hybrid CDU-PDU units that integrate leak detection and branch-circuit monitoring. Consequently, vendor roadmaps emphasize modular power modules that can be field-upgraded from 20 kW to 30 kW ratings with minimal downtime, reinforcing the long-term shift in the shipment mix toward the high-density end of the spectrum.
Geography Analysis
Asia-Pacific accounted for 40.13% of the market share in 2025, helped by national cloud programs and renewable-energy strategies that funnel hyperscale builds to inland provinces where land and clean power are abundant. China’s Eastern Data Western Computing policy alone drives PDU shipments into double-digit gigawatt projects, while India’s 1,000 MW pipeline supports domestic SaaS and multinational captives. Japan adds incremental volume through automotive test tracks and smart-manufacturing edge nodes, particularly around Aichi and Kanagawa prefectures, where automakers feed sensor data into real-time analytics clusters. These dynamics underpin the region’s 10.14% CAGR and reinforce its lead in the data center rack power distribution unit market size.
North America follows, supported by USD 100 billion-plus hyperscale capex commitments in 2024-2025. Virginia’s Loudoun County continues to absorb record-setting builds, and Oregon’s renewable-heavy grid attracts GPU farms that target green cloud credits. Because local utility lead times stretch beyond two years, hyperscalers pre-purchase transformers and contract PDUs in bulk, securing unit allocations through 2027. While growth moderates relative to Asia-Pacific, sheer scale keeps volume robust in the data center rack power distribution unit (PDU) market.
Europe lags on account of energy-cost inflation and strict efficiency mandates under the EU Energy Efficiency Directive, which press operators to demonstrate sub-1.3 PUE performance and quarterly consumption reporting. Investment shifts toward retrofit efficiency rather than capacity addition, favoring intelligent PDUs with granular telemetry but tempering overall shipment growth. Middle East and Africa, meanwhile, emerge as intercontinental connectivity hubs. Sovereign-cloud policies in the United Arab Emirates and Saudi Arabia spur local hyperscale builds, and greenfield smart-city initiatives such as NEOM incorporate fully renewable 5 GW data centers, adding a fresh vector of demand for high-capacity three-phase units. South America rounds out the picture as Brazil enforces in-country data localization, motivating cloud entrants to establish regional facilities that push PDU demand upward despite macro volatility.

Regulatory Landscape
Safety, EMC, and hazardous-substance compliance shape global market access for rack PDUs, particularly as higher-current three-phase designs and network-connected monitoring expand the risk and audit surface. IEC 62368-1 (hazard-based safety engineering) is the dominant safety baseline for IT and communication equipment, and in North America UL 62368-1 Edition 4 (released in 2025) updates safety requirements relevant to rack-integrated power distribution subassemblies. For networked intelligent PDUs, electromagnetic emissions and radio/noise compliance also apply, including FCC Part 15 in the United States.
In Europe, CE marking links PDU placement on the market to conformity with the Low Voltage Directive (2014/35/EU), EMC Directive (2014/30/EU), and RoHS 3 (Directive 2015/863). Separately, data center efficiency policy pressure indirectly influences PDU specifications: the EU Ecodesign framework for servers and data storage products, including Regulation (EU) 2019/424, pushes operators toward granular metering and reporting-ready power infrastructure, which raises the value of intelligent PDUs with secure telemetry and auditable documentation. Procurement scrutiny also expands expectations for documentation packages (Declarations of Conformity, third-party test reports, and long-lived technical files), shaping vendor release cycles and regional SKU strategies.
Value Chain Analysis
The rack PDU value chain starts with upstream raw materials and electrical components, notably copper for busbars, breakers, and protection devices aligned to UL and EN requirements, as well as semiconductors and communications modules for intelligent monitoring and remote control. These inputs feed into PDU OEM design and manufacturing, spanning mechanical fabrication, metering and switching electronics, embedded firmware, and certification testing. Centralized electronics manufacturing capacity in China and Taiwan, together with semiconductor-component volatility and long lead times for specialized intelligent models, keeps supply planning and multi-sourcing central to vendor execution, particularly for three-phase, outlet-switched, and high-density configurations.
Downstream, distribution moves through electrical wholesalers, integrators, and rack infrastructure vendors into hyperscale, colocation, and enterprise and edge operators. Large buyers increasingly use multi-year framework agreements to secure allocations and standardize SKUs across regions. Service and software layers (DCIM integrations, API-driven orchestration hooks, firmware signing and OTA updates, and spares logistics) have also become material value-chain stages for smart PDUs, shifting margin toward lifecycle services. Regionalization is part of the chain optimization as well, with suppliers shifting assembly closer to demand centers, including the manufacturing moves noted toward Mexico and Poland in the competitive landscape context, to reduce delivery risk and align with local content and sovereign-cloud deployments.
Competitive Landscape
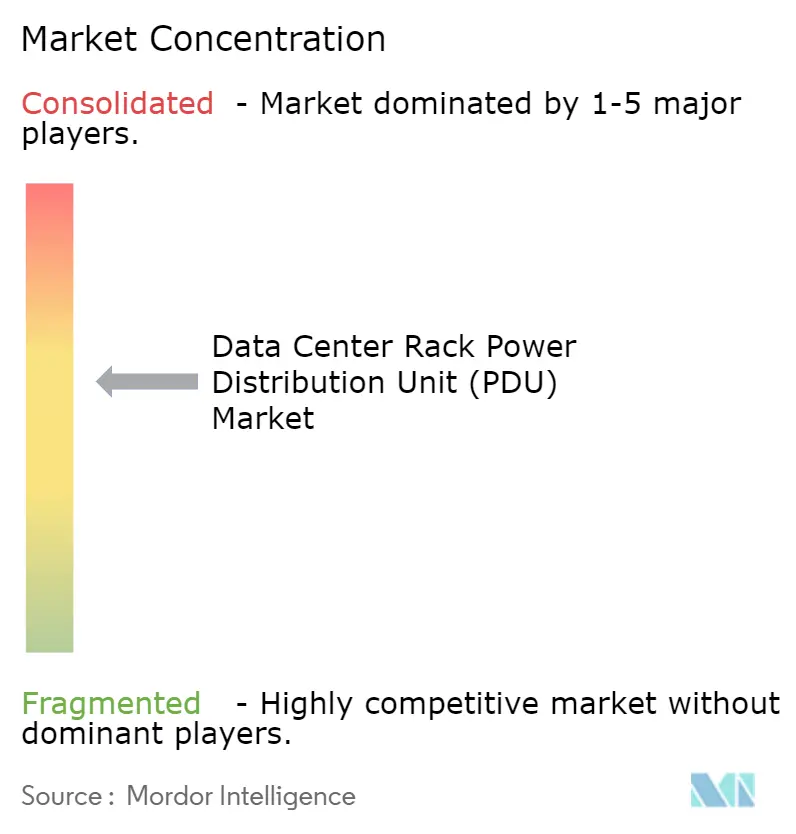
The data center rack power distribution unit (PDU) market remains moderately concentrated, with Schneider Electric, Vertiv, Eaton, Legrand, and ABB controlling just over half of global revenue. These incumbents defend their positions through vertical integration, firmware-centric differentiation, and region-specific manufacturing expansions. Schneider’s 2024 acquisition of Motivair illustrates convergence between power distribution and liquid cooling, enabling bundled rack infrastructure for AI clusters. Vertiv extends reach into the Middle East via its Powerbar Gulf purchase, pairing local assembly with service contracts that satisfy sovereign-cloud procurement rules.
Niche challengers such as nVent’s Enlogic, Starline, and Server Technology (now under Legrand) attack whitespace in modular busway and software-defined PDU segments. Their open-API architectures integrate with Kubernetes and OpenStack, allowing DevOps teams to treat power as code. Recurring subscription revenue on AI-enabled analytics climbs 15-20% annually, lifting gross margins and funding rapid product iterations. Meanwhile, fragmentation intensifies below the 10 kW range where regional suppliers compete on cost. Vendors differentiate with integrated lithium-ion UPS modules, 4G/5G backhaul, and physical footprints optimized for edge cabinets, broadening the total addressable data center rack power distribution unit market and eroding incumbent share at the low end.
Regional manufacturing footprints are becoming a decisive differentiator as buyers weigh total landed cost and supply-chain resilience alongside technical specifications. Schneider Electric and Eaton have both shifted a portion of PDU assembly to Mexico and Poland to shorten delivery times into North America and Europe, respectively, while Vertiv and ABB increased localized content thresholds in Saudi Arabia and the United Arab Emirates to comply with in-country value regulations tied to sovereign-cloud contracts. At the same time, Asian challengers such as Delta Electronics and Huawei leverage vertically integrated component ecosystems to price aggressively in Southeast Asia and Latin America, pressuring Western incumbents to bundle service-level agreements, spare-parts depots, and five-year firmware road maps in order to preserve margin. This geographic diversification of manufacturing and service capabilities adds a fresh layer of competitive intensity, favoring suppliers with global scale yet regional agility.
Data Center Rack Power Distribution Unit (PDU) Industry Leaders
Schneider Electric SE
Vertiv Group Corp.
Eaton Corporation plc
ABB Ltd
Legrand SA
- *Disclaimer: Major Players sorted in no particular order

Market Opportunities and Future Outlook
High-density AI racks and liquid-cooling convergence create a clear opportunity for PDUs that combine higher-current delivery, richer telemetry, and tighter integration with rack thermal infrastructure. In the installed base, pre-2020 facilities designed for 5-8 kW per rack face 20-30 kW requirements and challenging retrofit constraints. That dynamic makes modular, field-upgradeable PDU architectures and hybrid CDU-PDU form factors attractive where operators want incremental densification without full electrical rework. Vertiv beginning volume shipments of a hybrid CDU-PDU platform in February 2026 is a concrete signal that integrated rack power-and-cooling packages are moving from early deployments into broader commercialization, expanding the addressable opportunity beyond standalone strips.
A second opportunity centers on standards-aligned, interoperable power delivery and management for hyperscale and colocation operators running mixed global fleets. Open Compute Project specifications, including universal PDU concepts and Open Rack alignment, support more standardized rack power interfaces, and they align with the market shift toward software-defined operations where PDUs expose APIs and support secure, auditable remote control. On the compliance side, tighter procurement checks and the 2025 update to UL 62368-1 reinforce demand for certification-ready designs and documentation. Europe-side efficiency policy pressure strengthens the business case for intelligent PDUs that produce meter-grade telemetry for tenant billing and consumption reporting. Cybersecurity remains a gating factor for networked PDUs, which creates product whitespace for vendors that can demonstrate hardened firmware, signed updates, and segmentation-friendly management architectures while still delivering the remote-management benefits that support smart PDU adoption.
Recent Industry Developments
- June 2026: Schneider Electric announced a strategic partnership with Hon Hai Technology Group (Foxconn) to co-develop and mass-produce integrated power, cooling, and energy-management hardware aimed at next-generation AI data centers. The tie-up aligns rack power distribution with contract manufacturing scale, supporting faster standardization of high-density infrastructure building blocks across global deployments.
- November 2025: Legrand integrated Server Technology’s intelligent-PDU firmware into its CloudRail platform, enabling fleet-wide over-the-air updates and unified analytics across 20,000 units deployed in Digital Realty sites. Consolidating firmware management and telemetry under a single platform raises switching costs for large operators and strengthens Legrand’s position in software-attached PDU refresh cycles.
- August 2024: Schneider Electric completed the acquisition of Motivair, adding liquid-cooling capabilities that complement rack power distribution portfolios used in AI-focused data centers. The deal supports bundled rack infrastructure offers where PDUs, cooling distribution, and monitoring are specified together for higher-density rollouts.


Research Methodology Framework and Report Scope
Market Definition and Coverage
This market covers rack-mounted power distribution units used inside data center IT racks to deliver and control power for servers, storage, and networking gear. The model tracks PDU hardware sold into new builds, capacity expansions, and replacement cycles across global data center sites.
Scope exclusions: We exclude facility-level switchgear, UPS systems, busway, and other upstream electrical equipment that sits outside the rack.
Segmentation Overview
- By Construction
- Smart PDU
- Basic PDU
- By Phase
- Single-Phase
- Three-Phase
- By Tier Type
- Tier 1 and 2
- Tier 3
- Tier 4
- By Data Center Size
- Small Data Center
- Medium Data Center
- Large Data Center
- Hyperscale Data Center
- By Data Center Type
- Colocation Data Center
- Hyperscalers Data Center/CSPs
- Enterprise and Edge Data Center
- By Rack Density (kW per Rack)
- Up to 10 kW
- 10-20 kW
- Above 20 kW
- By Geography
- North America
- United States
- Canada
- Mexico
- South America
- Brazil
- Argentina
- Rest of South America
- Europe
- Germany
- United Kingdom
- France
- Italy
- Spain
- Rest of Europe
- Asia-Pacific
- China
- India
- Japan
- South Korea
- Australia and New Zealand
- Rest of Asia-Pacific
- Middle East
- Saudi Arabia
- United Arab Emirates
- Turkey
- Rest of Middle East
- Africa
- South Africa
- Nigeria
- Egypt
- Rest of Africa
- North America
Data Sources, Market Sizing, and Validation
Desk Research
Desk work starts with mapping the demand pool for racks and IT power density, then checking how that demand translates into rack-level power distribution. Public sources anchor the model, including U.S. Energy Information Administration data, USITC trade statistics, International Energy Agency electricity and data center notes, ITU connectivity indicators, and standards documentation from IEC and IEEE for PDU-related electrical requirements.
We also review company annual reports, earnings decks, product datasheets, safety certifications, and credible industry news to understand product mix shifts such as metering, monitoring, and switching features. For data sanity checks, we selectively use paid subscriptions for company financials and intelligence, patent databases, and shipment-level trade databases when country-level import signals help explain quarter-to-quarter swings. These desk sources are illustrative only, and many other references were used for data collection, validation, and clarification.
Primary Interviews and Surveys
Primary work is used to pressure-test assumptions on rack density adoption, smart versus basic PDU mix, pricing movement, and replacement timing across enterprise, colocation, and hyperscale settings. We spoke with respondents across the value chain, including OEMs, channel partners, installers, and data center operators, and then used those inputs to validate regional dynamics for APAC, EMEA, and the Americas.
Distribution of primary research fieldwork respondents
| Company type | Respondent position | Region |
|---|---|---|
| Top tier: 25% | CXOs: 18% | APAC: 43% |
| Mid tier: 55% | Functional/Unit leaders: 32% | EMEA: 37% |
| Smaller Players: 20% | Managers: 50% | Americas: 20% |
Market-Sizing & Forecasting
Sizing starts with a top-down build where additions of data center racks and average rack power density are translated into a realistic installed base that requires rack PDUs. We then convert that demand into value using typical PDU per-rack configurations. Because deployment patterns differ by data center type, we apply separate adoption and refresh logic for enterprise rooms, colocation halls, and hyperscale facilities before rolling up to a global total.
To keep outputs grounded, we corroborate results with selective bottom-up approximations, such as estimated unit demand derived from sampled ASPs, channel feedback on shipment ranges, and supplier revenue exposure checks when disclosures allow. Key model inputs include rack density bands (up to 10 kW, 10 to 20 kW, and above 20 kW), the share of smart PDUs versus basic PDUs, single-phase versus three-phase usage, the split of new installs versus replacements, and regional data center build activity. Where direct unit visibility is limited, we handle gaps using conservative adoption ranges and then narrow them using operator interviews.
Forecasting uses scenario analysis supported by multivariate checks, where growth links to rack deployments, power density trends, and modernization cycles. Assumptions are tuned to expert consensus on lead times, feature attach rates, and near-term pricing behavior, then reviewed for internal consistency year by year.
Data Validation & Update Cycle
Model outputs are validated through multiple checks, including reconciling implied unit volumes with observable rack build signals and comparing pricing ranges with what buyers and channel partners report. Outliers are investigated, and when variance cannot be explained by mix shift, currency timing, or one-off ordering, the assumptions are reworked and rechecked.
Before sign-off, the model and narrative go through a stepwise analyst review to align math, scope, and logic. The report is refreshed annually, with interim updates when material events occur, such as large capacity announcements, supply constraints, or regulatory changes that shift product specifications. Right before delivery, a final review pass is completed so clients receive the latest updated view.
Mordor Intelligence's Data Center Rack Pdu Market Size Compared With Other Published Estimates
Published market sizes for rack PDUs often differ because each publisher chooses its own year, product scope, and pricing assumptions, and those choices can look similar on the surface. Differences also show up when some estimates lean more on shipment narratives, while others lean more on revenue proxies and do not fully reconcile the two.
In this study, the biggest drivers behind gaps are whether facility-level power distribution equipment is mixed in with rack-only PDUs, how smart PDU features are priced over time, and how quickly higher rack densities are assumed to spread beyond hyperscale sites. Currency conversion timing and refresh cadence can add extra spread, particularly when regional build activity shifts between APAC, EMEA, and the Americas.
Benchmark comparison
| Source | Market Size | Gaps in Research Methodology |
|---|---|---|
| Mordor Intelligence | USD 3.01 B (2026) | |
| Global Research Firm A | USD 2.81 B (2025) | Uses an earlier reference year and may apply a different pace for smart PDU feature adoption, which can lower the implied ASP progression when density upgrades are modeled more gradually. |
| Research Publisher B | USD 3.47 B (2024) | States a 2024 valuation that can read higher if adjacent rack power accessories or broader application baskets are included, and if average pricing is not normalized by phase mix and mounting preferences across regions. |
The spread mainly reflects scope and timing choices rather than a disagreement that demand is rising. When rack-only hardware is counted and price and mix are tied back to rack density and refresh behavior, the estimate stays easier to track and replicate, which is how the model was framed here, followed through to sign-off by Mordor Intelligence.


Key Questions Answered in the Report
What is the forecast CAGR for data center rack power distribution units to 2031?
The market is projected to register an 8.96% CAGR between 2026 and 2031, fueled by hyperscale expansion, AI workloads, and liquid-cooling retrofits.
Which construction type leads current shipments?
Smart PDUs claimed 61.42% revenue share in 2025 and are poised to outgrow basic models thanks to remote-management and billing features.
Why are three-phase PDUs gaining ground over single-phase units?
High-density AI servers draw more than 15 kW per rack; three-phase 415-V or 480-V feeds reduce resistive loss and comply with utility incentive programs.
Which region shows the fastest growth outlook?
Asia-Pacific leads with a forecast 10.14% CAGR to 2031, driven by China’s inland hyperscale builds and India’s 1,000 MW capacity pipeline.
Page last updated on:
- Data Center Power Market Power systems across the global market, covering component, tier and facility size.
- Data Center Cooling Market Cooling across the global market, covering cooling technology, cooling component and facility type.
- Data Center Construction Market Construction worldwide, split by tier, facility size and facility type.
- North America Data Center Rack Market Racks demand across North America, covering rack size and end user.
- US Data Center Rack Market Racks demand across the US, covering rack size and end-user.
- North America Data Center Cooling Market North America's cooling, split by cooling technology, cooling component and tier.
- Taiwan Data Center Power Market Taiwan power systems, split by power infrastructure and end user.
- United States Data Center Processor Market The US processors, split by facility size and tier.
- India Data Center Cooling Market India's cooling, split by facility type, tier and cooling technology.
- United States Data Center Power Market Power systems demand across the US, covering component, facility type and facility size.
- North America Green Data Center Market Energy efficiency demand across North America, covering component, tier and facility size.
- United States Artificial Intelligence (AI) Data Center Market AI facilities in the US, split by facility type, component and tier.
- Germany Data Center Power Market Power systems demand across Germany, covering component, facility type and facility size.
- Sweden Data Center Power Market Sweden power systems, split by component, facility type and facility size.


 Your data is secure and never sold or shared.


