Africa Data Center Power Market Size and Share
Market Overview
| Study Period | 2019 - 2030 |
|---|---|
| Forecast Data Period | 2025 - 2030 |
| Historical Data Period | 2019 - 2023 |
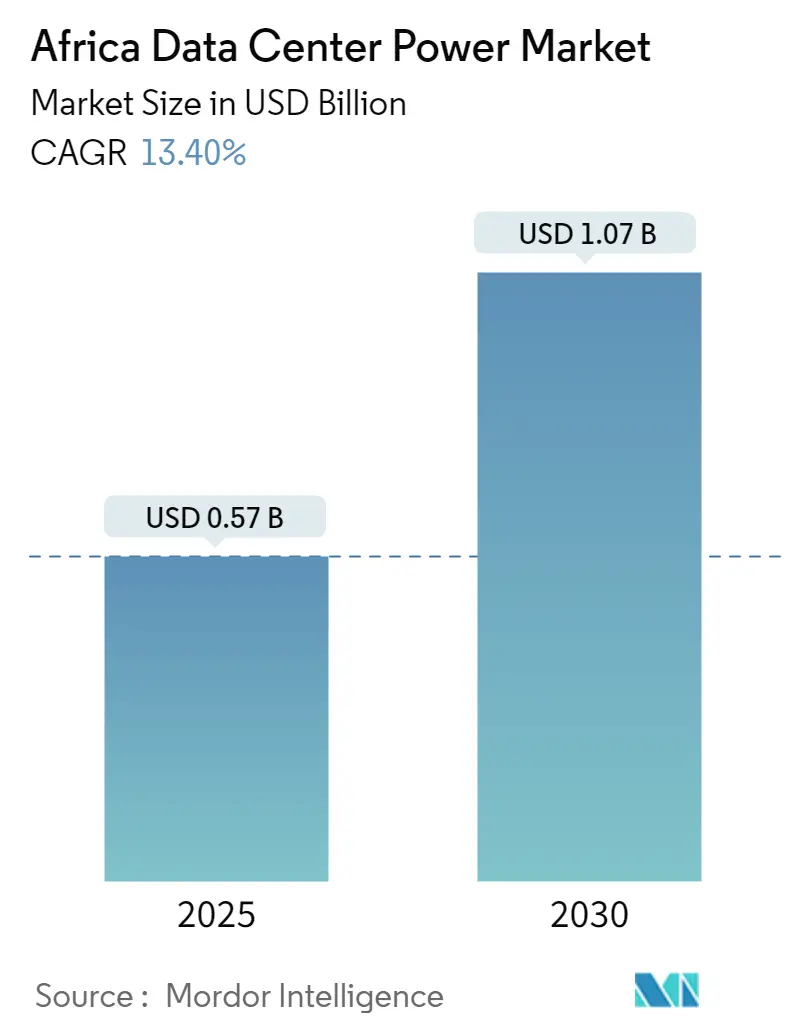
| Market Size (2025) | USD 0.57 Billion |
| Market Size (2030) | USD 1.07 Billion |
| Growth Rate (2025 - 2030) | 13.40% CAGR |
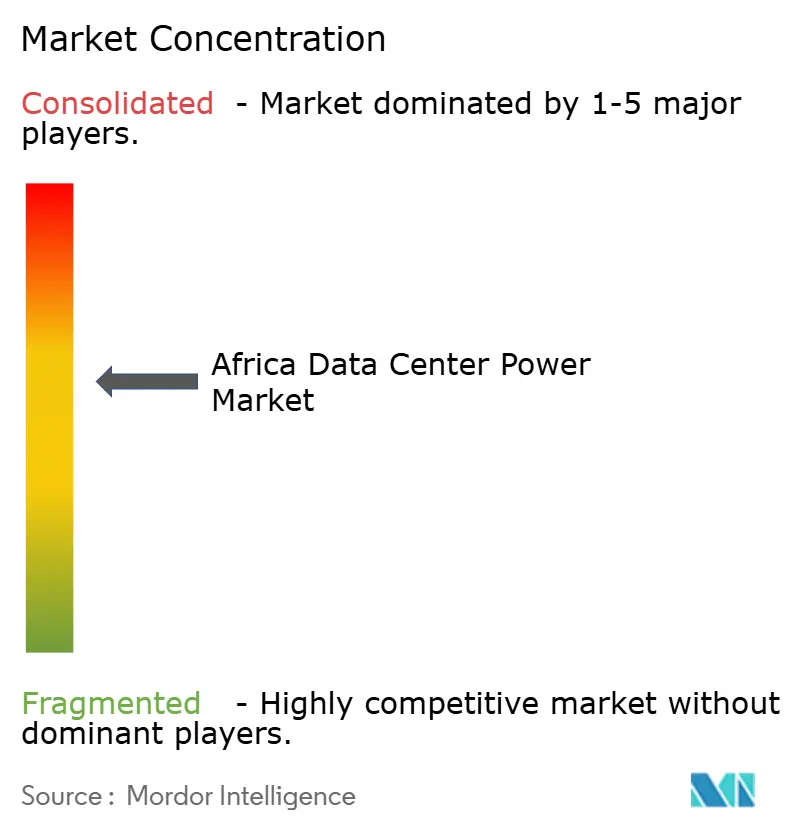
| Market Concentration | Medium |
Major Players *Disclaimer: Major Players sorted in no particular order Image © Mordor Intelligence. Reuse requires attribution under CC BY 4.0. | |
Africa Data Center Power Market Analysis by Mordor Intelligence
The Africa data center power market is valued at USD 0.57 billion in 2025 and is forecast to reach USD 1.07 billion by 2030, translating into a 13.4% CAGR. Rapid digital transformation programs, expanding subsea cable capacity, and a clear push by hyperscalers to satisfy data-sovereignty rules are the key forces behind this climb. At the same time, per-capita data-center electricity consumption is expected to double to almost 2 kWh by 2030, signalling substantial grid and on-site generation build-outs. Operators are adopting hybrid energy designs that blend grid feeds with solar microgrids, battery storage, and hydrogen fuel cells to cut exposure to load-shedding events and meet corporate sustainability targets. Vendor competition continues to revolve around modular UPS architectures and intelligent PDUs that squeeze out every percentage point of energy efficiency. Government policies such as South Africa’s National Policy on Data and Cloud 2024 are further accelerating investment by clarifying reliability and environmental compliance obligations.
Key Report Takeaways
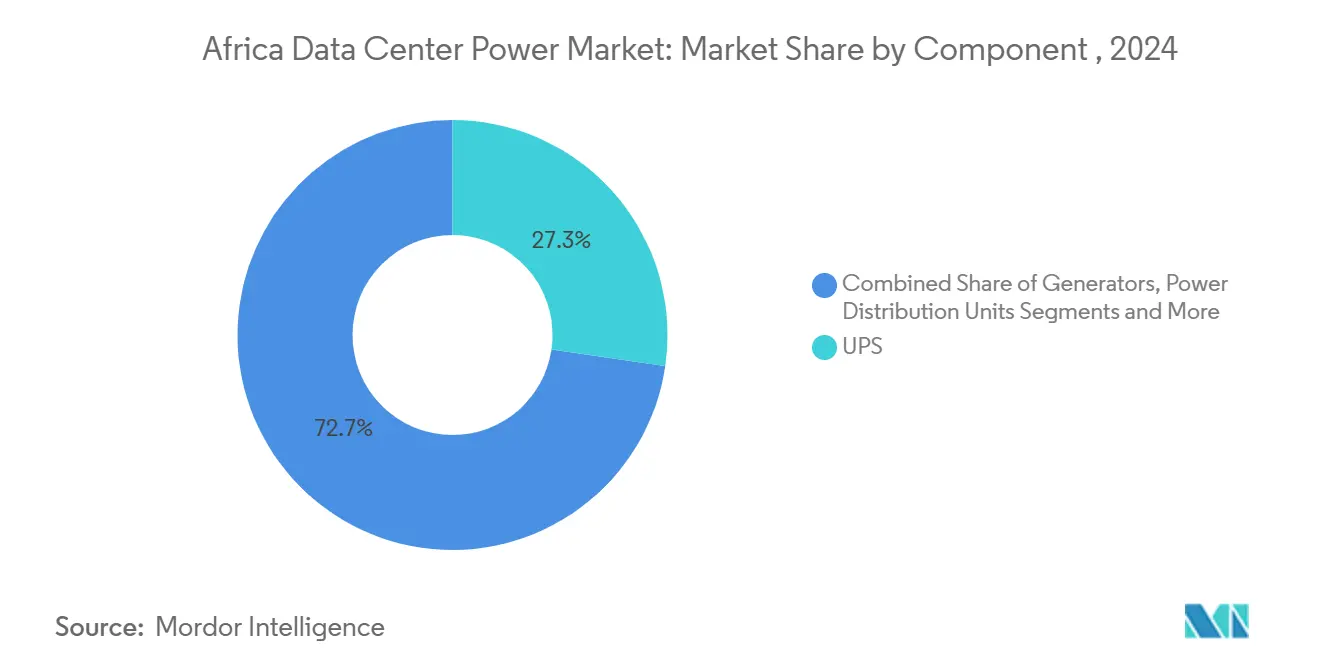
- By component, UPS systems accounted for 27.3% of the Africa data center power market size in 2024, whereas PDUs are projected to post the fastest 13.7% CAGR to 2030.
- By data-center type, colocation providers held 52.1% revenue share in 2024; hyperscaler/cloud service providers are advancing at a 14.9% CAGR to 2030.
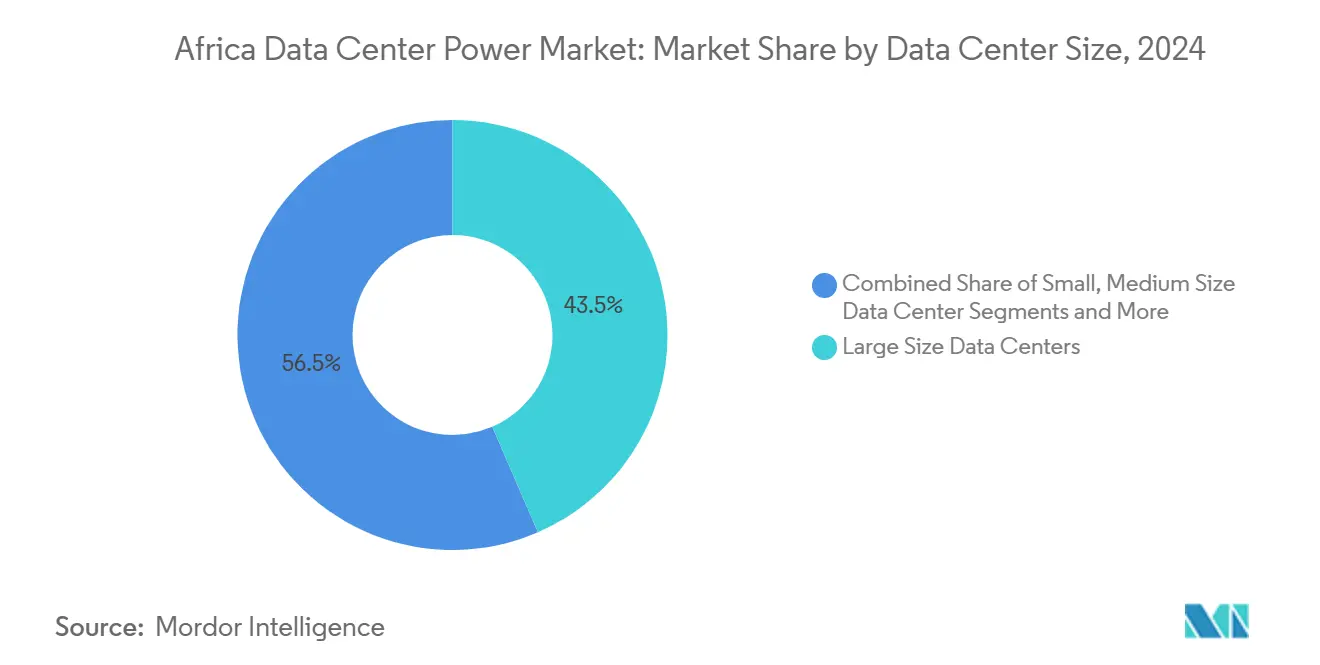
- By facility size, large data centers captured 43.5% of the Africa data center power market size in 2024, yet mega-scale sites are set to expand at 14.7% CAGR over 2025-2030.
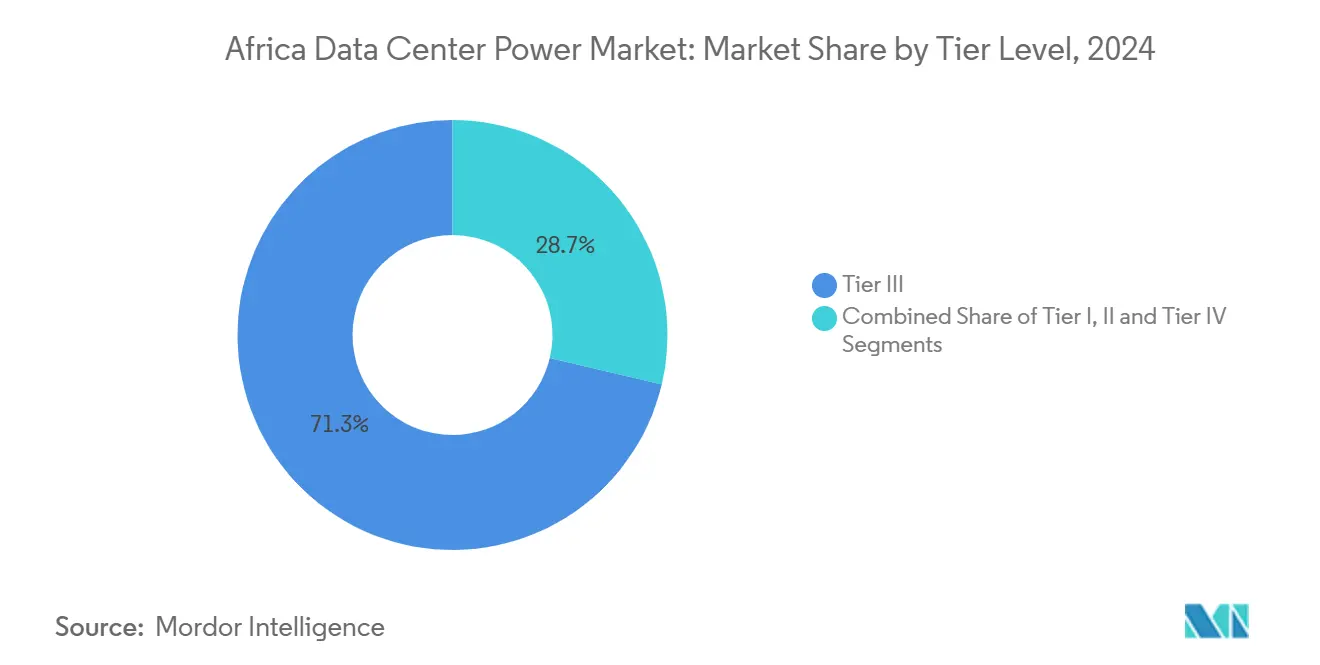
- By tier classification, Tier 3 facilities dominated with 71.3% share in 2024; Tier 4 deployments are rising at a 15.3% CAGR on the back of enterprise uptime demands.
- By country, South Africa led with 47.5% of Africa data center power market share in 2024, while Nigeria is on track to expand at a 13.5% CAGR through 2030
Africa Data Center Power Market Trends and Insights
Drivers Impact Analysis*
| Driver | (~)% Impact on CAGR Forecast | Geographic Relevance | Impact Timeline |
|---|---|---|---|
| Rising adoption of mega data centers & cloud computing | +3.2% | Global, with concentration in South Africa, Nigeria, Kenya | Medium term (2-4 years) |
| Growing hyperscaler investments & colocation build-outs | +2.8% | South Africa, Nigeria, Kenya, Egypt, Morocco | Short term (≤ 2 years) |
| Need to reduce OPEX via high-efficiency UPS & PDUs | +2.1% | Global, particularly cost-sensitive markets like Nigeria, Kenya | Medium term (2-4 years) |
| Government digital-economy initiatives & tax breaks | +1.9% | National policies in South Africa, Kenya, Nigeria, Morocco | Long term (≥ 4 years) |
| Renewable-energy microgrids integrated at campus level | +1.7% | Solar-rich regions: South Africa, Morocco, Egypt | Long term (≥ 4 years) |
| New submarine-cable landing hubs driving edge build-outs | +1.3% | Coastal markets: South Africa, Nigeria, Kenya, Morocco | Medium term (2-4 years) |
| Source: Mordor Intelligence | |||
Rising adoption of mega data centers & cloud computing
Hyperscale operators now specify campus power envelopes between 40 MW and 100 MW, dwarfing the 5-15 MW designs that once anchored the Africa data center power market. Microsoft’s planned USD 1 billion geothermal-powered site in Kenya illustrates how purpose-built facilities are achieving per-megawatt cost reductions of up to 25% by standardizing UPS blocks and modular PDUs. Enterprises shifting on-prem workloads to the cloud compound this momentum by raising baseline capacity requirements for latency-sensitive AI workloads. As a result, operators regard mega-scale footprints as the surest route to capex efficiency and regulatory compliance, accelerating demand for advanced switchgear, medium-voltage substations, and renewable microgrids across the continent.
Growing hyperscaler investments & colocation build-outs
Equinix has earmarked USD 390 million for African expansion, while Digital Realty is deepening its regional footprint through joint ventures with local players. This influx is reshaping the Africa data center power market by pushing colocation facilities to deploy redundant UPS strings, multiple-fuel generators, and on-site solar fields that satisfy Tier 3 or higher availability. Shared infrastructure lets smaller tenants bypass hefty up-front capex and tap world-class power systems, a proposition that resonates strongly in Nigeria and Kenya where grid instability persists. For vendors, the surge translates into steady orders for multi-megawatt static UPS line-ups, ring-bus switchboards, and high-density busways designed to accommodate cloud operators’ rapid rack-level power increases.
Need to reduce OPEX via high-efficiency UPS & PDUs
Power represents up to one-third of operating costs for a typical African facility. New UPS designs, boasting 96-98% conversion efficiency, can shave 2-4% from total electricity use, yielding immediate savings in tariff-sensitive markets. [1]Schneider Electric, “UPS Efficiency Advances for Data Centres,” se.com Intelligent rack-based PDUs with granular metering and branch-circuit protection further unlock 5-10% energy reductions by highlighting stranded capacity and unbalanced phases. These gains are crucial for operators wrestling with import-driven price swings on diesel, filters, and replacement batteries because they directly shield profit margins
Government digital-economy initiatives & tax breaks
National programs, ranging from Kenya’s Digital Economy Blueprint to Morocco’s renewables-first power policy, are deliberately easing the project-financing pathway for data-center power builds. South Africa’s 2024 policy framework explicitly obliges facilities to secure reliable electricity and encourages partnerships that add renewable capacity to the national grid.[2]Government of South Africa, “National Policy on Data and Cloud 2024,” gov.za Kenya targets a KES 662 billion GDP lift from its digital sector by 2028, and offers import-duty abatements for energy-efficient UPS systems. Such incentives compress payback periods on hybrid power architectures and tilt investment decisions in favor of local campuses rather than offshore hosting, a trend that solidifies the long-term expansion trajectory of the Africa data center power market.
Restraints Impact Analysis*
| Restraint | (~)% Impact on CAGR Forecast | Geographic Relevance | Impact Timeline |
|---|---|---|---|
| High capex & maintenance cost of power infrastructure | -2.1% | Global, particularly affecting smaller operators in Nigeria, Kenya | Short term (≤ 2 years) |
| Grid unreliability & rolling load-shedding events | -1.8% | South Africa, Nigeria, Kenya with grid stability challenges | Medium term (2-4 years) |
| Shortage of data-center-grade power engineers | -1.2% | Continental, most acute in emerging markets | Long term (≥ 4 years) |
| FX volatility inflating imported equipment prices | -0.9% | Currency-volatile markets: Nigeria, Kenya, Egypt | Short term (≤ 2 years) |
| Source: Mordor Intelligence | |||
High capex & maintenance cost of power infrastructure
Building a data center in Africa can cost 10-20% more per megawatt than the global average, with power train equipment—UPS blocks, medium-voltage switchgear, diesel generators—soaking up nearly half that outlay. Harsh climates inflate maintenance budgets by compelling shorter service intervals on filters, alternators, and battery strings, often pushing opex 15-25% above temperate-region benchmarks.[3]Bank of America, “Industrials/Multi-Industry Who Makes the Data Center,” bankofamerica.com The price tag throttles market entry for smaller domestic operators, limits experimentation with next-generation lithium-ion or hydrogen systems, and slows refresh cycles, thereby capping how quickly the Africa data center power market can absorb the most efficient technologies.
Grid unreliability & rolling load-shedding events
South Africa’s scheduled load shedding, Nigeria’s frequent brownouts, and Kenya’s periodic voltage excursions oblige operators to layer N+1 diesel generators, bulk fuel tanks, and fast-transfer switchgear onto already expensive builds. The extra redundancy not only adds capex but complicates renewable integration, since battery banks must be oversized to smooth utility disturbances. While policymakers now ask data centers to curb grid reliance, the technical reality is that without robust public-utility reforms, the Africa data center power market will continue to funnel capital into backup generation that does not advance net-zero objectives.
*Our forecasts treat driver/restraint impacts as directional, not additive. The impact forecasts reflect baseline growth, mix effects, and variable interactions.
Segment Analysis
By Component: UPS Systems Lead While PDUs Accelerate
UPS systems held a 27.3% share of the Africa data center power market in 2024 and form the backbone of every Tier 3 and Tier 4 electrical design. The segment benefits from the continent’s chronic grid fluctuations, prompting operators to install double-conversion units that ensure clean power even during utility transients. Lithium-ion battery racks, although pricier upfront, are gaining favor for their smaller footprint and longer life, cutting battery-replacement truck rolls in half.
Power Distribution Units (PDUs) are on a 13.7% CAGR trajectory through 2030, the quickest pace among components, as facilities migrate toward high-density racks feeding AI accelerators. Intelligent PDUs outfitted with branch-circuit monitors allow remote provisioning down to the outlet level, a feature crucial for colocation tenants demanding transparent power billing. Generators keep a firm regional foothold, yet hydrogen fuel-cell prototypes piloted by Vertiv and Ballard foreshadow a greener standby landscape. Switchgear, transfer switches, and remote power panels complement UPS and PDU installations, while integration and maintenance services deliver rising recurring revenue streams for electrical-engineering service firms.


By Data Center Type: Colocation Dominance Faces Hyperscaler Challenge
Colocation players supplied 52.1% of Africa data center power market revenue in 2024 by pooling capital-intensive UPS plants and diesel farms across multiple tenants. Their business case thrives in environments where power-engineering talent is scarce and capital markets price risk high. To defend share, leading colos are rolling out interconnect-rich campuses with on-site solar arrays that offset grid carbon footprints and grant marketing leverage against hyperscale rivals.
Hyperscalers, however, are advancing at a 14.9% CAGR, leveraging bulk-procurement muscle to secure discounted megawatt blocks and push for geothermal or utility-co-located solar feeds. Microsoft’s geothermal-cooled build in Kenya exemplifies how cloud providers realign site-selection criteria around indigenous renewable resources, tilting competitive dynamics. Edge and enterprise facilities remain niche, but they address latency-critical workloads such as fintech transaction clearing and 5G core hosting, often in 1-10 MW shells where single-bus UPS schemes and containerized battery storage deliver cost parity.
By Data Center Size: Large Facilities Dominate as Mega-Scale Emerges
Large facilities represented 43.5% of the Africa data center power market size in 2024, as they strike a balance between capex leverage and deployment agility. Developers lean on modular UPS blocks that can be rolled into hot-aisle corridors without disrupting live loads, enabling staggered capex drawdowns aligned to customer sign-ups.
Mega facilities are the fastest-growing slice at 14.7% CAGR, driven by AI-accelerated cloud services and sovereign-cloud frameworks that mandate in-region data processing. Africa data center power market share gains in this band hinge on tapping renewable PPAs linked to solar fields in sun-dense corridors, as evidenced by Teraco’s 120 MW PV build in South Africa. Medium and small sites continue serving edge-compute niches and disaster-recovery nodes; however, their simplistic single-bus power tops out around 5 MW, limiting attractiveness for multi-tenant public-cloud workloads.
By Tier Level: Tier 3 Standards Prevail Despite Tier 4 Growth
Tier 3 architectures delivered 71.3% of the Africa data center power market share in 2024. They employ dual-feed switchgear, concurrent-maintenance UPS layouts, and N+1 diesel sets that yield 99.982% uptime without elevating capex to Tier 4 extremes. Continuous improvements such as dynamic rotary UPS and lithium-ion strings help these plants approach Tier 4 energy efficiency while retaining mid-tier economics.
Tier 4 rollouts, expanding at 15.3% CAGR, often anchor hyperscale or high-availability banking workloads. These designs rely on 2N electrical paths and synchronous-transfer systems that isolate any single fault. While capex can surge 30-40% relative to Tier 3, larger operators justify costs through premium service-level agreements. Tier 1 and Tier 2 options survive at the edge, handling IoT data caching and test-dev pockets where downtime tolerance is higher.
Geography Analysis
South Africa delivered 47.5% of Africa data center power market revenue in 2024. Despite ongoing load-shedding, its mature transmission grid and concentration of financial services make Johannesburg and Cape Town natural magnets for Tier 3+ builds. Operators offset Eskom instability with large solar farms and multi-hour lithium-ion banks that deliver partial islanding capability during peak curtailment.
Nigeria is set to record the fastest 13.5% CAGR to 2030, propelled by its 200-million-plus population and a vibrant fintech sector. Persistent 30-40% grid-availability shortfalls have normalized diesel genset reliance, pushing sites to adopt at-scale fuel-polishing systems and automated paralleling switchgear. Kenya, Egypt, and Morocco round out the high-growth cluster, each leveraging distinctive power-generation mixes—geothermal, natural-gas plus solar, and utility-scale wind respectively—to court hyperscale tenants and broaden the geographic spread of the Africa data center power market.
Competitive Landscape
Competition is moderate, with Schneider Electric, Vertiv, ABB, and Eaton vying for switchgear and UPS deals across hyperscale, colocation, and edge builds. None commands more than a low-twenties percentage of Africa's data center power market share, reflecting divergent procurement practices across 50+ countries. Global vendors pitch integrated DCIM and power-train portfolios, while regional integrators win business by bundling local civil works knowledge with multi-vendor electrical packages.
Strategic moves increasingly emphasize sustainability. Vertiv’s hydrogen partnership with Ballard Power aims to replace diesel sets in megawatt increments, while Schneider Electric pushes EcoStruxure-enabled microgrids that blend PV, battery, and utility feeds to achieve sub-PUE operating envelopes. ABB and Eaton differentiate through solid-state switchgear and silicon-carbide inverter technology capable of faster fault isolation and higher efficiency at partial load.
Africa Data Center Power Industry Leaders
ABB Ltd
Schneider Electric SE
Vertiv Group Corp.
Eaton Corporation plc
Caterpillar Inc.
- *Disclaimer: Major Players sorted in no particular order

Recent Industry Developments
- April 2025: Raxio Group secured USD 100 million from IFC to build a pan-African data-center platform, expanding power capacity in several countries.
- March 2025: Axian Telecom obtained a USD 160 million African Development Bank loan to modernize network infrastructure in nine markets, indirectly lifting demand for robust data-center power.
- March 2025: Cummins Inc. pledged USD 200 million to boost generator production lines catering to large African data-center orders.
- November 2024: Teraco began constructing a 120 MW solar plant in South Africa’s Free State province to supply renewable power to its campuses.


Research Methodology Framework and Report Scope
Market Definitions and Key Coverage
Our study defines the Africa data center power market as the annual value of electrical infrastructure, uninterruptible power supplies, generators, power-distribution units, switchgear, remote power panels, plus the design and maintenance services that keep servers energized, installed in new builds, expansions, and retrofits across all 54 African nations.
In our scope exclusions, we leave out public-grid upgrades, standalone renewable farms, and cooling systems that do not form part of the electrical feed.
Segmentation Overview
- By Component
- Electrical Solutions
- UPS Systems
- Generators
- Diesel Generators
- Gas Generators
- Hydrogen Fuel-cell Generators
- Power Distribution Units
- Switchgear
- Transfer Switches
- Remote Power Panels
- Energy-storage Systems
- Service
- Installation and Commissioning
- Maintenance and Support
- Training and Consulting
- Electrical Solutions
- By Data Center Type
- Hyperscaler/Cloud Service Providers
- Colocation Providers
- Enterprise and Edge Data Center
- By Data Center Size
- Small Size Data Centers
- Medium Size Data Centers
- Large Size Data Centers
- Massive Size Data Centers
- Mega Size Data Centers
- By Tier Level
- Tier I and II
- Tier III
- Tier IV
- By Country
- South Africa
- Nigeria
- Kenya
- Egypt
- Morocco
- Rest of Africa
Detailed Research Methodology and Data Validation
Primary Research
Mordor analysts interviewed facility design engineers, colocation procurement heads, and regional power consultants in South Africa, Nigeria, Kenya, and Egypt. These conversations validated shipment volumes, redundancy choices, and service attach rates that rarely appear in documents.
Desk Research
We began by extracting energy and ICT statistics from bodies such as the International Energy Agency, the African Development Bank, and national regulators, which outline capacity additions and reliability metrics. Public customs data under HS codes 8504 and 8507 indicated inbound volumes of UPS and batteries, while Uptime Institute white papers and AFCOM surveys provided rack density benchmarks. Company filings, colocation operator presentations, and news archives accessed through Dow Jones Factiva offered pricing clues and pipeline announcements. The sources listed are illustrative, and many additional open and paid repositories supported data checks.
Market-Sizing & Forecasting
We apply a top-down approach that starts with installed IT load (MW) derived from capacity trackers and grid interconnection filings, then multiplies it by replacement cycles and average selling prices to obtain the 2025 baseline. We corroborate results with selective bottom-up supplier roll-ups and channel checks when warranty volumes or price trends diverge. Key variables include submarine cable landings, average rack-density uplift, national outage hours, lithium-ion UPS penetration, and local-currency inflation. A multivariate regression links these drivers to historical spend and projects 2025-2030 scenarios, while proportional allocation fills gaps in smaller markets.
Data Validation & Update Cycle
Every estimate passes a two-stage peer review and variance screen that flags deviations above five percent. We refresh the model each year and trigger interim updates after material events, such as a 20 MW hyperscale launch or tariff reform, before a final analyst sweep confirms source integrity.
Why Mordor's Africa Data Center Power Baseline Earns Trust
We acknowledge that published estimates often diverge because firms choose different geographies, include or exclude services, or lock exchange rates at varying points.
Our disciplined scope, annual refresh cadence, and dual-path modeling give decision-makers a traceable anchor.
Benchmark comparison
| Market Size | Anonymized source | Primary gap driver |
|---|---|---|
| USD 570 million (2025) | Mordor Intelligence | |
| USD 541 million (2024) | Regional Consultancy A | Covers MEA region and allocates spend using revenue ratios without facility-level cross-checks |
| USD 1.30 billion (2024) | Global Consultancy B | Relies solely on supplier ASP surveys, omits service revenues, and assumes constant rack-density uplift |
The comparison shows that broader or narrower scopes and unverified price assumptions widen the spread, whereas Mordor's balanced, transparent steps produce a dependable baseline suited for strategic planning.


Key Questions Answered in the Report
What is the current size of the Africa data center power market?
The market is valued at USD 0.57 billion in 2025 and is projected to grow to USD 1.07 billion by 2030.
Which country leads the Africa data center power market?
South Africa holds 47.5% of revenue thanks to mature grid infrastructure and a dense concentration of enterprise demand.
Why are UPS systems so critical for African data centers?
Frequent grid disturbances make UPS systems indispensable for delivering continuous, clean power and preventing costly downtime.
How fast is the hyperscale segment growing?
Hyperscaler and cloud service provider facilities are expanding at a 14.9% CAGR, the fastest among all data-center types.
Page last updated on:


