
Global Cranial Implants Market Size and Share
Market Overview
| Study Period | 2020 - 2031 |
|---|---|
| Market Size (2026) | USD 1.49 Billion |
| Market Size (2031) | USD 2.01 Billion |
| Growth Rate (2026 - 2031) | 6.18 % |
| Fastest Growing Market | Asia-Pacific |
| Largest Market | North America |
| Market Concentration | Medium |
Major Players *Disclaimer: Major Players sorted in no particular order Image © Mordor Intelligence. Reuse requires attribution under CC BY 4.0. | |
Global Cranial Implants Market Analysis by Mordor Intelligence
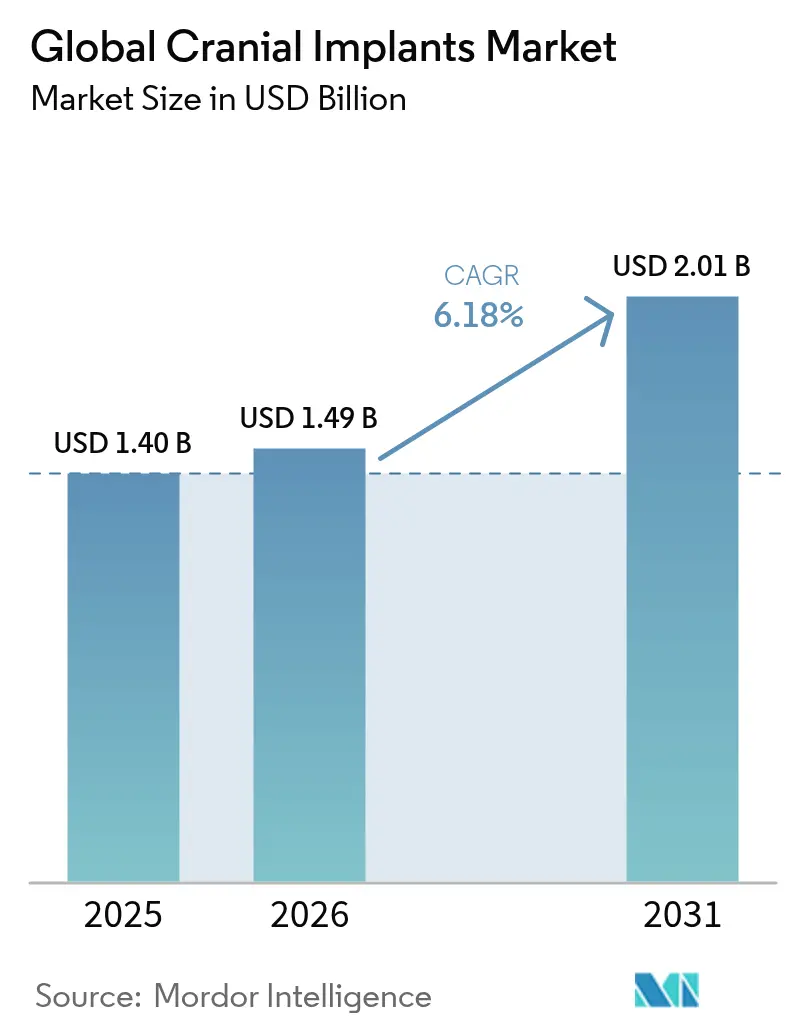
The cranial implants market size is expected to grow from USD 1.40 billion in 2025 to USD 1.49 billion in 2026 and is forecast to reach USD 2.01 billion by 2031 at 6.18% CAGR over 2026-2031. Robust demand stems from a steady rise in traumatic brain injuries, broader neurosurgical capacity in emerging economies, and a decisive shift toward 3-dimensional patient-specific manufacturing. Hospitals remain the anchor customer base, yet specialty neurosurgery centers are scaling rapidly as payers reward high-outcome facilities. Titanium retains primacy because of decades of clinical proof, but polymeric alternatives such as PEEK gain traction as surgeons prioritize artifact-free imaging. Technology adoption also pivots: conventional machining still fills high-volume needs, yet 3-D printed solutions are winning complex cases because they reduce operative time and revision risk. Regionally, North America leads revenue, while Asia-Pacific generates the fastest growth on the back of infrastructure build-outs and regulatory modernization that shorten device-approval cycles.
Key Report Takeaways
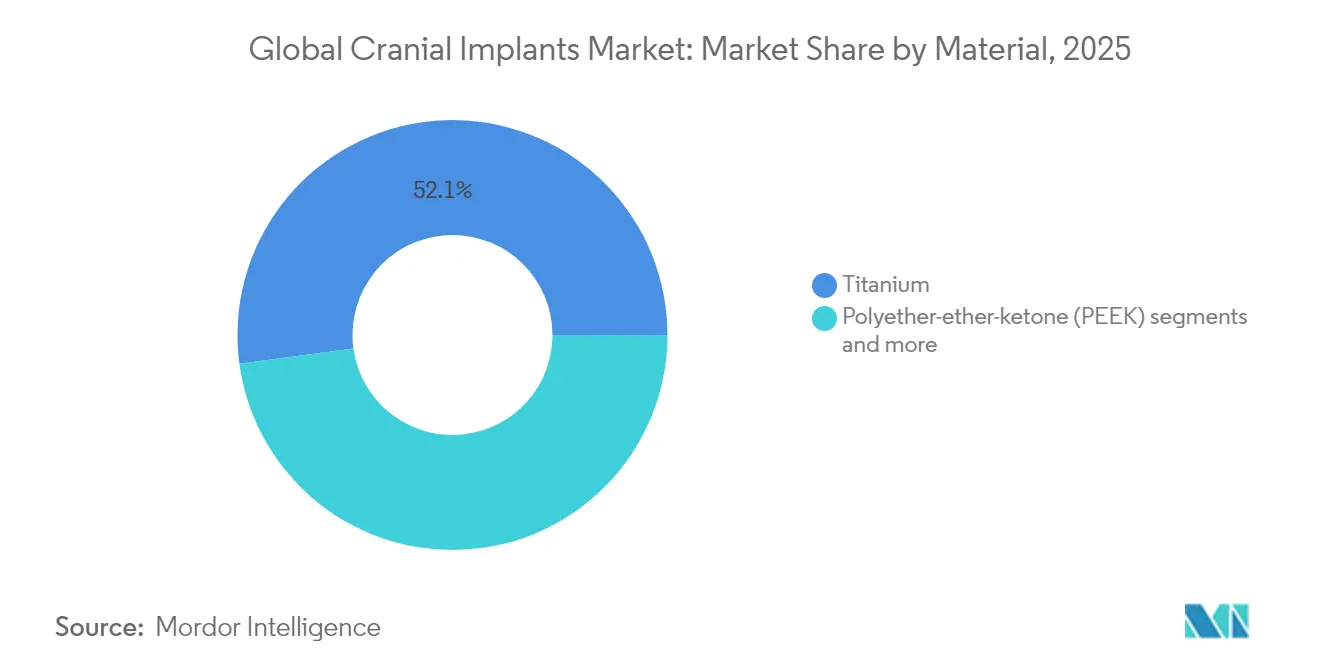
- By material, titanium accounted for 52.14% of cranial implants market share in 2025, while PEEK is on track for the fastest 7.02% CAGR through 2031.
- By technology, conventional machining held 48.05% of the cranial implants market size in 2025; 3-D printing is projected to expand at 7.62% CAGR to 2031.
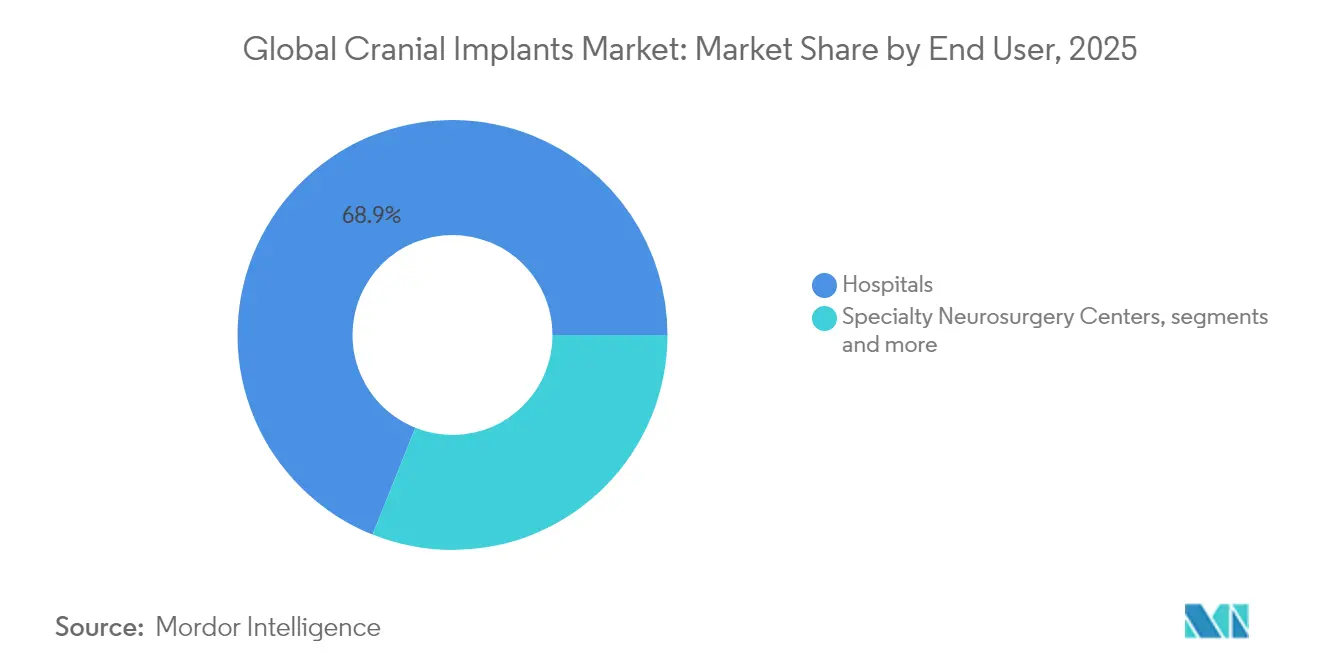
- By end user, hospitals commanded 68.94% of revenue in 2025, whereas specialty neurosurgery centers are advancing at an 7.88% CAGR through 2031.
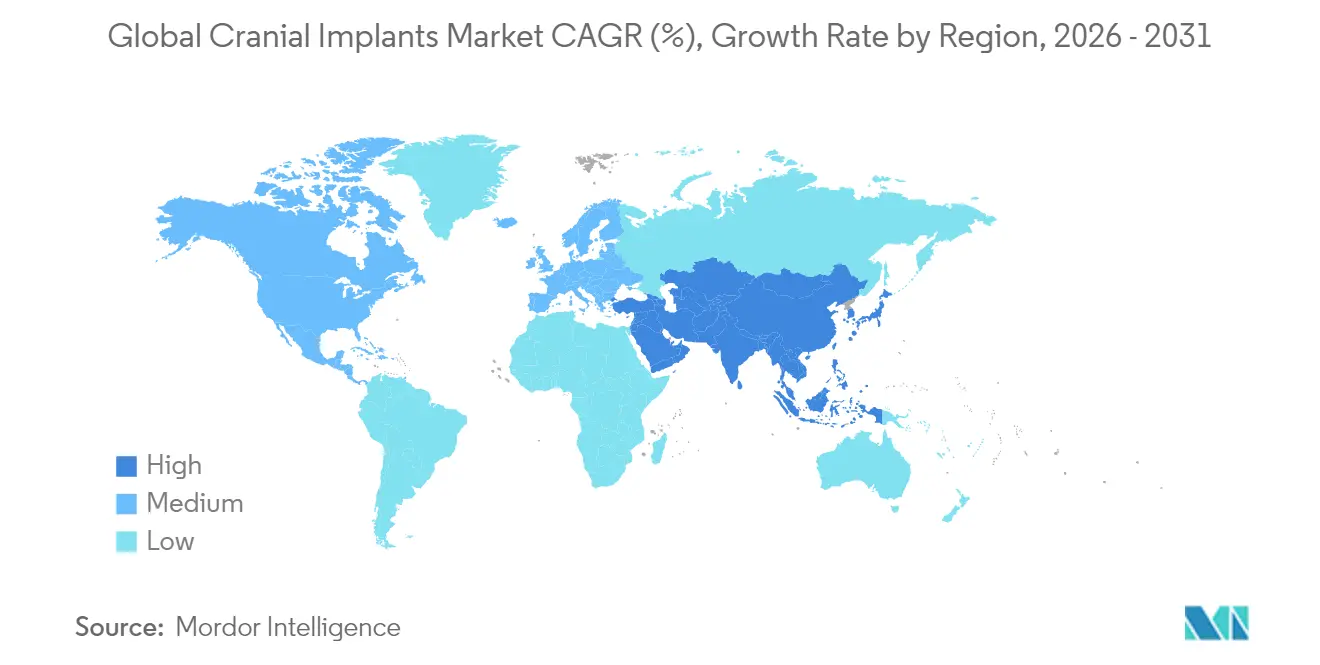
- By geography, North America generated 40.78% of 2025 sales; Asia-Pacific is forecast to record an 8.31% CAGR to 2031.
Note: Market size and forecast figures in this report are generated using Mordor Intelligence’s proprietary estimation framework, updated with the latest available data and insights as of 2026.
Market Trends and Insights
Drivers Impact Analysis of Global Cranial Implants Market*
| Driver | (~) % Impact on CAGR Forecast | Geographic Relevance | Impact Timeline |
|---|---|---|---|
| Rising incidence of cranial trauma & neurosurgical procedures | +1.8% | Global, with higher impact in North America & Europe | Medium term (2-4 years) |
| Advancements in 3-D printing for patient-specific implants | +1.5% | Global, early adoption in North America & Europe | Long term (≥ 4 years) |
| Superior clinical outcomes of titanium & PEEK implants | +1.2% | Global | Medium term (2-4 years) |
| Expanding neurosurgical infrastructure in emerging economies | +1.0% | APAC core, spill-over to MEA | Long term (≥ 4 years) |
| Augmented-reality assisted implant positioning | +0.7% | North America & EU, selective APAC markets | Medium term (2-4 years) |
| Military neuro-protection R&D boosting bioceramic adoption | +0.5% | North America & Europe, defense sector focus | Long term (≥ 4 years) |
| Source: Mordor Intelligence | |||
Rising Incidence of Cranial Trauma & Neurosurgical Procedures
Worldwide, roughly 69 million traumatic brain injuries occur each year, and severe cases often necessitate cranioplasty reconstruction. Aging populations, higher motor-vehicle density, and organized sports elevate the clinical burden. Defense research into neuro-protection further amplifies demand as military surgeons require dependable synthetic plates for battlefield injuries. At the hospital level, dedicated neuro-trauma centers consolidate complex cases, creating predictable procurement cycles for high-volume suppliers. Because trauma incidence is weakly correlated with economic cycles, the cranial implants market enjoys defensive-healthcare status that supports long-term planning by manufacturers and health systems alike.
Advancements in 3-D Printing for Patient-Specific Implants
Additive manufacturing transforms a one-size-fits-all procedure into tailored reconstruction. The 2024 FDA clearance of 3D Systems’ PEEK cranial plate proved the regulatory viability of polymeric additive implants. Surgeons now access cloud-based design tools that convert CT data into a ready-to-print file in minutes, trimming operating time and anesthesia exposure. Hospitals gain negotiating leverage with insurers by citing shorter length of stay and higher patient-satisfaction indices. Meanwhile, lattice infills and variable-thickness walls impossible in milling become routine, lowering weight and optimizing biomechanical stress paths. Suppliers that combine artificial intelligence with in-house printers are building widening competitive moats while legacy machine shops face commoditization risk.
Superior Clinical Outcomes of Titanium & PEEK Implants
Titanium plates achieve osseointegration rates above 95% within six months and remain the go-to solution for multi-fragment defects Journal of Neurosurgery. PEEK’s radiolucency allows artifact-free post-operative CT scans, helping clinicians track healing without interference. Both materials can receive hydroxyapatite coatings that cut recovery time from 12 weeks to 8 weeks in controlled trials, leading procurement boards to prioritize products with proven surface treatments. Patients also report less thermal sensitivity with PEEK, enhancing post-surgical quality-of-life scores that feed directly into value-based purchasing contracts.
Restraint Impact analysis of Global Cranial Implants Market*
| Restraint | (~) % Impact on CAGR Forecast | Geographic Relevance | Impact Timeline |
|---|---|---|---|
| High cost & limited reimbursement for customized implants | -0.8% | Global, acute in emerging markets | Short term (≤ 2 years) |
| Post-operative infection leading to implant removal | -0.5% | Global | Medium term (2-4 years) |
| Regulatory ambiguity for bio-resorbable scaffold materials | -0.4% | Global, regulatory uncertainty in EU & APAC | Medium term (2-4 years) |
| Supply-chain risk for medical-grade PEEK resin | -0.3% | Global, concentrated supplier base | Short term (≤ 2 years) |
| Source: Mordor Intelligence | |||
Expanding Neurosurgical Infrastructure in Emerging Economies
China’s healthcare reform earmarks USD 1.4 trillion through 2030 for new facilities, including trauma hubs in tier-2 cities National Health Commission of China. India’s National Medical Devices Policy targets 15% annual growth and encourages joint ventures for localized implant production Government of India[1]Source: Government of India, “National Medical Devices Policy 2025,” india.gov.in. As intraoperative imaging reaches community hospitals, surgeons adopt advanced cranioplasty techniques earlier in their careers. Gradual expansion of private health insurance in Southeast Asia further softens cost barriers, broadening the cranial implants market beyond major metropolitan centers.
High Cost & Limited Reimbursement for Customized Implants
United States Medicare reimburses USD 1,012.77 for CPT 62140, often less than one-quarter of a patient-specific PEEK implant’s list price. In France, a 25% reimbursement cut for orthopedic hardware effective 2025 exemplifies broader cost-containment efforts. The approval labyrinth for private-insurance pre-authorizations adds administrative friction that can delay surgeries. Emerging markets rely heavily on out-of-pocket spending, forcing surgeons to choose between autologous grafts and higher-priced synthetics. Payers increasingly demand real-world outcome data, favoring suppliers with large post-marketing registries over smaller niche entrants.
Post-Operative Infection Leading to Implant Removal
Surgical-site infection rates after cranioplasty vary between 2% and 15% and often necessitate complete hardware removal. Biofilm formation can defeat systemic antibiotics, raising interest in antimicrobial coatings, yet regulatory approval for such coatings is both time-consuming and costly. Financial repercussions include extended hospitalization, repeat imaging, and potential litigation, which heighten the caution of risk-averse hospital committees. Material differences matter: studies indicate lower bacterial adhesion on PEEK surfaces, subtly shifting surgeon preference toward polymer plates in high-risk cohorts.
*Our forecasts treat driver/restraint impacts as directional, not additive. The impact forecasts reflect baseline growth, mix effects, and variable interactions.
Global Cranial Implants Market Segment Analysis
By Material:
Titanium Dominance Faces PEEK Innovation ChallengeTitanium held 52.14% of cranial implants market share in 2025, underscoring its entrenched clinical acceptance. The segment benefits from abundant surgeon familiarity and favorable mechanical strength-to-weight ratios. PEEK, however, is the fastest-expanding material, advancing at a 7.02% CAGR as radiologists favor its imaging clarity. In revenue terms, PEEK’s portion of the cranial implants market size is forecast to widen steadily through 2031, propelled by FDA-cleared patient-specific solutions.
Hybrid constructs that embed titanium meshes inside PEEK shells mitigate stress shielding while preserving radiolucency, offering a middle path for surgeons wary of fully polymer implants. PMMA retains a niche in low-resource settings because of low unit cost, while resorbable polymers gather interest for pediatric cases where skull growth continues post-implantation. Advanced surface texturing and plasma coating technologies are improving bone ingrowth across all materials, potentially blurring performance gaps and intensifying competition within the cranial implants market.



By Technology:
3-D Printing Disrupts Conventional ManufacturingConventional machining generated 48.05% of 2025 revenue, yet 3-D printing is advancing at 7.62% CAGR, overtaking milled implants in high-complexity cases. Hospitals adopt end-to-end digital workflows that integrate imaging, virtual surgical planning, and additive production, compressing lead times from weeks to hours. As a result, patient-specific plates are increasingly indicated even in trauma settings where time previously favored stock implants.
Quality assurance remains a focal point: industrial computed tomography now inspects each lattice-filled plate for voids and residual powder. CAD/CAM milling continues to serve standardized geometries endowed with volume discounts. Nonetheless, artificial-intelligence algorithms embedded in design software automatically predict stress-hotspots, fine-tuning thickness only where needed. This optimization lowers material costs and appeals to payers looking for quantifiable value, reinforcing the tilt toward additive techniques within the cranial implants market.
By End User:
Specialty Centers Drive Market EvolutionHospitals controlled 68.94% of 2025 revenue owing to emergency-department captures and established neurosurgical units. Yet specialty neurosurgery centers, advancing at an 7.88% CAGR, are reshaping referral patterns through focused expertise and integrated imaging suites. Higher procedural volumes per surgeon sharpen learning curves and elevate outcome metrics, driving insurers to route elective cases to these facilities.
Ambulatory surgical centers gain traction for less complex cranioplasties, aided by minimally invasive techniques and improved anesthesia recovery. Point-of-care 3-D printing within these facilities cuts logistics overhead and supports just-in-time inventory philosophies. Partnership agreements between specialty centers and implant makers encompass clinical trials, generating post-marketing data that meet evolving reimbursement criteria. These dynamics collectively reinforce broader decentralization trends inside the cranial implants market.
Geography Analysis
North America Cranial Implants Market
North America generated 40.78% of 2025 revenue, anchored by Medicare coverage and an installed base of high-end imaging systems. Academic hubs such as Mayo Clinic and Johns Hopkins also function as innovation incubators, accelerating early adoption of augmented-reality navigation during cranioplasty procedures. Nevertheless, mounting payer pressure keeps list-price inflation in check, compelling suppliers to justify premium tariffs with demonstrable reductions in revision rates.
APAC Cranial Implants Market
Asia-Pacific is the fastest-growing region at an 8.31% CAGR, propelled by multibillion-dollar public-hospital buildouts in China and India. Streamlined device-approval pathways and incentives for local production shorten time to market for both multinationals and domestic entrants. Japan and South Korea lead surgical robotics penetration, fostering a virtuous cycle of precise implant fit and lower complication rates. Rising household incomes and broader private-insurance availability make elective cranioplasty more accessible, sustaining momentum in the cranial implants market.
EMEA Cranial Implants Market
Europe exhibits steady but slower growth as the Medical Device Regulation raises compliance costs. Germany and France spearhead evidence-based procurement, obliging sellers to produce longitudinal outcome data. Nordic countries, which have digitized health records extensively, adopt patient-specific implants quickly because their single-payer systems can evaluate real-world value at national scale. In the Middle East and Gulf states, medical-tourism programs underpin premium implant demand, while African markets remain nascent but benefit from international trauma-care initiatives. Collectively, these regional nuances demand tailored go-to-market strategies from companies active in the cranial implants market.

Regulatory Landscape
Cranial implants are regulated as medical devices in major markets, and the United States typically classifies cranioplasty plates as Class II devices under 21 CFR 882.5320 (preformed alterable) or 21 CFR 882.5330 (preformed nonalterable), commonly using the 510(k) pathway for clearance of both standard and patient-specific designs. For US manufacturers, a notable compliance change is the Quality Management System Regulation (QMSR), effective February 2, 2026, which aligns FDA quality-system expectations more closely with ISO 13485 and increases the importance of end-to-end design control, supplier qualification, and traceability across digital workflows used for personalized implants.
In Europe, cranial implants fall under the EU Medical Device Regulation (Regulation (EU) 2017/745), where notified-body oversight and technical documentation depth affect time to market, particularly for patient-specific manufacturing and any coating or material innovations. In January 2026, the European Commission issued Implementing Decision (EU) 2026/193 updating harmonized standards relevant to neurosurgical implants, reinforcing use of current EN ISO standards. Globally, ISO 14630:2024 serves as a baseline standard for non-active surgical implants and anchors expectations around intended performance, materials, and sterilization. Across both regions, regulatory scrutiny around novel or bioresorbable scaffold materials keeps evidence requirements higher than for established titanium and PEEK constructs, which in turn influences portfolio prioritization toward platforms with clearer regulatory precedent.
Value Chain Analysis
The cranial implants value chain runs through imaging and case intake (CT acquisition and secure DICOM transfer), virtual surgical planning and design (often AI-assisted), material sourcing and certified processing inputs (medical-grade titanium and specialized polymers such as PEEK), manufacturing (conventional machining/CAD-CAM milling for standard geometries and additive manufacturing such as laser powder bed fusion for titanium or polymer printing routes for customized plates), and post-processing and release (support removal, finishing, cleaning, validation, sterilization, and documentation for traceability). Distribution typically routes through direct sales into hospitals and specialty neurosurgery centers, with logistics and service-level agreements focused on lead-time reliability and the ability to deliver sterile, patient-matched implants.
Patient-specific workflows increase interdependencies across software, manufacturing, and regulatory documentation, pushing suppliers toward tighter integration with planning platforms and partner manufacturing networks. One example of this integration is Materialise adding PEEK implants to its cranio-maxillofacial portfolio via partner manufacturing, with a stated 72-hour turnaround after surgical plan approval, highlighting how service speed can differentiate facilities seeking shorter scheduling windows. On the materials side, exclusive and long-term licensing arrangements (for example, Kelyniam Global securing an exclusive US license from Evonik for a bi-calcium phosphate-infused PEEK material) show how companies de-risk resin availability and differentiate performance claims. Meanwhile, FDA 510(k) clearances for patient-specific titanium mesh and plate systems support a repeatable commercialization model that links design, manufacturing, and quality-system readiness into a single competitive capability.
Competitive Landscape
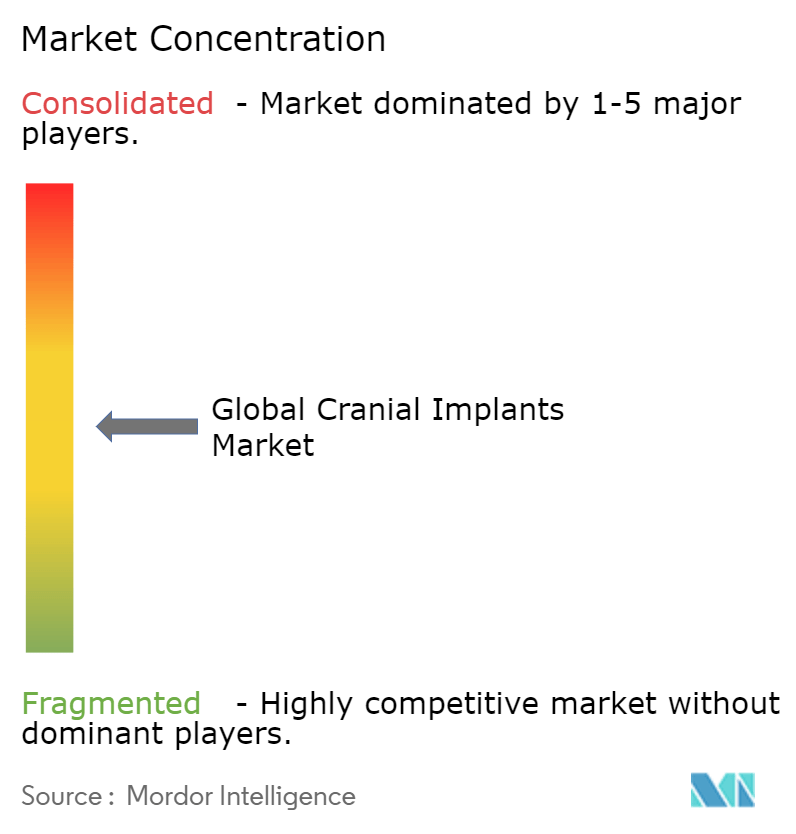
The competitive arena shows moderate concentration. Stryker, Zimmer Biomet, and DePuy Synthes command leading shares through broad neurosurgical ecosystems. Stryker’s USD 4.9 billion acquisition of Inari Medical in January 2025 deepened its neuro-vascular toolbox and introduced cross-selling avenues for cranial plates[2]Source: Stryker Corporation, “Stryker Completes Acquisition of Inari Medical,” stryker.com. Zimmer Biomet’s 2024 purchase of Paragon 28 injected additive know-how that can migrate into cranioplasty workflows.
Specialist firms such as OssDsign and Xilloc design only patient-specific implants, differentiating on biomimetic ceramics and flexible service models. Renishaw invested GBP 50 million in 2024 to expand additive capacity and pilot augmented-reality navigation modules. Digital prowess is now a gating asset: suppliers that bundle scanning, planning, and printing software create sticky value propositions. Pediatric solutions and antimicrobial-coated plates remain white-space areas where smaller innovators could leapfrog incumbents. Meanwhile, impending patent expirations on standard titanium geometries invite low-cost entrants, accelerating commoditization in the lower tier of the cranial implants market.
Global Cranial Implants Industry Leaders
Stryker Corporation
Zimmer Biomet
KLS Martin Group
B. Braun SE
Johnson & Johnson Services Inc.
- *Disclaimer: Major Players sorted in no particular order
Global Cranial Implants Market Companies Covered in this Report
- Stryker
- Zimmer Biomet
- Johnson & Johnson
- Integra LifeSciences Holdings
- Medtronic
- KLS Martin Group
- Xilloc Medical B.V.
- OssDsign AB
- Renishaw plc
- B. Braun (Aesculap)
- Anatomics
- Tecomet Inc.
- Synimed
- OsteoMed (An Acumed Company)
- Evonik Industries
- CranioTech Inc.
- ADEOR medical AG

Market Opportunities and Future Outlook
Opportunities cluster around accelerating the shift from stock plates to patient-specific implants supported by faster, more standardized digital workflows. Multiple US FDA 510(k) clearances across 2025 for patient-specific titanium and PEEK cranial implant systems indicate active product refresh cycles and broaden clinician access to additively manufactured, CT-derived designs under established Class II classifications (21 CFR 882.5320 and 882.5330). This clearance cadence aligns with hospital procurement priorities that focus on reduced intraoperative modification and more predictable operating time, while also strengthening the business case for vendors that bundle planning software, manufacturing, and documentation into a single service line.
A second whitespace area is point-of-care (POC) and near-site manufacturing that compresses turnaround and reduces supply-chain friction for urgent cranioplasty cases. Peer-reviewed 2026 work describing EU MDR Article 5(5)-compliant hospital-based production frameworks for 3D-printed PEEK implants reports 3 to 5 day pathways from image acquisition to sterile delivery, suggesting practical routes for hospitals to build internal capability or contract for dedicated local capacity. Materials innovation also supports differentiation beyond conventional titanium and standard PEEK: 2026 research validating functionalized PEEK composites (for example, carbon fiber-reinforced and barium sulfate-filled variants) points to product strategies that combine mechanical tailoring, radiographic visibility, and bioactivity, supporting premium positioning when backed by reproducible manufacturing and quality controls.
Recent Industry Developments in Global Cranial Implants Market
- February 2026: KLS Martin Group announced plans to raise its 2026 investment volume to a three-digit million-euro level for infrastructure, production, and development following record 2025 sales of EUR 518 million. The step-up in spending signals added manufacturing and development capacity that can support higher throughput for patient-specific cranial implant workflows and related digital planning services.
- November 2025: KLS Martin received FDA 510(k) clearance (K252573) for MR-Conditional cranial implants under product code GXN (21 CFR 882.5330). The clearance expands its US-ready offering in a compliance-sensitive category where MR labeling and standardized documentation can influence hospital adoption and tender participation.
- December 2024: 3D Systems obtained FDA clearance for patient-specific PEEK cranial plates manufactured using additive processes. The regulatory milestone validated polymer additive cranioplasty pathways and increased competitive pressure on traditional machining routes for complex, customized reconstructions.


Global Cranial Implants Market Report Scope and Research Methodology
Market Definition and Coverage
This market covers implantable devices used to repair and reconstruct skull defects in cranioplasty, including patient-specific and standard options supplied to hospitals and neurosurgery settings.
Scope exclusions: We exclude non-implant consumables and general neurosurgical tools that are not left inside the patient after surgery.
Segments Covered in This Report
- By Material (Value, USD Million)
- Titanium
- Polyether-ether-ketone (PEEK)
- Polymethyl-methacrylate (PMMA)
- Hydroxy-apatite
- Other Materials
- By Technology (Value, USD Million)
- 3-D Printed Implants
- CAD/CAM-Milled Implants
- Conventional Machined Implants
- By End User (Value, USD Million)
- Hospitals
- Specialty Neurosurgery Centers
- Ambulatory Surgical Centers
- By Geography (Value, USD Million)
- North America
- United States
- Canada
- Mexico
- Europe
- Germany
- United Kingdom
- France
- Italy
- Spain
- Rest of Europe
- Asia-Pacific
- China
- India
- Japan
- South Korea
- Australia
- Rest of Asia-Pacific
- South America
- Brazil
- Argentina
- Rest of South America
- Middle East and Africa
- GCC
- South Africa
- Rest of Middle East and Africa
- North America
Data Sources, Market Sizing, and Validation
Desk Research
Desk research was used to build a clean fact base on procedure demand, material adoption, and how cranial reconstruction volumes move by region over time. We relied on public sources such as the World Health Organization, Centers for Disease Control and Prevention, and the World Bank for injury and population indicators, and we also referred to sources like the US FDA device database and peer-reviewed clinical journals to understand implant types and how they are used.
To keep assumptions realistic, we supplemented this with supplier disclosures such as annual reports, regulatory clearances, investor presentations, and hospital or association websites that describe treatment pathways and purchasing patterns. In a few places, paid subscriptions were used for company financials and intelligence, patent lookups, and selective news and financial tracking, mainly to confirm launches and capacity signals. The desk sources listed here are illustrative only, and many other public references were reviewed for collection, cross-checking, and clarification.
Primary Interviews and Surveys
Primary work focused on validating the real-world split between customized and non-customized implants, typical pricing movements by material, and adoption of 3-D printed and CAD/CAM-milled solutions. We spoke with manufacturers, distributors, surgeons, and procurement-focused roles across APAC, EMEA, and the Americas so gaps in desk inputs could be closed and assumptions could be checked before finalizing the model.
Distribution of primary research fieldwork respondents
| Company type | Respondent position | Region |
|---|---|---|
| Top tier: 32% | CXOs: 14% | APAC: 43% |
| Mid tier: 46% | Functional/Unit leaders: 33% | EMEA: 32% |
| Smaller Players: 22% | Managers: 53% | Americas: 25% |
Market-Sizing & Forecasting
Sizing starts with a top-down build where injury and neurosurgery caseload indicators are translated into a cranioplasty demand pool, which is then filtered by implant usage rates and the mix across materials and manufacturing approaches. To keep the totals grounded, results are corroborated with selective bottom-up approximations, such as sampled average selling prices by material (for example, titanium versus polymer), channel discussions on typical order values, and a limited supplier roll-up to sanity-check regional shares.
Key inputs that shape the model include reported traumatic brain injury and accident trends, neurosurgery access indicators, procedure intensity by region, the customized versus non-customized share, and the observed shift toward 3-D printed or CAD/CAM-milled implants where lead times and fit drive preference. Forecasts are developed using scenario analysis, since policy changes, hospital budget cycles, and technology substitution can shift uptake faster than a single trend line would imply. Where direct bottom-up coverage is incomplete, gaps are handled by applying conservative penetration ranges, then revisited during primary validation before the forecast is locked.
Data Validation & Update Cycle
Model outputs are checked against independent signals like implied procedure volumes, regional healthcare spend direction, and pricing bands discussed during interviews so outliers can be spotted early. When a variance shows up, assumptions are traced back to the input that caused it, then adjusted only after a second review and, when needed, a follow-up call with a domain respondent.
The report is refreshed annually, with interim updates when material events occur, such as major regulatory actions, supply disruptions, or step-changes in adoption of patient-specific manufacturing. Before delivery, an analyst performs a final pass to ensure the latest public updates and validated assumptions are reflected in the numbers clients receive.
Mordor Intelligence's Cranial Implants Market Sizing Compared With Other Published Estimates
Published market sizes for cranial implants often do not match because the scope can shift in small but meaningful ways, and because pricing and adoption assumptions are refreshed at different times. Differences also show up when firms pick different base years, use dissimilar currency timing, or treat customized implants as a premium category in separate ways.
The main gap comes from whether adjacent cranial fixation systems and broader craniofacial implant revenues are blended into the same pool, where Mordor Intelligence counts only implant devices used in cranioplasty and then models the mix by customized versus non-customized, material, and manufacturing approach (including 3-D printing and CAD/CAM) with country-level checks. Another driver is how ASPs are progressed, since some estimates apply a single inflation factor, while others use a wider premium spread for patient-specific implants without validating it with surgeon and channel feedback.
Benchmark comparison
| Source | Market Size | Gaps in Research Methodology |
|---|---|---|
| Mordor Intelligence | USD 1.49 B (2026) | |
| Global Research Publisher A | USD 1.43 B (2024) | Uses a 2024 base year and a shorter forecast window, and the public summary does not clarify how customized implant premiums and technology mix (3-D printed vs milled vs conventional) are applied in pricing. |
| Research Platform B | USD 1.06 B (2024) | Reports a lower 2024 base that may reflect a narrower counted device set and fewer explicit checks on procedure-linked demand signals, which can understate markets where patient-specific implants are gaining share. |
The spread in values is mainly explained by scope choices and how price progression is handled for patient-specific solutions, followed by base-year timing differences. By tying revenue to procedure-linked demand, applying clear mix assumptions, and re-checking outliers through primary feedback, we keep the estimate traceable to inputs that a reader can follow and revisit.


Key Questions Answered in the Report
What forces are driving the fastest growth in the cranial implants market?
Rising traumatic brain injuries, expanding neurosurgical capacity in Asia-Pacific, and rapid adoption of 3-D printed patient-specific plates are the primary accelerants, supporting an 8.31% regional CAGR through 2031.
How do reimbursement policies influence adoption of customized implants?
Coverage gaps remain pronounced: U.S. Medicare’s USD 1,012.77 payment for cranioplasty falls well below the price of a custom PEEK plate, and France cut orthopedic hardware reimbursement by 25% in 2025, forcing hospitals to scrutinize cost-to-outcome ratios.
Which materials offer the best clinical performance today?
Titanium retains the widest clinical data set with osseointegration above 95%, while PEEK grows swiftly because of radiolucency and patient comfort advantages; hybrid constructs leverage strengths of both substrates.
What technological trend most disrupts incumbent manufacturing?
Additive manufacturing leads the shift, with 3-D printed implants expanding at 7.62% CAGR; AI-driven design optimization and point-of-care printers reduce lead times and enable complex geometries that boost bone integration.
Page last updated on:


 Your data is secure and never sold or shared.


