Bio-Implants Market Size and Share
Market Overview
| Study Period | 2022 - 2031 |
|---|---|
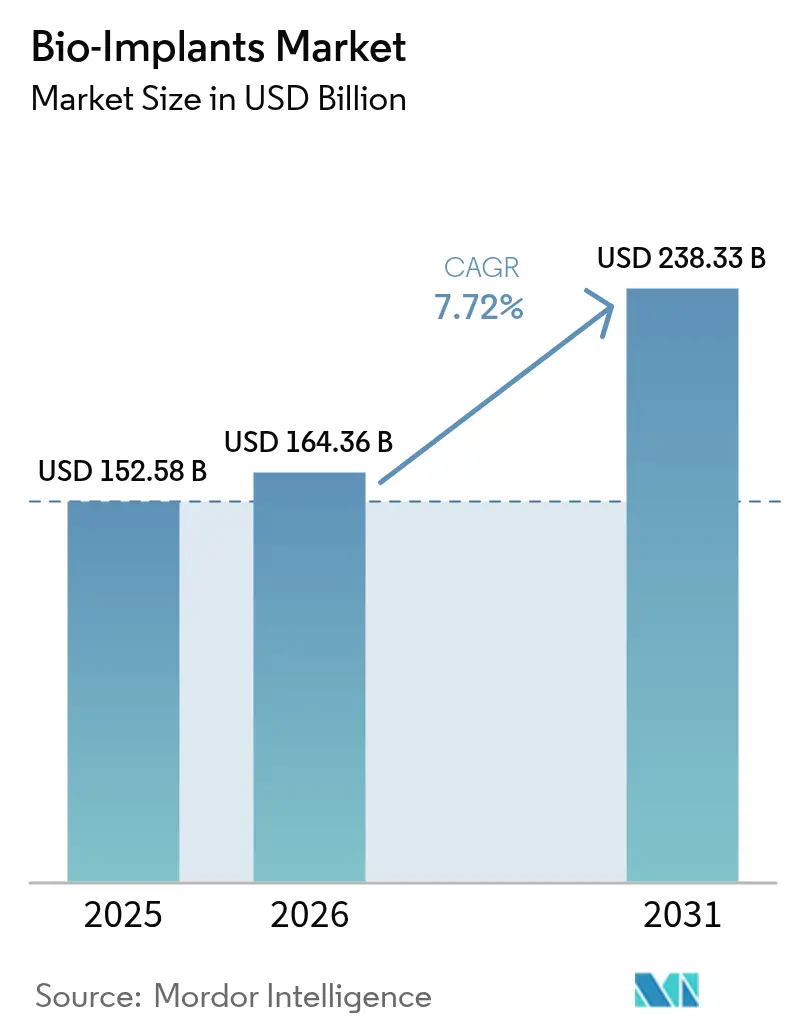
| Market Size (2026) | USD 164.36 Billion |
| Market Size (2031) | USD 238.33 Billion |
| Growth Rate (2026 - 2031) | 7.72% CAGR |
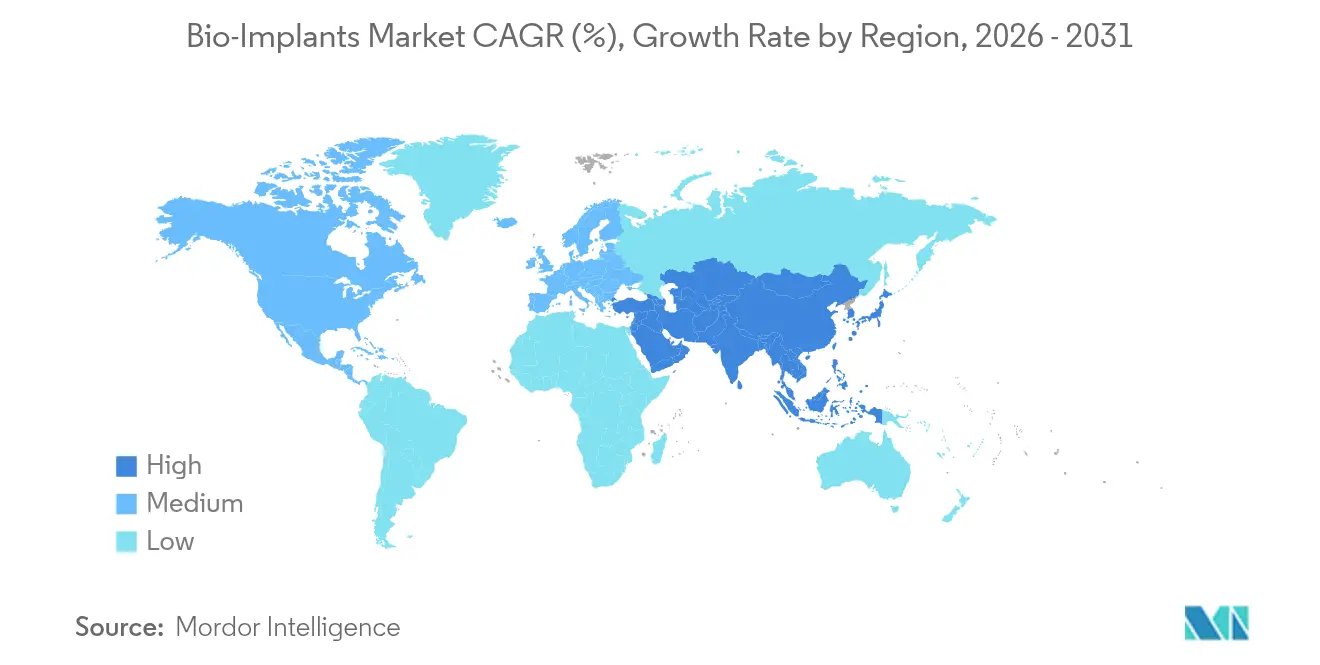
| Fastest Growing Market | Asia Pacific |
| Largest Market | North America |
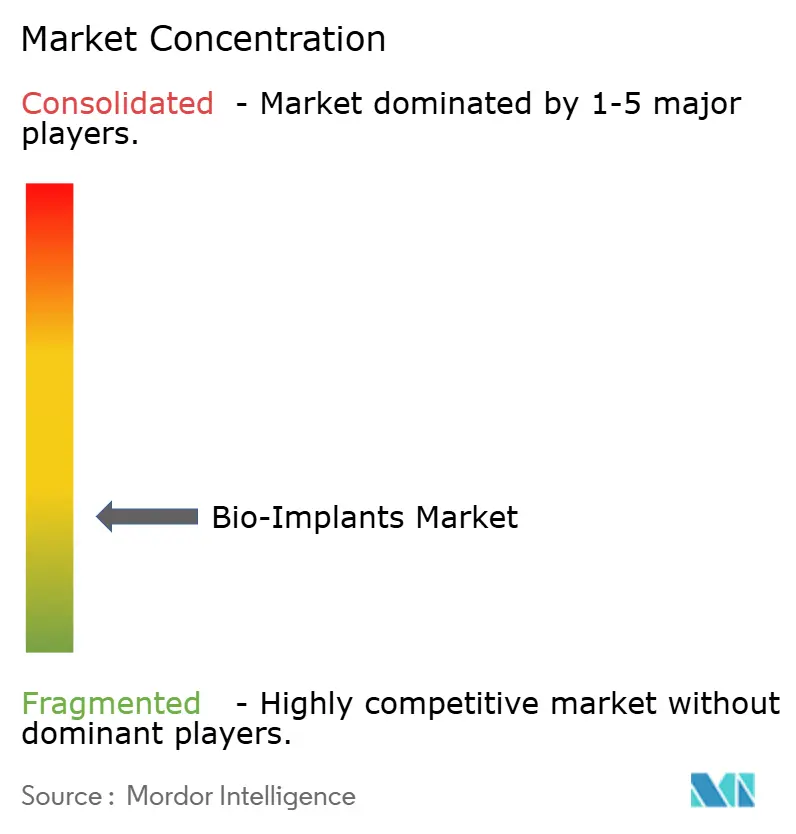
| Market Concentration | Low |
Major Players *Disclaimer: Major Players sorted in no particular order Image © Mordor Intelligence. Reuse requires attribution under CC BY 4.0. | |
Bio-Implants Market Analysis by Mordor Intelligence
The global bio-implants market size is expected to grow from USD 152.58 billion in 2025 to USD 164.36 billion in 2026 and is forecast to reach USD 238.33 billion by 2031 at 7.72% CAGR over 2026-2031. Rapid uptake is driven by population aging, surging chronic-disease prevalence, and the routine use of sensor-enabled devices that transmit real-time clinical data to care teams. Demand is reinforced by 3-D-printed patient-specific constructs that shorten theatre time and enhance post-operative outcomes, while bioresorbable materials eliminate follow-up extraction surgeries. Health-system moves toward value-based reimbursement are accelerating adoption in emerging economies where providers focus on total-episode cost rather than device price alone. Competitive intensity is rising as major suppliers acquire niche innovators to assemble complete musculoskeletal and cardiovascular portfolios.
Key Report Takeaways
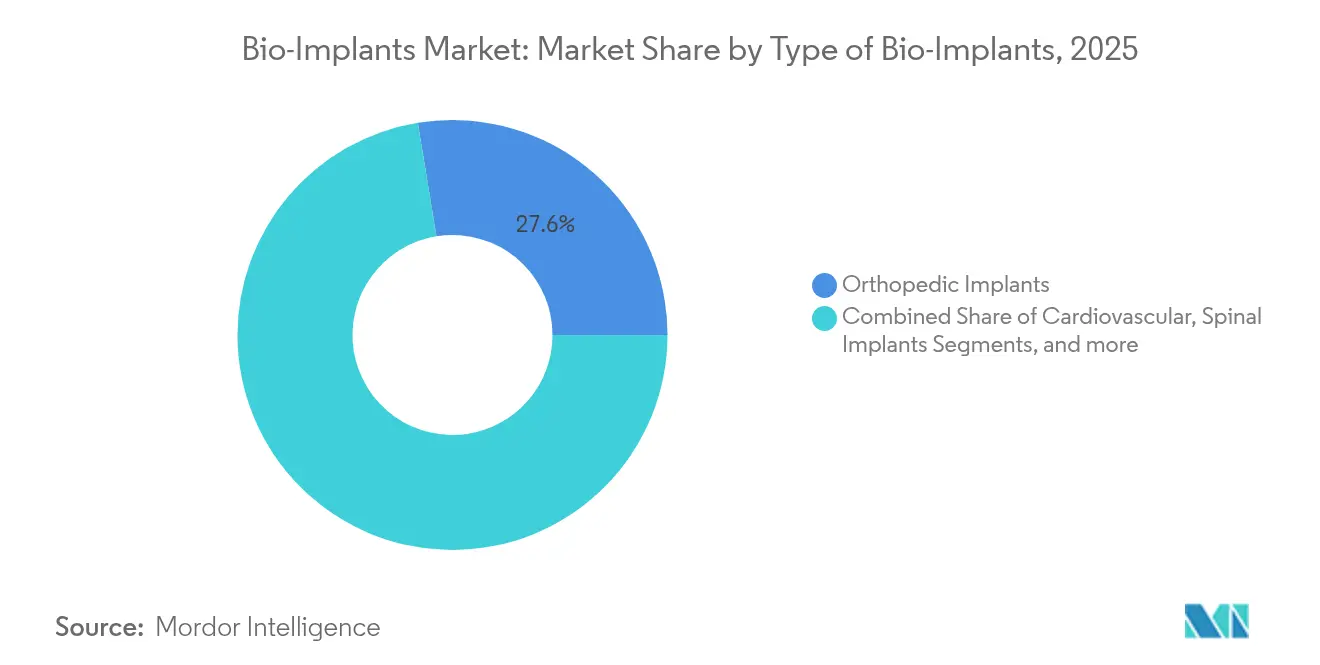
- By type, orthopedic implants led with 27.58% of the bio-implants market share in 2025; cardiovascular implants are projected to expand at an 8.23% CAGR through 2031.
- By material, metals and alloys accounted for 43.72% share of the bio-implants market size in 2025, while composite and hybrid biomaterials are forecast to grow at an 8.12% CAGR to 2031.
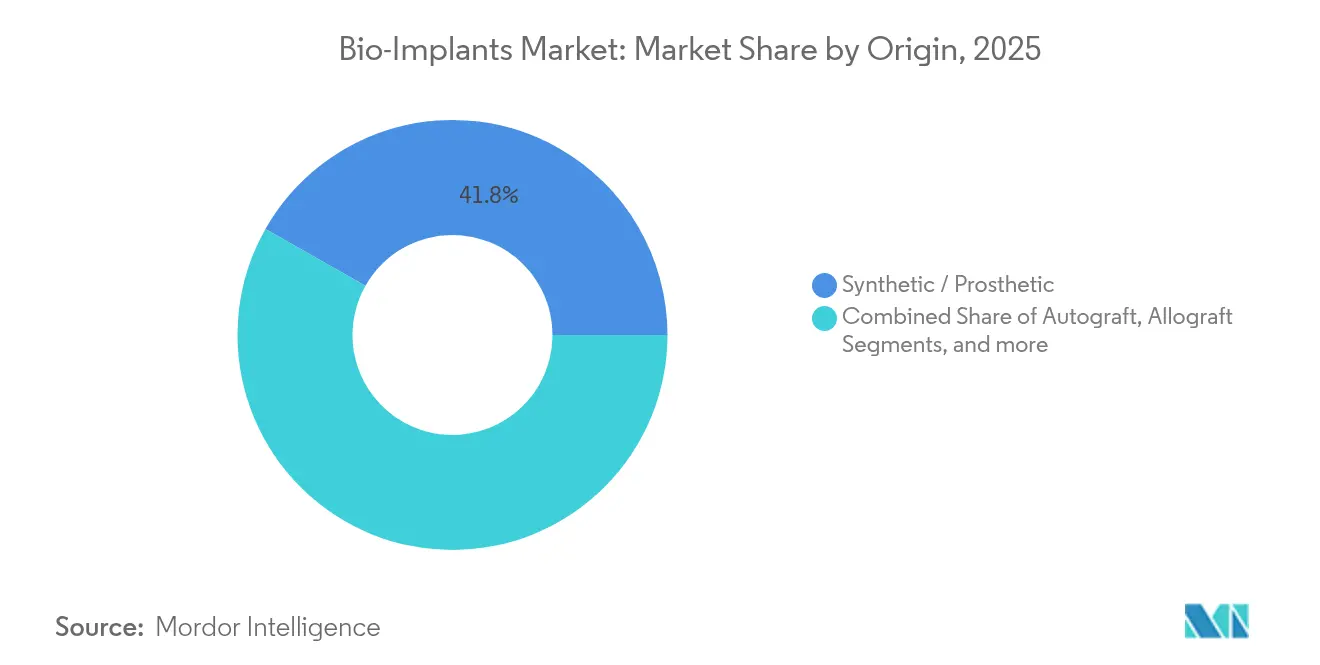
- By origin, synthetic implants held 41.80% of the bio-implants market size in 2025; xenograft materials are the fastest-advancing segment at an 8.28% CAGR.
- By end user, hospitals dominated with 53.66% of the bio-implants market share in 2025; specialty clinics are accelerating at an 8.19% CAGR through 2031.
- By geography, North America commanded 48.12% revenue in 2025, whereas Asia-Pacific is set to record an 8.11% CAGR to 2031.
Note: Market size and forecast figures in this report are generated using Mordor Intelligence’s proprietary estimation framework, updated with the latest available data and insights as of 2026.
Global Bio-Implants Market Trends and Insights
Drivers Impact Analysis*
| Driver | (~) % Impact on CAGR Forecast | Geographic Relevance | Impact Timeline |
|---|---|---|---|
| Rising burden of chronic & lifestyle diseases | +1.8% | Global, concentrated in North America & Europe | Long term (≥ 4 years) |
| Growing preference for minimally-invasive surgeries | +1.2% | North America and EU; spreading to Asia-Pacific | Medium term (2-4 years) |
| Aging population accelerating joint-replacement volumes | +1.5% | Global, led by North America, Europe, Japan | Long term (≥ 4 years) |
| Surge in 3-D-printed, patient-specific implants | +0.9% | North America & EU core; adoption rising in Asia-Pacific | Medium term (2-4 years) |
| Commercialization of bioresorbable & smart sensor-enabled implants | +1.1% | Early uptake in developed markets, spreading globally | Medium term (2-4 years) |
| Value-based-care bundles boosting implant uptake in emerging markets | +0.7% | Asia-Pacific, Latin America, Middle East & Africa | Short term (≤ 2 years) |
| Source: Mordor Intelligence | |||
Rising Burden of Chronic & Lifestyle Diseases
Diabetes, cardiovascular disease, and musculoskeletal disorders are reshaping demand patterns. Genentech’s Susvimo received United States Food and Drug Administration (FDA) approval in 2025 as the first continuous ocular drug-delivery implant needing only twice-yearly refills, underscoring how multifunctional devices now address chronic pathologies with fewer interventions. Healthcare systems in high-income countries are pivoting toward proactive management, favoring long-lasting implants that reduce rehospitalization.
Growing Preference for Minimally-Invasive Surgeries
Ambulatory surgery centers performed 44 million procedures in 2024 and will keep expanding as payers reimburse outpatient joint replacements. Implant manufacturers respond by creating devices optimized for shorter operative windows and same-day discharge protocols, increasing the addressable bio-implants market well beyond traditional hospital theatres.
Aging Population Accelerating Joint-Replacement Volumes
The global 65+ cohort is on track to double by 2050, and younger recipients now expect implants to survive 30+ years. Firms such as Zimmer Biomet are investing in wear-resistant surfaces that limit osteolysis and extend functional life. Patient-specific designs that map nuanced anatomical variations are gaining traction as longevity and fit become central purchase criteria.
Surge in 3-D-Printed, Patient-Specific Implants
Regulators have cleared restor3d’s total talus prosthesis, illustrating a clear pathway for additively manufactured patient-matched devices. Hospitals are installing point-of-care printers to shorten lead times and control inventory, a shift that broadens access and reduces waste. Lattice structures promoting bone ingrowth further enhance long-term fixation.
Restraints Impact Analysis*
| Restraint | (~) % Impact on CAGR Forecast | Geographic Relevance | Impact Timeline |
|---|---|---|---|
| Unfavorable / fragmented reimbursement pathways | -1.2% | Worldwide, with larger drag in emerging markets | Long term (≥ 4 years) |
| High upfront cost of advanced implants | -0.8% | Global, most acute in price-sensitive regions | Medium term (2-4 years) |
| Supply-chain vulnerability for specialty biomaterials | -0.6% | Global | Medium term (2-4 years) |
| ESG & lifecycle-impact scrutiny delaying approvals | -0.5% | Global, affected more in developed regions | Medium term (2-4 years) |
| Source: Mordor Intelligence | |||
High Upfront Cost of Advanced Implants
Premium sensor-based devices remain expensive, making payers hesitate in regions where capital budgets are constrained. Suppliers are developing tiered portfolios so health systems can match functionality to economic reality without halting innovation.
Unfavorable / Fragmented Reimbursement Pathways
Regulators often approve technology years before reimbursement schedules adapt. Medicare’s 2025 draft guidance on clinical endpoints for knee osteoarthritis reflects ongoing attempts to align evidence standards, yet global inconsistency still delays commercialization.
*Our forecasts treat driver/restraint impacts as directional, not additive. The impact forecasts reflect baseline growth, mix effects, and variable interactions.
Segment Analysis
By Type of Bio-Implants: Cardiovascular Innovation Drives Growth
Orthopedic devices represented the single-largest revenue block in 2025, contributing 27.58% of the bio-implants market share. Cardiovascular implants, however, deliver the highest momentum with an 8.23% CAGR, powered by transcatheter valves and implantable hemodynamic sensors. The segment benefits from FDA breakthrough-device designations such as BiVACOR’s total artificial heart that target end-stage failure. Over the forecast horizon, smart pacemakers integrated with remote telemetry will further enlarge the cardiovascular footprint within the bio-implants market.
Orthopedic innovation stays robust through robotic guidance and improved tribology that extends bearing life. Neuro-stimulators leverage adaptive algorithms to recalibrate in response to patient feedback, while cochlear implants inch toward fully implantable form factors; the category is projected to reach USD 986.4 million by 2031. Ophthalmic platforms like Susvimo re-shape treatment frequency expectations, reinforcing steady demand across all implant lines.


By Material: Composite Innovation Challenges Metal Dominance
Metals and alloys accounted for 43.72% of 2025 revenue thanks to titanium’s unmatched strength-to-weight ratio, but composites will grow the fastest at 8.12% as polyether-ether-ketone (PEEK) and polylactic acid (PLA) variants mitigate stress shielding. Ceramics doped with antimicrobial silver ions diminish infection risk, and bio-active glass matrices encourage osteogenesis without inflammatory cascade. Gradient builds that shift from rigid cores to compliant outer zones imitate natural tissue and broaden indications for soft-tissue repair.
By Origin: Synthetic Dominance with Xenograft Acceleration
Synthetic constructs maintained a 41.80% revenue lead in 2025, valued for consistency and unlimited supply. Xenografts register the swiftest advance at 8.28% CAGR as decellularization protocols strip immunogenic proteins yet retain osteoinductive cues; dentin-derived xenograft powder now supports maxillofacial reconstruction. Allografts remain essential in complex spine fusion where autograft harvest volume is limited. Surgeons increasingly deploy hybrid grafting approaches that pair allograft carriers with bio-active xenograft fillers, improving volumetric stability.
By End User: Specialty Clinics Emerge as Growth Leaders
Hospitals retained 53.66% of 2025 sales as complex cardiac and neuro cases still require intensive settings. The specialty-clinic channel, however, is expanding at an 8.19% CAGR, buoyed by payer approval for outpatient shoulder and knee arthroplasty. Becker’s ASC Review notes that robotics and navigation now migrate to ambulatory theatres, enabling same-day discharge without compromising outcomes. Focused implant centers that bundle surgical and rehabilitation services deliver predictable pathways attractive to value-based purchasers.
Geography Analysis
North America held 48.12% of global revenue in 2025 as reimbursement parity and advanced R&D ecosystems speed adoption of closed-loop neuro-stimulators like Medtronic’s BrainSense platform, cleared by the FDA in 2025. Cross-border patient flows from Canada and Mexico further support procedure growth while diversified payer mixes stabilize price realization.
Asia-Pacific is the fastest-moving bio-implants market at an 8.11% CAGR. China supports domestic manufacturing, India aligns its regulatory code with international standards, and Japan’s super-aged society prioritizes joint and cardiac devices. Digital health infrastructure in South Korea accelerates remote monitoring uptake, and Australian research hubs host pivotal trials that de-risk regional launches.
Europe wrestles with Medical Device Regulation (MDR) certification bottlenecks—only 43 notified bodies oversee half-a-million devices—slowing market entry. Transition extensions to 2027 grant limited reprieve, yet firms must still meet stringent environmental requirements incorporated into new procurement criteria. Sustainability-minded hospitals increasingly request lifecycle analyses and recyclable packaging as part of tender bids.

Competitive Landscape
The bio-implants market is moderately consolidated. Johnson & Johnson’s DePuy Synthes portfolio covers orthopedics, trauma, and sports medicine, delivering an estimated 13% revenue share in 2024. Medtronic adds 4.86% with leadership in cardiovascular and neuromodulation. Strategic acquisitions illustrate a push toward full-line musculoskeletal offerings, exemplified by Enovis closing a EUR 800 million purchase of LimaCorporate to access patient-matched shoulder implants[3]Enovis Corporation, “Completion of LimaCorporate Acquisition,” enovis.com. Globus Medical’s USD 250 million takeover of Nevro extends its spine footprint into pain neuromodulation.
Digital differentiation is rising. Major vendors embed AI-driven planning software that pairs with sensor-laden hardware, creating data ecosystems difficult for smaller rivals to match. Academic-industry partnerships are accelerating intellectual-property creation in adaptive neuro-stimulators, and university spin-outs supply specialized algorithms that optimize closed-loop control. Sustainability positions compound competitive advantage as hospitals add environmental metrics to scorecards.
Bio-Implants Industry Leaders
ZimmerBiomet
Smith & Nephew Plc
Edwards
BioTronik Plc
aap Implantate AG
- *Disclaimer: Major Players sorted in no particular order

Recent Industry Developments
- May 2025: Genentech secured FDA approval for Susvimo (ranibizumab) refillable ocular implant for diabetic retinopathy, reducing injection frequency from monthly to twice yearly.
- April 2025: Epiminder’s Minder EEG implant received De Novo clearance as the first continuous implantable monitor for drug-resistant epilepsy, with U.S. launch scheduled for late 2025 .
- March 2025: Vivani Medical announced plans to spin off Cortigent, its neurostimulation unit for blindness and paralysis, creating two focused entities to unlock shareholder value.
- February 2025: Medtronic gained FDA approval for the BrainSense Adaptive deep brain stimulation system, marking the largest commercial release of closed-loop neuromodulation technology.


Global Bio-Implants Market Report Scope
As per the scope of the report, a bio-implant is a prosthesis that is used to normalize physiological functions. It is made of biosynthetic materials, like collagen, and tissue-engineered products, like artificial skin and tissues. Some of the bioimplants are made up of polymers or biopolymers as well. The Bio-implants Market is segmented by Type of Bio-implants (Cardiovascular Implants, Spinal Implants, Orthopedic Implants, Dental Implants, Ophthalmic Implants, and Other Implants), Material (Biomaterial Metal and Alloys, Polymers, and Other Materials), and Geography (North America, Europe, Asia-Pacific, Middle East and Africa, and South America). The market report also covers the estimated market sizes and trends for 17 different countries across major regions globally. The report offers the value (in USD million) for the above segments.
| Cardiovascular Implants |
| Orthopedic Implants |
| Spinal Implants |
| Dental Implants |
| Ophthalmic Implants |
| Neurological & Cochlear Implants |
| Other Implants |
| Metals & Alloys |
| Polymers |
| Ceramics & Bio-active Glass |
| Composite & Hybrid Biomaterials |
| Other Materials |
| Autograft |
| Allograft |
| Xenograft |
| Synthetic / Prosthetic |
| Hospitals |
| Ambulatory Surgical Centers |
| Specialty Clinics |
| North America | United States |
| Canada | |
| Mexico | |
| Europe | Germany |
| United Kingdom | |
| France | |
| Italy | |
| Spain | |
| Rest of Europe | |
| Asia-pacific | China |
| Japan | |
| India | |
| Australia | |
| South Korea | |
| Rest of Asia-pacific | |
| Middle East and Africa | GCC |
| South Africa | |
| Rest of Middle East and Africa | |
| South America | Brazil |
| Argentina | |
| Rest of South America |
| By Type of Bio-Implants | Cardiovascular Implants | |
| Orthopedic Implants | ||
| Spinal Implants | ||
| Dental Implants | ||
| Ophthalmic Implants | ||
| Neurological & Cochlear Implants | ||
| Other Implants | ||
| By Material | Metals & Alloys | |
| Polymers | ||
| Ceramics & Bio-active Glass | ||
| Composite & Hybrid Biomaterials | ||
| Other Materials | ||
| By Origin | Autograft | |
| Allograft | ||
| Xenograft | ||
| Synthetic / Prosthetic | ||
| By End User | Hospitals | |
| Ambulatory Surgical Centers | ||
| Specialty Clinics | ||
| Geography | North America | United States |
| Canada | ||
| Mexico | ||
| Europe | Germany | |
| United Kingdom | ||
| France | ||
| Italy | ||
| Spain | ||
| Rest of Europe | ||
| Asia-pacific | China | |
| Japan | ||
| India | ||
| Australia | ||
| South Korea | ||
| Rest of Asia-pacific | ||
| Middle East and Africa | GCC | |
| South Africa | ||
| Rest of Middle East and Africa | ||
| South America | Brazil | |
| Argentina | ||
| Rest of South America | ||


Key Questions Answered in the Report
What is the current size of the bio-implants market and how fast is it growing?
The bio-implants market is valued at USD 164.36 billion in 2026 and is projected to rise to USD 238.33 billion by 2031, registering a 7.72% CAGR.
Which implant category is expanding the quickest?
Cardiovascular implants show the strongest momentum, advancing at an 8.23% CAGR through 2031 on the back of transcatheter valves and remote-monitoring sensors.
Why are specialty clinics gaining share from hospitals?
Payer approval for outpatient joint and shoulder arthroplasty, along with robotics migrating to ambulatory settings, is driving an 8.19% CAGR for specialty clinics.
What regions offer the highest growth potential?
Asia-Pacific leads growth with an 8.11% CAGR to 2031, buoyed by large-scale healthcare investments and streamlined regulatory pathways.
How are smart sensor-enabled implants changing business models?
Devices that stream continuous physiological data enable subscription-based monitoring services, shifting revenue away from one-time hardware sales toward recurring service income.
What is the main regulatory hurdle in Europe?
Medical Device Regulation (MDR) certification bottlenecks, caused by only 43 notified bodies handling roughly 500,000 devices, are delaying product launches and dampening regional growth.
Page last updated on:


