
Smart Implants Market Size and Share
Market Overview
| Study Period | 2020 - 2031 |
|---|---|
| Market Size (2026) | USD 7.62 Billion |
| Market Size (2031) | USD 18.12 Billion |
| Growth Rate (2026 - 2031) | 18.92 % |
| Fastest Growing Market | Asia-Pacific |
| Largest Market | North America |
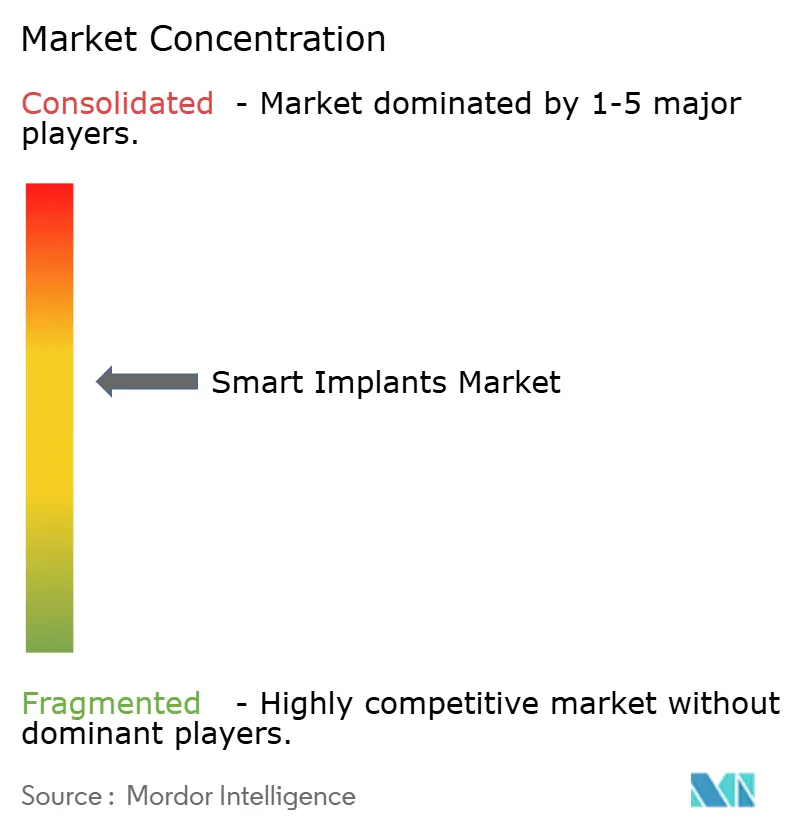
| Market Concentration | Medium |
Major Players
*Disclaimer: Major Players sorted in no particular order Image © Mordor Intelligence. Reuse requires attribution under CC BY 4.0. |
|
Smart Implants Market Analysis by Mordor Intelligence
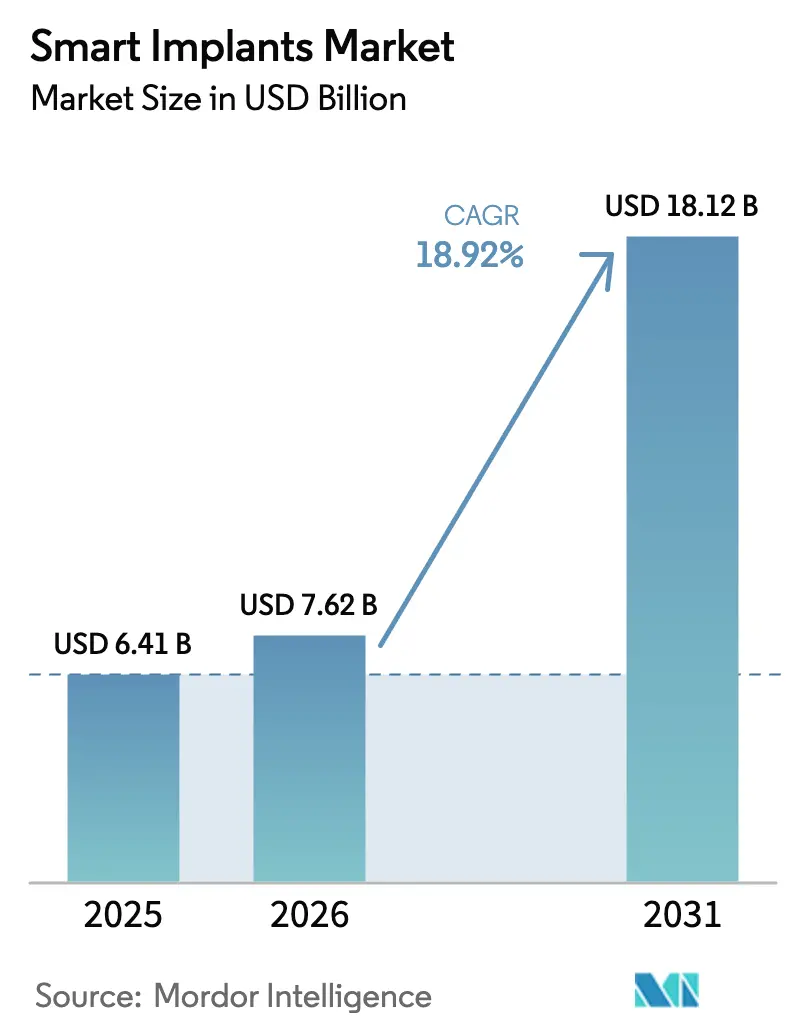
The Smart Implants market size was valued at USD 6.41 billion in 2025 and estimated to grow from USD 7.62 billion in 2026 to reach USD 18.12 billion by 2031, at a CAGR of 18.92% during the forecast period (2026-2031). This brisk expansion is tied to the fusion of miniaturised sensors, low-power electronics, wireless telemetry and predictive analytics that shift implants from passive fixtures to always-on therapeutic nodes. Growth benefits from aging demographics, rising chronic disease prevalence and the widening push toward value-based care that rewards measurable post-operative outcomes. Early clinical data showing lower readmission rates and fewer revision surgeries is persuading public and private payers to clear higher reimbursement tiers. Meanwhile, national cybersecurity rules and unique device identification mandates are lengthening design cycles but ultimately building clinician and patient trust. Orthopedic platforms showcasing gait-tracking knees and load-sensing joints illustrate the commercial pull of real-time recovery data.
Key Report Takeaways
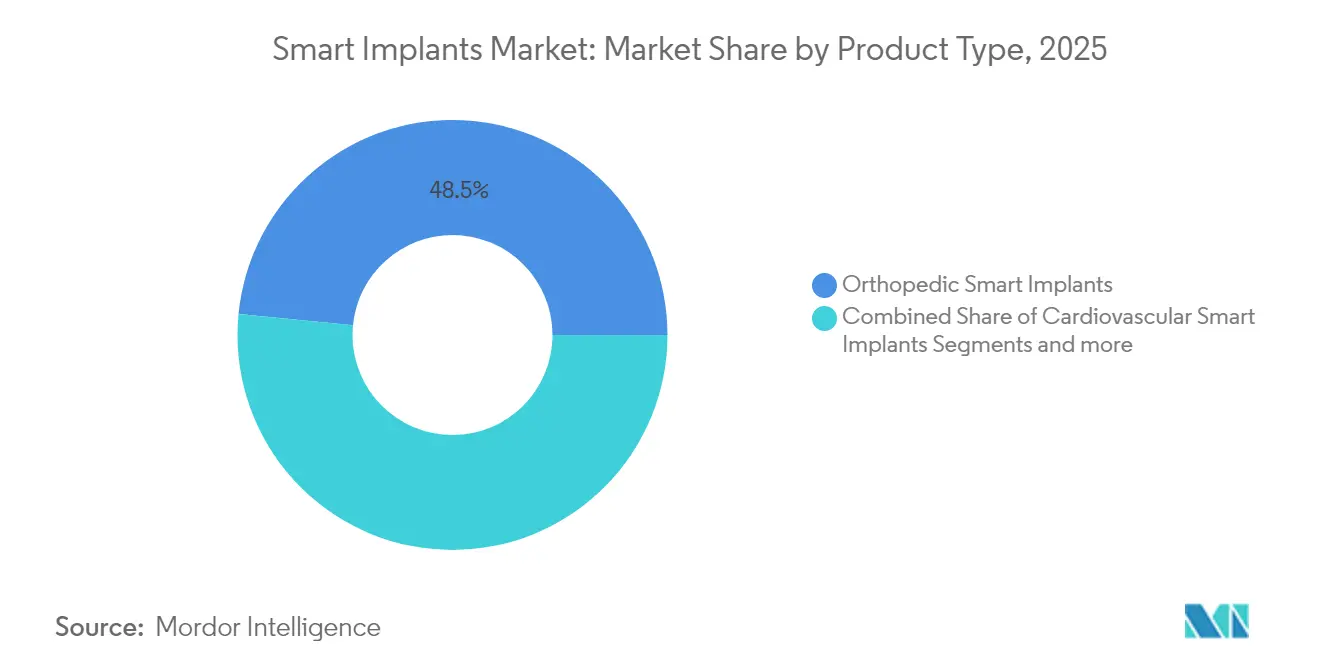
- By product type, orthopedic implants led with 48.45% revenue share in 2025, while cardiovascular devices recorded the fastest 20.01% CAGR through 2031.
- By end user, hospitals held 53.98% of the Smart Implants market share in 2025; ambulatory surgical centers are advancing at a 19.74% CAGR to 2031.
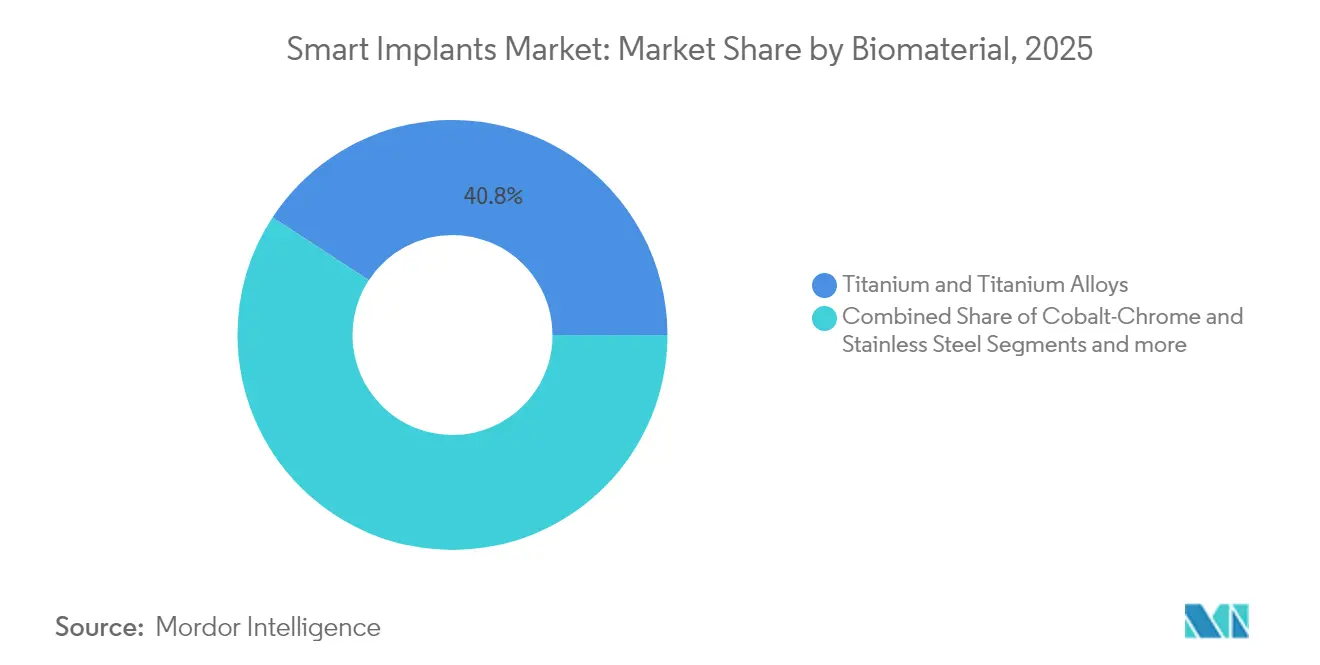
- By product type, titanium and titanium alloys led with 40.78% revenue share in 2025, while bio-absorbable polymers recorded the fastest 19.86% CAGR through 2031.
- By end user, North America held 39.75% of the Smart Implants market share in 2025; Asia-Pacific are advancing at a 20.05% CAGR to 2031.
Note: Market size and forecast figures in this report are generated using Mordor Intelligence’s proprietary estimation framework, updated with the latest available data and insights as of 2026.
Global Smart Implants Market Trends and Insights
Drivers Impact Analysis*
| Driver | (~) % Impact on CAGR Forecast | Geographic Relevance | Impact Timeline |
|---|---|---|---|
| Growing geriatric population & chronic disorders | +4.2% | North America, Europe | Long term (≥ 4 years) |
| Rising incidence of accidents & sports injuries | +2.8% | North America, Europe, emerging APAC | Medium term (2-4 years) |
| Technological advancements in smart implants | +5.1% | Global | Short term (≤ 2 years) |
| Shift to value-based care needing post-surgical data | +3.4% | North America, Europe | Medium term (2-4 years) |
| Additive manufacturing of sensor-embedded implants | +2.6% | North America, APAC | Medium term (2-4 years) |
| Digital-twin integration for predictive analytics | +1.9% | North America, Europe | Long term (≥ 4 years) |
| Source: Mordor Intelligence | |||
Growing geriatric population & chronic disorders
The share of people aged 65 and above is projected to double between 2025 and 2050, intensifying demand for joint replacements, cardiac rhythm management and ophthalmic procedures. Smart Implants market players are embedding pressure, temperature and bio-chemical sensors that flag early signs of loosening or infection, reducing costly revision surgeries. Biodegradable sensor platforms that dissolve after healing are moving from lab to clinic, trimming follow-up visits and hospital stays[1]Penn State, "Biodegradable electronics may advance with ability to control dissolve rate," sciencedaily.com. Continuous rhythm and hemodynamic monitoring in pacemakers and defibrillators is improving outcomes for multimorbid seniors. Health-economic models indicate institutional savings when post-surgical complications fall below 3% of caseloads.
Rising incidence of accidents & sports injuries
Trauma departments now fit fracture plates and ligament anchors that log strain and micromotion, guiding physiotherapy timelines. Integrated accelerometers and gyroscopes reveal adherence to prescribed motion limits, replacing subjective patient diaries. Absorbable polymer screws tailored for anterior cruciate ligament repairs merge with pH sensors that confirm inflammatory status [2]Huang B, "Absorbable implants in sport medicine and arthroscopic surgery: A narrative review of recent development," Bioactive Materials, sciencedirect.com. Rapid 3D-printed titanium plates designed from CT data cut operating room time by 25% and improve anatomical congruence. Data-rich recoveries shorten athlete downtime, restoring productivity and lowering indirect societal costs.
Technological advancements in smart implants
Ultra-low-power chips harvesting kinetic or biofluid energy eliminate battery swaps and extend life spans beyond a decade [3]Northwestern University, "World's smallest pacemaker is activated by light," sciencedaily.com. Adaptive neuro-stimulators such as BrainSense modify pulse amplitude and frequency in real time, improving Parkinson’s symptom control and minimising side effects. Laser powder bed fusion allows lattice cavities that promote osseointegration and house hermetically sealed sensor arrays. Digital design loops employing finite-element modelling cut prototype runs by 40%, accelerating market entry.
Shift to value-based care needing post-surgical data
Bundled payment contracts link reimbursement to ninety-day readmission and complication rates, incentivising data-generating implants. Remote dashboards integrate implant telemetry with electronic health records, enabling clinicians to triage at-risk patients without on-site visits. Manufacturers now include outcome-based clauses, accepting partial payment only if revision rates stay below preset thresholds. Rural health systems gain particular benefit, lowering travel expenses for follow-ups.
Restraints Impact Analysis*
| Restraint | (~) % Impact on CAGR Forecast | Geographic Relevance | Impact Timeline |
|---|---|---|---|
| Stringent regulatory approval timelines | -2.9% | North America, Europe | Medium term (2-4 years) |
| High cost & reimbursement gaps | -3.1% | Global, acute in emerging markets | Long term (≥ 4 years) |
| Biocompatibility & long-term safety concerns | -1.8% | Developed markets | Long term (≥ 4 years) |
| Cyber-security & data-privacy risks | -2.2% | North America, Europe | Short term (≤ 2 years) |
| Source: Mordor Intelligence | |||
Stringent regulatory approval timelines
Cybersecurity test requirements added in 2023 lengthen 510(k) and PMA reviews by up to 12 months. Europe’s MDR demands full clinical evidence for legacy implants, prompting smaller firms to cull product lines and redirect R&D spend. Divergent data-format rules across regulators oblige sponsors to generate parallel submissions, inflating compliance budgets. Novel AI-adaptive systems must now file real-time learning protocols, further stretching review cycles.
High cost & reimbursement gaps
Next-generation implants price at double or triple conventional equivalents, challenging procurement committees. Payers often insist on randomised trial data before granting coverage, delaying revenue capture. The iDose TR ocular implant lists at USD 14,000, dwarfing topical regimens yet still awaits broad reimbursement in many markets. Currency swings compound affordability issues in Latin America and Southeast Asia.
*Our forecasts treat driver/restraint impacts as directional, not additive. The impact forecasts reflect baseline growth, mix effects, and variable interactions.
Segment Analysis
By Product Type: Orthopedic dominance drives innovation
Orthopedic devices commanded 48.45% of the Smart Implants market in 2025, underscoring the natural fit between load-bearing joints and continuous kinematic feedback loops. Platforms such as Persona IQ transmit gait symmetry, step count and range of motion every evening via a dedicated base station, giving surgeons an objective view of recovery trajectories. Early trials show unplanned clinic visits dropping by 26% when alerts direct interventions promptly. Cardiovascular systems follow as the fastest riser, posting a 20.01% CAGR through 2031. Abbott’s AVEIR leadless pacemaker extends physiologic pacing to the conduction system, broadening candidacy while eliminating pocket infections. Emerging ophthalmic implants like the iDose TR free glaucoma patients from daily adherence burdens for up to three years, demonstrating the broader reach of micro-reservoir technologies.
Growth tailwinds come from robotics-assisted knee and spine surgeries that rely on precise post-op analytics to tune rehabilitation. Ophthalmic and dental niches attract venture backing thanks to smaller anatomical spaces that showcase sensor miniaturisation. Meanwhile, cosmetic and reconstructive segments integrate temperature and pH probes to spot infection early, though their volume remains modest. Continuous pressure mapping within cranio-maxillofacial plates is helping trauma surgeons refine fixation patterns, hinting at wider cross-specialty uptake.



By End User: Hospital infrastructure supports ASC growth
Hospitals retained 53.98% of the Smart Implants market in 2025 as their full-service imaging suites, sterilisation lines and multidisciplinary teams match the technical demands of programming, data integration and emergency backup. IDN purchasing clout secures bundled pricing that absorbs premium list costs while feeding outcome dashboards used in payer negotiations. Teaching institutions leverage telemetry datasets for big-cohort research, strengthening their draw for complex cases and NIH grants.
Ambulatory surgical centers record the briskest 19.74% CAGR to 2031, buoyed by expanded Medicare outpatient lists that now include total knee arthroplasty. Motion-tracking orthopedic implants flag deviations during the first week, enabling remote physiotherapist calls that keep discharge metrics within benchmarks. Specialty eye centers insert drug-releasing stents during ten-minute in-office procedures, trimming hospital overheads. Clinics dedicated to pain neuromodulation harvest device logs to titrate stimulation remotely, fitting the lean ASC staffing model. Nonetheless, cybersecurity liability insurance premiums remain a hurdle for many stand-alone sites.
By Biomaterial: Titanium leadership faces polymer innovation
Titanium and titanium alloys held 40.78% share in 2025 for their best-in-class strength-to-weight ratio, osteoconductive oxide layer and MRI compatibility. The Smart Implants market size for titanium platforms is poised for incremental gains as powder-bed fusion brings lattice porosity that matches cortical bone modulus and embeds sensor wiring seamlessly. Manufacturers now integrate thermistors inside acetabular cups, transmitting localized temperature as an infection early-warning sign.
Bio-absorbable polymers, however, post the fastest 19.86% growth run. Teleflex’s acquisition of Freesolve brings a metallic scaffold that fully resorbs after 12 months, mitigating late in-stent restenosis risk. PLGA-based cranial plates carrying bioresorbable strain gauges report displacement until bone fusion, then vanish, avoiding paediatric re-operation. Hybrid magnesium-polymer composites offer temporal load sharing, fading as native tissue regains strength. Still, polymer radio-opacity challenges complicate radiographic follow-up, spurring development of iodine-doped filaments.
Geography Analysis
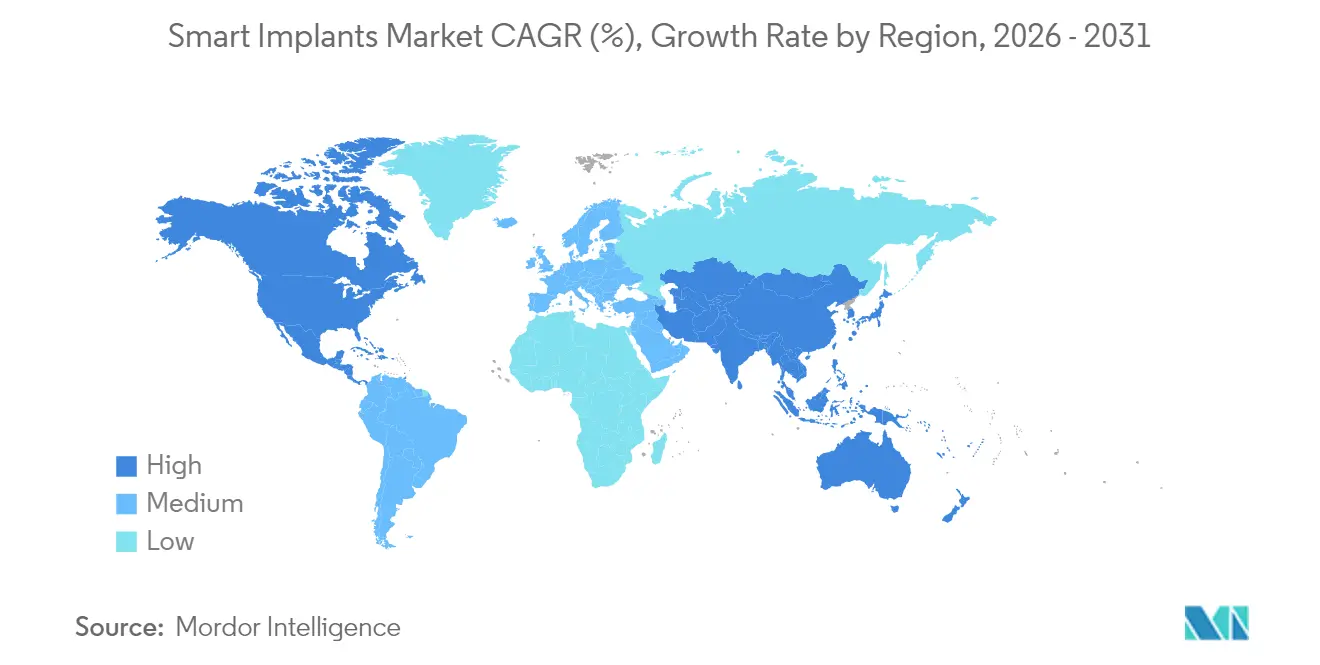
North America generates 39.75% of global revenue in 2025, aided by early digital-health adoption, mature payer frameworks and an FDA pathway that gives clear guidance on cybersecurity and clinical evidence. Top device companies cluster near engineering schools and venture hubs, shortening iterative loops from benchtop to bedside. Federal telehealth waivers renewed in 2025 normalize remote implant monitoring, further anchoring demand. Cross-border data flow accords with Canada streamline multi-site trials and open secondary markets.
Asia-Pacific delivers the quickest 20.05% CAGR through 2031. Government procurement preference schemes in China, India and South Korea accelerate domestic manufacturing scale and trim landed prices. China green-lit its first 3D-printed total knee in 2024, a watershed for home-grown innovation. India’s updated medical-device code limits promotional spending, nudging companies toward evidence-led marketing. ASEAN smart-hospital blueprints allocate funds for cloud telemetry, promising lift for implant connectivity vendors.
Europe struggles with MDR bottlenecks that push recertification deadlines, yet its rigorous outcome registries produce rich longitudinal datasets that validate Smart Implants market claims. Germany subsidizes digital-health apps, pairing them with neuromodulation implants for chronic back pain. The United Kingdom’s NHS pilots digital twins for hip replacements, seeking to cut revision rates by 15% within five years. Scandinavian tenders mandate life-cycle carbon accounting, giving biodegradable platforms a foothold.

Regulatory Landscape
Smart implants that combine implantable hardware with software and connectivity must satisfy both traditional implant controls and evolving digital requirements. In the United States, many active implantable systems remain under FDA Class III oversight, which drives PMA or De Novo pathways alongside cybersecurity and software documentation expectations. The FDA transition to the Quality Management System Regulation (QMSR) on February 2, 2026 incorporates ISO 13485:2016 by reference and tightens quality-system alignment for global submissions.
In Europe, EU MDR 2017/745 continues to raise the bar for clinical evidence and post-market surveillance for both legacy and new implants, while software-centric capabilities are shaped by cross-cutting digital requirements. The EU AI Act (Regulation 2024/1689) adds obligations for high-risk AI used in medical devices, with key requirements taking effect on August 2, 2026, intersecting with smart implant analytics and adaptive algorithms. Across major markets, commonly cited standards for software-integrated and connected implants include IEC 62304 (software lifecycle), IEC 81001-5-1 (cybersecurity), and ISO 14971 (risk management), which increases validation and documentation workloads for sensor-enabled and telemetry-based implant platforms.
Competitive Landscape
Industry structure tilts toward diversified medical-device majors that integrate sensors via acquisitions or joint ventures. Zimmer Biomet’s tie-up with Canary Medical yielded Persona IQ, setting a benchmark for 10-year battery life and automated gait analytics. Exactech signed with start-up Statera to launch a smart reverse shoulder featuring multi-axis load cells, demonstrating cross-portfolio replication. Teleflex’s BIOTRONIK asset purchase signals ambitions to pair resorbable scaffolds with pressure telemetry, expanding cardiovascular reach.
Patent filings surrounding wireless power transfer, hermetic polymer encapsulation and AI-adaptive stimulation climbed 18% year-on-year in 2024. New entrants include software-as-medical-device firms offering cloud AI that retrofits onto incumbent implants, introducing coopetition dynamics. Hospitals increasingly select vendors on data-platform openness, nudging closed-loop ecosystems toward interoperability standards such as IEEE 11073 and Bluetooth LE medical extensions. Meanwhile, payer scrutiny over premium pricing requires suppliers to bundle outcome evidence and risk-sharing clauses, favouring players with robust analytics teams.
Market entry barriers also rise with regulatory complexity and need for clinician training programs. Yet white-space remains in pediatric, veterinary and low-resource settings, where smaller form factors, long-life power and cost constraints differentiate winners. Partnerships with telecom operators to ensure stable IoT connectivity in rural zones represent another competitive frontier.
Smart Implants Industry Leaders
-
Stryker
-
Zimmer Biomet
-
CONMED
-
Medtronic
-
NuVasive Inc.
- *Disclaimer: Major Players sorted in no particular order

Market Opportunities and Future Outlook
Opportunities cluster where clinical workflow, customization, and regulated digital engineering intersect. In July 2026, Rambam Health Care Campus partnered with EOS and PTC to establish an in-house Digital Implant Engineering Center for customized 3D-printed implants. This points to demand for hospital-based digital manufacturing and design-control toolchains that can shorten iteration loops while still meeting implant-grade quality requirements. It also creates whitespace for suppliers that can package validated design software, additive manufacturing parameters, and traceable data pipelines that connect with hospital IT and post-op monitoring.
Funding and programmatic initiatives are also widening the innovation funnel for active and smart implants. The EU-backed IPCEI Health Tech4Cure initiative, led by FineHeart and supported by multiple EU member states, is organizing capabilities across the active implantable medical device sector, improving the environment for cross-border development and industrial scaling. On the R&D side, EIC-funded projects such as SmartFuse (intervertebral implants with embedded wireless electrotherapeutic technology to monitor bone growth) show continued pull for implants that produce actionable healing metrics. Regulatory momentum also remains visible, as China NMPA approved the NEO brain-computer interface system in March 2026, highlighting an accelerating pathway for implantable neurotechnology in Asia. In the United States, collaborative engines such as the IMPACT consortium (Indiana Musculoskeletal Health Partnership), a National Science Foundation Regional Innovation Engines competition finalist, support models that translate sensorized orthopedic and spine concepts into manufacturable, clinically-evaluable products.
Recent Industry Developments
- July 2026: Medtronic completed acquisition of SPR Therapeutics, Inc. The acquisition expands Medtronic's minimally invasive neuromodulation portfolio and enables broader chronic pain management options. The deal strengthens Medtronic's non-opioid therapy offerings and positions the company to capture adoption in post-operative and chronic pain settings.
- June 2026: Medtronic completed acquisition of Scientia Vascular. The acquisition broadens Medtronic's neurovascular device portfolio and expands access into new neurovascular procedures. The integration of Scientia Vascular products enhances Medtronic's portfolio and geographic reach.
- April 2026: Medtronic completed acquisition of CathWorks. The acquisition extends Medtronic's cardiovascular device portfolio and deepens capabilities in transcatheter technologies. The move broadens leadership in transforming care for patients with cardiovascular disease.


Research Methodology Framework and Report Scope
Market Definition and Coverage
For this study, we size smart implants as implantable medical devices that integrate sensing and or connectivity features to measure, record, or transmit patient or device performance data after implantation.
Scope exclusions: We exclude purely external wearable sensors and non-implantable monitoring accessories, even if they are used alongside an implant.
Segmentation Overview
-
By Product Type
-
Orthopedic Smart Implants
- Knee Arthroplasty
- Hip Arthroplasty
- Shoulder Arthroplasty
- Spine Fusion
- Fracture Fixation
- Others
-
Cardiovascular Smart Implants
- Pacemakers & ICDs
- Smart Stents
- Structural Cardiac Implants
-
Ophthalmic Smart Implants
- Smart Intra-ocular Lens
- Glaucoma Implants
- Dental Smart Implants
- Cosmetic and Reconstructive Smart Implants
- Other Smart Implants
-
Orthopedic Smart Implants
-
By End User
- Hospitals
- Ambulatory Surgical Centers
- Specialty Clinics
- Others
-
By Biomaterial
- Titanium and Titanium Alloys
- Cobalt-Chrome and Stainless Steel
- Bio-absorbable Polymers
- Others
-
By Geography
-
North America
- United States
- Canada
- Mexico
-
Europe
- Germany
- United Kingdom
- France
- Italy
- Spain
- Rest of Europe
-
Asia-Pacific
- China
- Japan
- India
- Australia
- South Korea
- Rest of Asia-Pacific
-
Middle East and Africa
- GCC
- South Africa
- Rest of Middle East and Africa
-
South America
- Brazil
- Argentina
- Rest of South America
-
North America
Data Sources, Market Sizing, and Validation
Desk Research
Desk research starts with building a clear view of where smart implants show up in real healthcare delivery, and how demand is counted in value terms. We reference public health statistics and care activity signals, such as U.S. CDC burden-of-disease datasets, OECD health indicators, WHO health expenditure series, and national procedure and hospital activity publications where available.
To keep the supply side grounded, we also review regulatory and product signals, such as FDA device databases and safety communications, the European Commission MDR and EUDAMED updates, and patent filings through a paid patent database subscription. Company filings, annual reports, investor decks, and reputable press are used to sanity-check pricing direction and adoption claims, supported by a paid news and company financials database for consistent timelines. These examples are not exhaustive, and we also reviewed other public sources during data collection, validation, and research clarification.
Primary Interviews and Surveys
Primary work focuses on converting technology talk into measurable demand and pricing logic, so we speak with implant manufacturers, component suppliers, hospital procurement teams, surgeons, and payer or reimbursement experts across major regions. These discussions help confirm which smart features are routinely priced into purchase decisions, where adoption is still pilot-led, and how replacement cycles and follow-up services are treated in revenue estimates. Inputs are then used to close data gaps from published statistics and to cross-check the modeled totals before finalizing.
Distribution of primary research fieldwork respondents
| Company type | Respondent position | Region |
|---|---|---|
| Top tier: 26% | CXOs: 16% | APAC: 39% |
| Mid tier: 54% | Functional/Unit leaders: 28% | EMEA: 37% |
| Smaller Players: 20% | Managers: 56% | Americas: 24% |
Market-Sizing & Forecasting
Sizing begins with a top-down build that reconstructs the addressable revenue pool from procedure volumes and implanted base growth, which are then filtered through smart-feature penetration and average selling price ranges by implant category. The model uses a limited set of trackable inputs that interviewees can validate, such as orthopedic and cardiac implant procedure trends, chronic disease prevalence that drives implant demand, reimbursement coverage direction for connected monitoring, average device replacement and revision patterns, and the pace of sensor and telemetry adoption in new product launches.
Once the first total is formed, we corroborate it with selective bottom-up checks, such as rolling up sampled supplier revenues where disclosures are available and testing ASP x estimated unit volumes for a few high-visibility applications. When a data point is missing for smaller countries or sub-applications, gaps are handled through proxy penetration curves anchored to comparable health spend levels and hospital capacity, followed by expert review to avoid overextension.
Forecasting is primarily done using scenario analysis, because adoption depends heavily on reimbursement willingness and clinical pathway change rather than only historical shipment growth. To keep the forecast explainable, each scenario is tied to a small set of variables that experts can agree on, and then the final projection is selected based on the most likely reimbursement and adoption pathway discussed in interviews.
Data Validation & Update Cycle
Validation is done in layers so one unusual input does not distort the total. We compare the modeled market value against independent signals like implant procedure trajectories, reported device sales direction in public filings, and regional adoption cues raised by clinicians and procurement teams.
If large variances show up by region or by application, we re-check currency timing, price assumptions, and penetration logic, and then re-contact selected experts when a change looks material. Before sign-off, the output goes through a multi-step analyst review that includes consistency checks across years, trend reasonability, and cross-region logic. Reports are refreshed annually, and interim updates are made when major regulatory, reimbursement, or product events are likely to shift the forecast. A final pre-delivery pass is then completed to reflect the latest available information.
Mordor Intelligence's Smart Implants Market Size Compared Against Other Published Estimates
Published market numbers for smart implants often vary, even when they look like they are talking about the same product family. Differences usually come from what is counted as a smart feature, whether related monitoring revenue is included, which geographies are covered in detail, and how fast penetration is assumed to rise after approvals.
In practice, the biggest gap drivers are scope and pricing logic. Some estimates blend in broader active implant categories or connected care software revenue, and others keep the definition closer to sensor or telemetry-enabled implants only. Base year choice also matters because procedure volumes and elective surgery recovery can change quickly, and FX timing can shift USD totals across regions. Here, the count is tied to implant revenue where smart functionality is embedded and priced into the device, and the annual refresh process keeps assumptions aligned to the latest procedure and adoption signals, which is applied in the final market total by Mordor Intelligence.
Benchmark comparison
| Source | Market Size | Gaps in Research Methodology |
|---|---|---|
| Mordor Intelligence | USD 6.41 B (2025) | |
| Trade Journal A | USD 5.00 B (2023) | Uses an earlier base year and appears to apply a broader definition of smart implants that may rely on headline adoption claims, with limited visibility on procedure-linked penetration and FX timing. |
| Industry Publication B | USD 6.10 B (2024) | Includes a different base year and can shift totals depending on whether adjacent connected monitoring and follow-up service value is added to the implant device revenue. |
The spread in values is explainable once base year and what gets counted as device revenue are made explicit. By anchoring the size to procedure-linked demand and testing penetration and ASP assumptions through interviews, the estimate stays traceable to inputs that can be revisited and updated in a repeatable way.


Key Questions Answered in the Report
What is the current size of the Smart Implants market?
The Smart Implants market size is USD 7.62 billion in 2026 and is projected to grow rapidly through 2031.
Which product category holds the largest share?
Orthopedic smart implants lead with 48.45% market share in 2025 due to widespread adoption in joint replacement surgeries.
Which end-user setting is expanding quickest?
Ambulatory surgical centers show the fastest 19.74% CAGR as outpatient protocols and remote monitoring make complex implants feasible outside hospitals.
Why are bio-absorbable polymers gaining traction?
They eliminate secondary removal surgeries and can house degradable sensors, driving a 19.86% segment CAGR.
Which region is forecast to grow the fastest?
Asia-Pacific is set to post a 20.05% CAGR through 2031, buoyed by supportive manufacturing policies and rising healthcare investment.
How are regulators addressing cybersecurity risks?
The FDA mandates detailed software bills of materials and penetration testing evidence for all connected implants, extending review timelines but boosting trust.
Page last updated on:


 Your data is secure and never sold or shared.


