COVID-19 Safety and Prevention Products Market Size and Share
Market Overview
| Study Period | 2020 - 2031 |
|---|---|
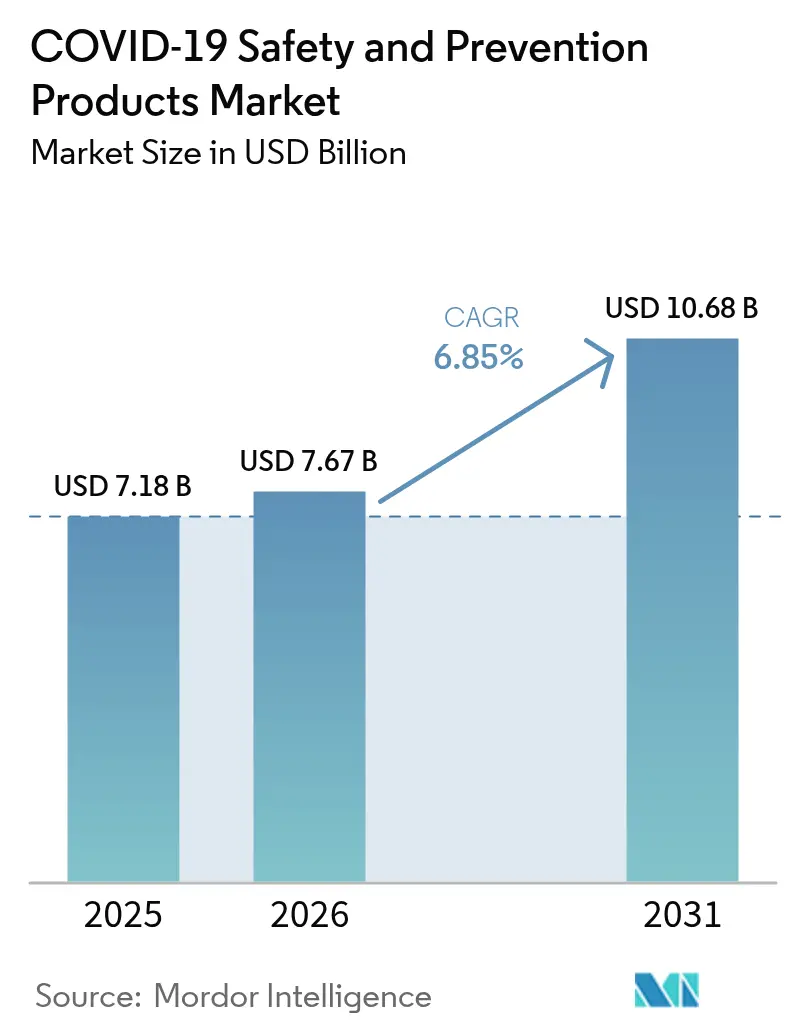
| Market Size (2026) | USD 7.67 Billion |
| Market Size (2031) | USD 10.68 Billion |
| Growth Rate (2026 - 2031) | 6.85% CAGR |
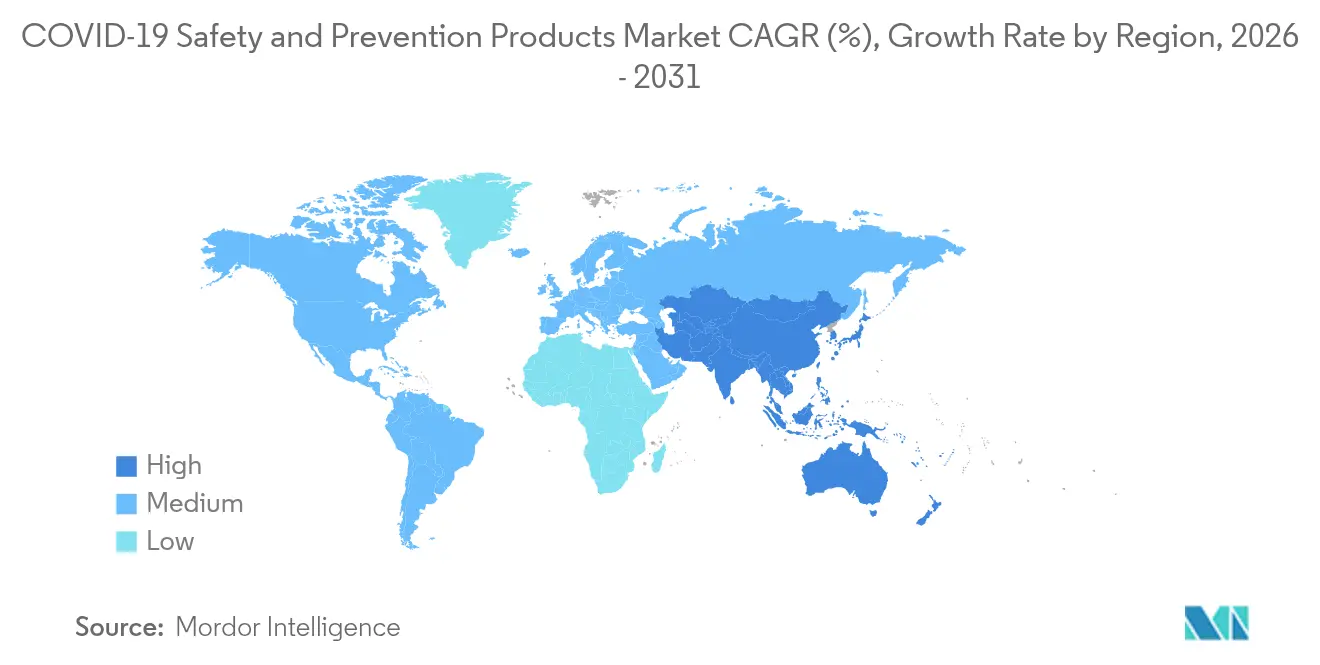
| Fastest Growing Market | Asia Pacific |
| Largest Market | North America |
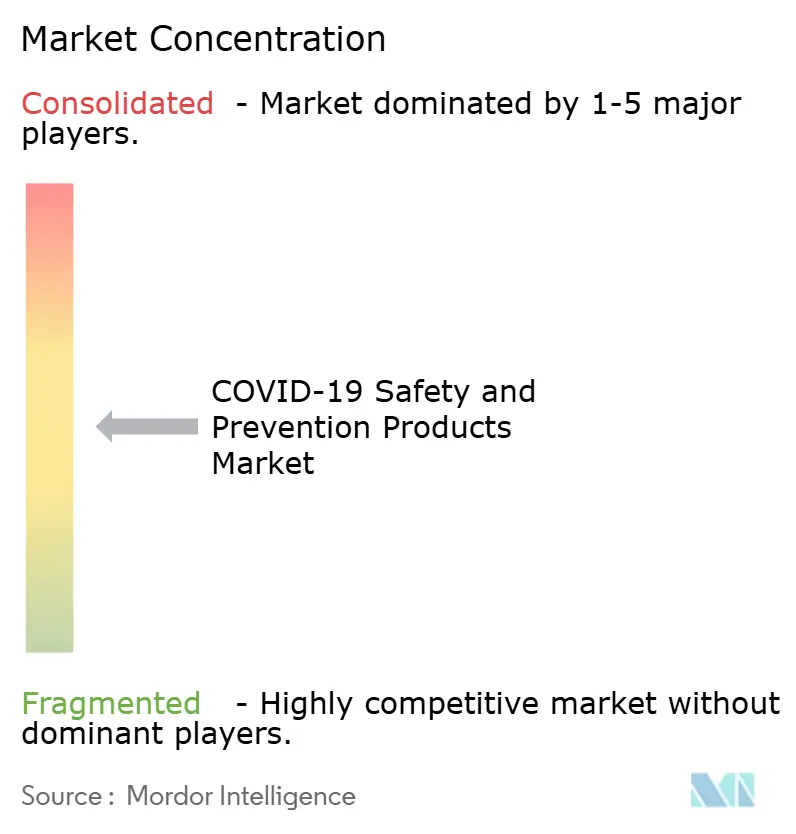
| Market Concentration | Medium |
Major Players *Disclaimer: Major Players sorted in no particular order Image © Mordor Intelligence. Reuse requires attribution under CC BY 4.0. | |
COVID-19 Safety and Prevention Products Market Analysis by Mordor Intelligence
The COVID-19 Safety And Prevention Products Market size is expected to grow from USD 7.18 billion in 2025 to USD 7.67 billion in 2026 and is forecast to reach USD 10.68 billion by 2031 at 6.85% CAGR over 2026-2031. Growing demand for technology-integrated personal protective equipment (PPE), widening government stockpiling programs, and higher ESG procurement standards underpin this expansion. Digital commerce platforms accelerate purchasing cycles, while corporate sustainability targets spur interest in reusable and biodegradable solutions. The convergence of artificial intelligence (AI), the Internet of Things (IoT), and advanced materials steadily transforms worker protection from reactive interventions to predictive risk management. Raw-material price swings and fading pandemic-specific demand temper short-term sales volatility, yet the broader shift toward data-driven safety strategies keeps medium-term growth firmly positive.
Key Report Takeaways
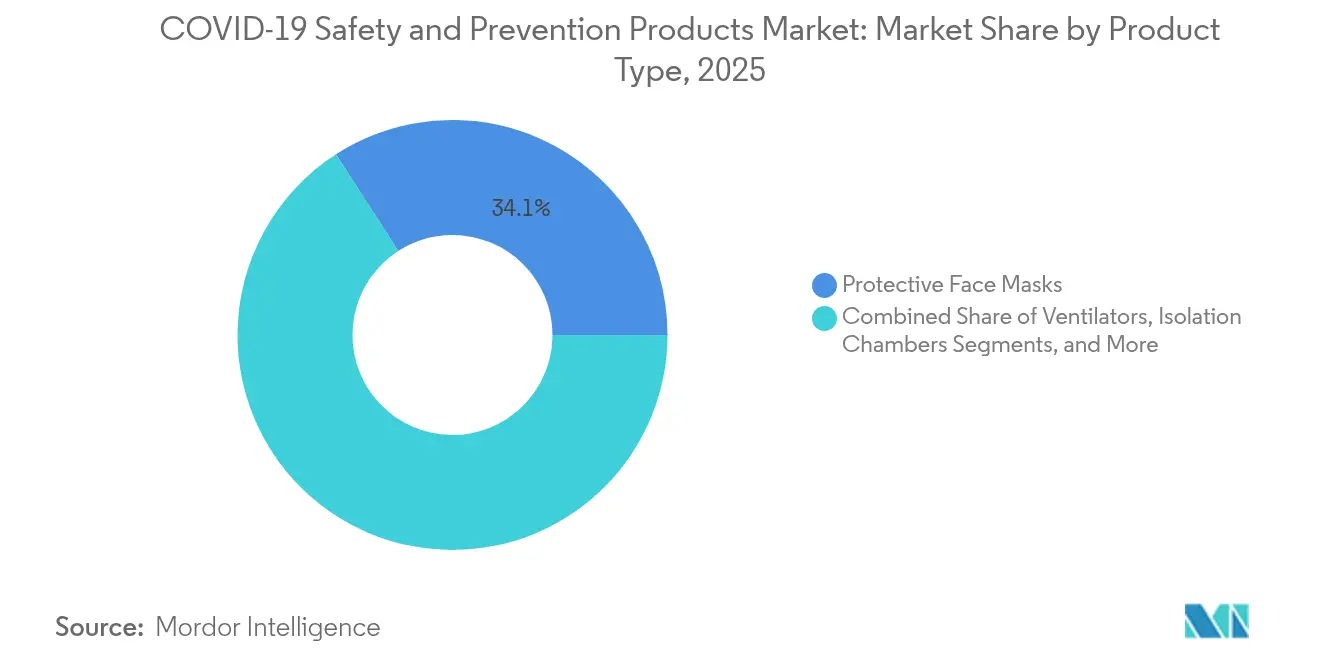
- By product type, protective face masks led with 34.12% of the safety and prevention products market share in 2025, whereas UV-C disinfection devices are forecast to expand at a 8.95% CAGR through 2031.
- By end-user, hospitals and clinics accounted for 41.05% share of the safety and prevention products market size in 2025; transportation and logistics represent the fastest-growing end-user segment at a 8.62% CAGR to 2031.
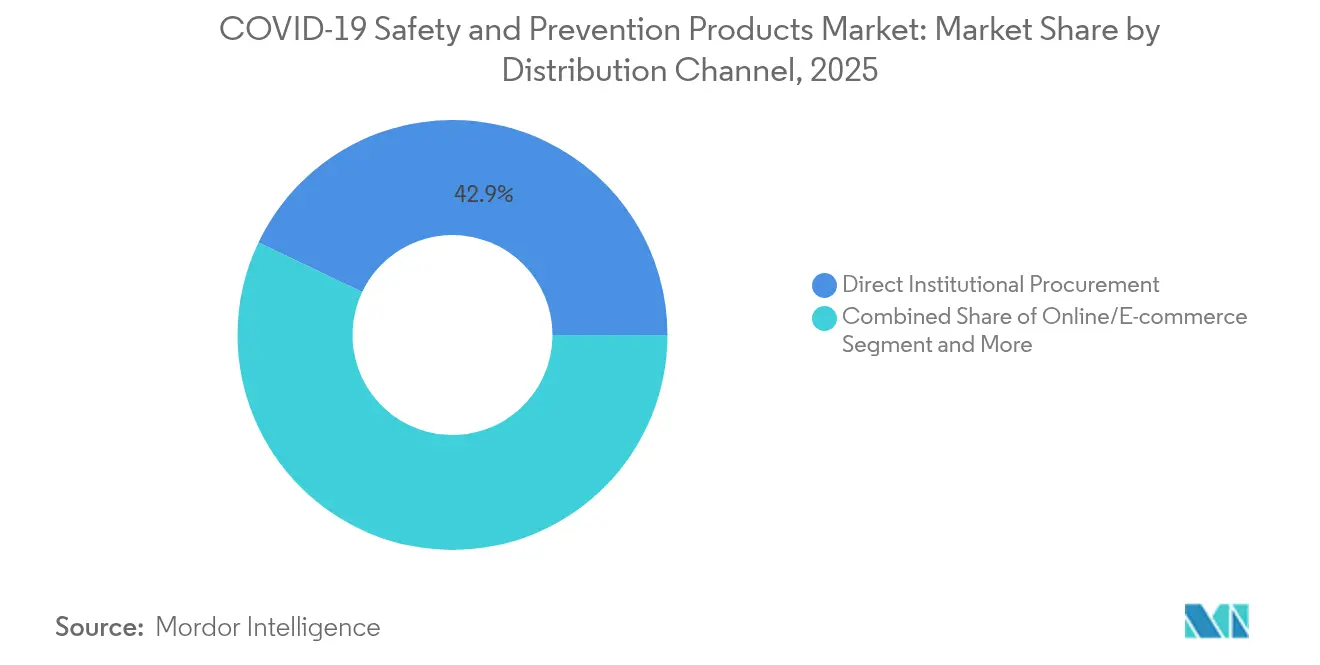
- By distribution channel, direct institutional procurement held 42.92% revenue share in 2025, while online and e-commerce platforms are advancing at a 9.4% CAGR through 2031.
- By geography, North America commanded 36.45% revenue share in 2025; Asia-Pacific is projected to be the fastest-growing region at a 9.1% CAGR during the forecast period.
Note: Market size and forecast figures in this report are generated using Mordor Intelligence’s proprietary estimation framework, updated with the latest available data and insights as of 2026.
Global COVID-19 Safety and Prevention Products Market Trends and Insights
Drivers Impact Analysis*
| Driver | (~) % Impact on CAGR Forecast | Geographic Relevance | Impact Timeline |
|---|---|---|---|
| Rising global stockpiling mandates by governments | +1.2% | Global (North America, Europe, Asia-Pacific) | Medium term (2-4 years) |
| Shift toward reusable and biodegradable PPE | +0.8% | Global (Europe, North America lead) | Long term (≥ 4 years) |
| Integration of IoT-enabled compliance monitoring systems | +1.5% | North America, Europe, expanding Asia-Pacific | Medium term (2-4 years) |
| Expansion of e-commerce B2B procurement platforms | +0.9% | Global, rapid in Asia-Pacific | Short term (≤ 2 years) |
| Surge in corporate ESG-linked procurement of low-carbon PPE | +0.7% | Europe, North America, growing Asia-Pacific | Long term (≥ 4 years) |
| Growth in public-health emergency funds beyond pandemic response | +0.6% | Global, emphasis on developed markets | Medium term (2-4 years) |
| Source: Mordor Intelligence | |||
Rising Global Stockpiling Mandates by Governments
Strategic reserves increasingly include connected detection equipment rather than only basic masks and gloves. The U.S. Strategic National Stockpile distributed 2.3 million PPE pieces in 2024 and now maintains an inventory worth USD 8 billion as it modernizes warehouse monitoring systems. Finland allocated EUR 242 million (USD 273 million) from European Union funds to create the continent’s largest CBRN reserve, illustrating how smaller nations leverage multilateral financing for advanced readiness. Similar initiatives in Australia and Canada emphasize shelf-stable, sensor-equipped products, creating multiyear, volume-driven demand pipelines. Consequently, the safety and prevention products market gains a predictable baseline of institution-led orders that smooths cyclical swings in discretionary industrial spending. Suppliers offering modular packaging, cloud-based tracking, and predictive analytics are favored for replenishment contracts.
Shift Toward Reusable and Biodegradable PPE
Corporate net-zero goals prompt procurement teams to scrutinize single-use disposables, encouraging the switch to fabric-based respirators, compostable gowns, and recycled-content face shields. DuPont reports extending the service life of Tyvek®, Nomex®, and Kevlar® garments through closed-loop recycling programs. [1]DuPont Sustainability Office, “DuPont Sustainability Report 2024,” dupont.com Start-ups such as AmorSui and EcoTextura target hospitals seeking lower waste volumes without compromising barrier properties. Evolving landfill regulations in Europe impose differential fees on mixed plastic disposal, indirectly raising the cost of legacy polypropylene items. Larger manufacturers invest in biopolymer R&D and secure green-energy certificates to protect pricing power, whereas smaller firms face higher compliance costs. Over time, circular design features move from marketing differentiator to minimum tender requirement, deepening the safety and prevention products market penetration of eco-efficient formats.
Integration of IoT-Enabled Compliance Monitoring Systems
Real-time exposure tracking, proximity alerts, and heat-stress analytics have changed buyer expectations for protective gear. Wearables from MākuSafe and SlateSafety continuously stream worker motion and environment data to cloud dashboards. [2]SlateSafety Editorial Team, “Top Safety Wearable Technology for 2024,” slatesafety.com Smart fabrics embed nanotechnology sensors that adjust breathability or stiffen on impact, while ultra-smart garments incorporate processing chips capable of local AI inference. Bodytrak headsets provide core-temperature telemetry that insurers now recognize as an evidence base for premium discounts. Early adopters report incident-rate reductions and measurable downtime savings, prompting regulators to reference connected PPE in updated safety codes. Integration barriers—data privacy, battery endurance, and field-service calibration—remain, but the superior life-cycle value proposition lifts the technology from pilot to standard specification in the safety and prevention products market.
Expansion of E-commerce B2B Procurement Platforms
Enterprise platforms streamline sourcing by matching catalog SKUs to preapproved budgets and automating compliance paperwork. CoreTrust and OMNIA Partners aggregate school-district demand, while Grainger’s digital credit model shortens purchase-to-pay cycles for small businesses. Industrial marketplace Moglix scales regionally, offering mid-tier manufacturers a channel to global buyers. With transaction analytics feeding demand forecasts, suppliers can optimize production runs and reduce obsolescence risk. Because these platforms integrate directly with ERP suites, buyers gain real-time stock status and automated traceability, steering volume away from traditional wholesalers. The safety and prevention products market sees higher online gross merchandise value each quarter, yet incumbents that invest in API-based catalogs and drop-shipment networks retain share by layering advisory services on top of digital fulfillment.
Restraints Impact Analysis*
| Restraint | (~) % Impact on CAGR Forecast | Geographic Relevance | Impact Timeline |
|---|---|---|---|
| Declining pandemic-specific demand post-vaccine roll-out | -1.8% | Global, pronounced in developed markets | Short term (≤ 2 years) |
| Raw-material price volatility for melt-blown polypropylene | -1.1% | Global, acute in Asia-Pacific hubs | Medium term (2-4 years) |
| Regulatory crack-downs on sub-standard imports | -0.7% | North America, Europe | Short term (≤ 2 years) |
| Environmental disposal challenges and evolving waste rules | -0.5% | Europe, North America, expanding global | Long term (≥ 4 years) |
| Source: Mordor Intelligence | |||
Declining Pandemic-Specific Demand Post-Vaccine Roll-out
Mask mandates and fever-screen checkpoints have eased in most public spaces, triggering inventory reductions at hospitals and universities. Commodity-grade items experience oversupply, forcing spot-price discounts that compress margins. Yet redeployment of protection protocols into transport hubs and warehousing offsets a share of lost healthcare volume. Growth shifts toward specialized formats—smart respirators, firefighting hoods, cooling vests—that satisfy long-standing industrial hazards. Manufacturers once reliant on high-volume, low-differentiation masks must pivot toward technology-enhanced offerings or exit the safety and prevention products market.
Raw-Material Price Volatility for Melt-Blown Polypropylene
Propylene feedstock swings reached USD 970–990 per metric ton in India during 2024, and petrochemical capacity constraints keep 2025 quotations elevated. Spot spikes squeeze small converters lacking hedging tools, while larger firms accelerate backward integration and recycled-polymer trials. Tariffs on Chinese PPE components shift sourcing to Vietnam and Mexico, yet duty-free quotas remain unpredictable, prolonging uncertainty. Vertical integration and multi-region supply networks become core resilience levers within the safety and prevention products industry.
*Our forecasts treat driver/restraint impacts as directional, not additive. The impact forecasts reflect baseline growth, mix effects, and variable interactions.
Segment Analysis
By Product Type: UV-C Technology Drives Innovation
UV-C disinfection devices represent the fastest-growing product group, expanding at a 8.95% CAGR as institutions prioritize continuous surface and air sanitization. Hospitals, schools, and commercial buildings retrofit HVAC systems with UV-C arrays that deactivate airborne pathogens within milliseconds. Sensor-based activation, remote monitoring dashboards, and predictive bulb replacement schedules differentiate premium units, steering procurement toward integrated platforms rather than standalone lamps. Protective face masks retain leadership with a 34.12% share of the safety and prevention products market in 2025, though volume migrates from single-use melt-blown models to reusable respirators embedded with filtration performance chips and communication microphones. Temperature-screening devices, including handheld infrared thermometers and networked thermal cameras, gain modest traction as enterprises integrate them with access-control systems. Ventilators register stable orders due to ongoing critical-care infrastructure investments in emerging markets. Gloves shift toward nitrile formulations for chemical resistance and allergy mitigation, while medical gowns adopt breathable laminates derived from bio-based polymers. Smart helmets for mining and construction integrate gas sensors and heads-up displays, showcasing the convergence of PPE and operational technology. These advancements collectively enlarge the safety and prevention products market size for multi-function protective ecosystems.


By End-user: Transportation Logistics Emerges as Growth Driver
Transportation and logistics facilities accelerate at a 8.62% CAGR, embracing collision-avoidance cameras, driver fatigue monitors, and cabin air-quality sensors initially designed for healthcare. Fleet operators deploy wearable beacons that geo-fence hazardous zones and trigger speed adjustments, converting traditional PPE spend into telematics-linked subscriptions. Hospitals and clinics still command 41.05% of 2025 revenue, yet their mix tilts toward predictive-maintenance-enabled equipment that automates compliance record-keeping. Long-term care facilities invest in ceiling lifts and smart floor mats to prevent falls, while industrial plants trial passive exoskeletons that cut musculoskeletal injuries to zero during pilot runs. Educational institutions leverage cooperative purchasing to equip laboratories with fume-hood airflow sensors and UV-C cabinet sterilizers. Individual and household adoption decelerates as pandemic fear subsides, but online marketplaces still capture hobbyist orders for particulate respirators and safety eyewear. Overall, data-centric buyers outpace traditional compliance-led purchasers, reinforcing a structural shift within the safety and prevention products market.
By Distribution Channel: Digital Platforms Reshape Procurement
Direct institutional procurement kept a 42.92% foothold in 2025 as government agencies and hospital systems renewed long-term contracts, yet e-commerce gained ground at a 9.4% CAGR. Platform operators integrate punch-out catalogs and offer configurable dashboards that tally carbon footprints at the line-item level. This transparency satisfies audit requirements under new ESG disclosure rules. Specialized PPE distributors reorient toward consultative services, providing fit-testing, sensor calibration, and regulatory training, thereby retaining margins despite online price competition. Retail pharmacies broaden assortments to include industrial respirators and chemical splash goggles, targeting small contractors and home renovators. Hybrid click-and-collect models meet rapid-delivery expectations without the overhead of full last-mile logistics. For manufacturers, digital channels provide visibility into secondary demand patterns, enabling agile production planning and targeted marketing. Consequently, the safety and prevention products market sees channel convergence where data flows replace traditional sales-force coverage.
Geography Analysis
North America maintained a 36.45% revenue share in 2025, bolstered by the USD 8 billion U.S. Strategic National Stockpile and OSHA’s updated Hazard Communication Standard. Government frameworks emphasize AI-enabled tracking and tamper-evident packaging, which favors suppliers with sensor integration capabilities. Venture investment strengthens the regional innovation pipeline; for example, Protex AI secured USD 36 million to refine computer-vision safety analytics. Raw-material cost swings and maturing pandemic inventory temper single-use PPE volume, yet growth persists in smart garments and cloud analytics subscriptions, keeping the safety and prevention products market expansion steady.
Asia-Pacific represents the fastest-growing region at a 9.1% CAGR by 2031. Singapore’s combustible-dust and machinery rules, effective January 2025, Malaysia’s OSHA Amendment Act 2022, and Australia’s ratification of ILO Convention 187 collectively harmonize standards and stimulate replacement cycles. Regional manufacturers leverage proximity to electronics supply chains to embed sensors cost-effectively, while tariff pressures coax some production lines toward Vietnam and India. Adoption varies: high-income districts integrate full IoT suites, whereas emerging economies prioritize basic compliance at minimal cost. Still, multilateral infrastructure projects finance modern safety inventories, enlarging the safety and prevention products market size across tier-2 cities.
Europe prioritizes circular economy legislation and ESG-aligned procurement. Finland’s EUR 242 million CBRN reserve funded by the EU underscores strategic stockpiling ambitions. Waste-reduction mandates push buyers toward biodegradable masks and reusable coveralls, creating pricing headroom for innovation leaders. Eastern European factories modernize under EU cohesion funds, adopting smart welding helmets and gas-sensing wearables. Divergent fiscal positions mean adoption rates are uneven, yet procurement guidelines converge on lifecycle assessments, reinforcing demand for connected PPE solutions throughout the safety and prevention products market.

Competitive Landscape
Consolidation advances as incumbents buy technology specialists to fuse hardware with data analytics. 3M, Honeywell, and DuPont extend vertical integration, but pure-play sensor firms capture mindshare through faster iteration cycles. MSA Safety’s USD 200 million purchase of German gas-analysis expert M&C TechGroup broadens detection portfolios and provides entry to high-growth chemical processing niches. Private-equity appetite remains robust, illustrated by Warburg Pincus nearing a EUR 800 million acquisition of Uvex to consolidate premium eyewear and head protection platforms.
Strategic thrusts revolve around SaaS-enabled ecosystems that bundle wearables, cloud dashboards, and AI-powered insights. Patent filings related to predictive safety technologies grew at a 26.4% CAGR between 2018 and 2023, indicating an intensifying R&D contest. [4]World Intellectual Property Organization, “Patent Landscape Report – Occupational Health and Safety,” wipo.int Regional champions such as Ansell in gloves and Lakeland in protective apparel reinforce niches by launching recycled-content lines and partnering with telematics vendors. Competitive pressure accelerates product-refresh cycles and shortens time-to-market for firmware updates.
Market entry barriers rise because full-solution suppliers must demonstrate cybersecurity compliance, sensor calibration protocols, and data sovereignty safeguards across jurisdictions. Mid-sized manufacturers without cloud engineering capabilities seek licensing or joint ventures to remain relevant. Price-led competition persists in commodity segments, but value migrates toward analytics subscriptions, predictive-maintenance APIs, and ESG-certified materials, redefining the safety and prevention products industry cost-curve.
COVID-19 Safety and Prevention Products Industry Leaders
3M Company
Honeywell International Inc.
DuPont de Nemours, Inc.
Kimberly-Clark Corporation
Ansell Limited
- *Disclaimer: Major Players sorted in no particular order

Recent Industry Developments
- June 2025: BDI Group bought Pacific Safety Consulting Group to enhance occupational safety services at RAM Engineering.
- June 2025: Radial Equity Partners invested in Plasticade to accelerate growth in traffic-safety products.
- May 2025: MSA Safety acquired M&C TechGroup for USD 200 million, augmenting its gas analysis and process safety portfolio.
- February 2025: Warburg Pincus advanced a EUR 800 million deal for German safety-gear brand Uvex, signaling sustained private-equity interest.
- February 2025: United Rentals ended acquisition talks with H&E Equipment Services and restarted share buybacks to focus on integrated safety, productivity, and sustainability offerings.
- January 2025: OSHA introduced rules mandating properly fitting PPE and heat-illness prevention measures for construction workers.
- December 2024: Pye-Barker Fire and Safety completed 30 acquisitions in 2024, creating a nationwide integrated fire and security platform.


Global COVID-19 Safety and Prevention Products Market Report Scope
The scope of the market considers protective/preventive and treatment related products and equipments across ventilators, isolation chambers, masks, sanitizers, to name a few. Combined with regional analysis, the report gives and insight on exports, imports, tariffs, demand and supply situations by major manufactuers across each product type.
| Temperature Devices | Infrared Thermometers | ||
| Thermal Imagers | |||
| Ventilators | Invasive/Mechanical Ventilators | ||
| Non-invasive Ventilators | |||
| Isolation Chambers | |||
| Protective Face Masks | Cloth-Based Masks | ||
| Surgical Masks | |||
| Respirators | US Filter Class | N-Series | |
| P-Series | |||
| R-Series | |||
| European Filter Class | FFP1 | ||
| FFP2 | |||
| FFP3 | |||
| Hand Sanitizers and Disinfectants | Gel | ||
| Foam | |||
| Liquid | |||
| Wipes | |||
| Spray | |||
| Gloves | Rubber | ||
| PVC | |||
| Poly Chloroprene | |||
| Nitrile | |||
| Medical Gowns and Coveralls | Isolation | ||
| Surgical | |||
| Disposable | |||
| Re-usable | |||
| Other PPE (Face Shields, Goggles, Head and Shoe Covers) | |||
| UV-C Disinfection Devices | |||
| Hospitals and Clinics |
| Long-Term Care Facilities |
| Industrial and Manufacturing Sites |
| Individual /Household |
| Educational Institutions |
| Transportation and Logistics |
| Other End-users |
| Direct Institutional Procurement |
| Retail Pharmacies and Drug Stores |
| Online/E-commerce |
| Specialized PPE Distributors |
| North America | United States | |
| Canada | ||
| Mexico | ||
| South America | Brazil | |
| Argentina | ||
| Chile | ||
| Rest of South America | ||
| Europe | Germany | |
| United Kingdom | ||
| France | ||
| Italy | ||
| Spain | ||
| Russia | ||
| Rest of Europe | ||
| Asia-Pacific | China | |
| India | ||
| Japan | ||
| South Korea | ||
| Singapore | ||
| Malaysia | ||
| Australia | ||
| Rest of Asia-Pacific | ||
| Middle East and Africa | Middle East | United Arab Emirates |
| Saudi Arabia | ||
| Turkey | ||
| Rest of Middle East | ||
| Africa | South Africa | |
| Nigeria | ||
| Rest of Africa | ||
| By Product Type | Temperature Devices | Infrared Thermometers | ||
| Thermal Imagers | ||||
| Ventilators | Invasive/Mechanical Ventilators | |||
| Non-invasive Ventilators | ||||
| Isolation Chambers | ||||
| Protective Face Masks | Cloth-Based Masks | |||
| Surgical Masks | ||||
| Respirators | US Filter Class | N-Series | ||
| P-Series | ||||
| R-Series | ||||
| European Filter Class | FFP1 | |||
| FFP2 | ||||
| FFP3 | ||||
| Hand Sanitizers and Disinfectants | Gel | |||
| Foam | ||||
| Liquid | ||||
| Wipes | ||||
| Spray | ||||
| Gloves | Rubber | |||
| PVC | ||||
| Poly Chloroprene | ||||
| Nitrile | ||||
| Medical Gowns and Coveralls | Isolation | |||
| Surgical | ||||
| Disposable | ||||
| Re-usable | ||||
| Other PPE (Face Shields, Goggles, Head and Shoe Covers) | ||||
| UV-C Disinfection Devices | ||||
| By End-user | Hospitals and Clinics | |||
| Long-Term Care Facilities | ||||
| Industrial and Manufacturing Sites | ||||
| Individual /Household | ||||
| Educational Institutions | ||||
| Transportation and Logistics | ||||
| Other End-users | ||||
| By Distribution Channel | Direct Institutional Procurement | |||
| Retail Pharmacies and Drug Stores | ||||
| Online/E-commerce | ||||
| Specialized PPE Distributors | ||||
| By Geography | North America | United States | ||
| Canada | ||||
| Mexico | ||||
| South America | Brazil | |||
| Argentina | ||||
| Chile | ||||
| Rest of South America | ||||
| Europe | Germany | |||
| United Kingdom | ||||
| France | ||||
| Italy | ||||
| Spain | ||||
| Russia | ||||
| Rest of Europe | ||||
| Asia-Pacific | China | |||
| India | ||||
| Japan | ||||
| South Korea | ||||
| Singapore | ||||
| Malaysia | ||||
| Australia | ||||
| Rest of Asia-Pacific | ||||
| Middle East and Africa | Middle East | United Arab Emirates | ||
| Saudi Arabia | ||||
| Turkey | ||||
| Rest of Middle East | ||||
| Africa | South Africa | |||
| Nigeria | ||||
| Rest of Africa | ||||


Key Questions Answered in the Report
What is the current size of the safety and prevention products market?
The market stands at USD 7.67 billion in 2026 and is projected to reach USD 10.68 billion by 2031.
Which product segment grows fastest between 2026 and 2031?
UV-C disinfection devices record the highest growth at a 8.95% CAGR during the forecast period.
Why are transportation and logistics companies investing heavily in safety gear?
Fleet operators adopt connected worker solutions such as collision-avoidance sensors and fatigue monitors, driving a 8.62% CAGR in this end-user segment.
How is e-commerce changing safety equipment procurement?
Online platforms integrate with enterprise systems to automate compliance and offer real-time inventory data, pushing the channel to a 9.4% CAGR.
What regulatory trends shape future demand?
Tightening OSHA standards, EU circular economy directives, and stricter import quality inspections collectively raise the baseline for compliant, technology-enabled PPE.
Which regions present the strongest growth outlook?
Asia-Pacific leads with a 9.1% CAGR, propelled by regulatory modernization in markets such as Singapore, Malaysia, and Australia.
Page last updated on:


