Public Safety Analytics Market Size and Share
Market Overview
| Study Period | 2020 - 2031 |
|---|---|
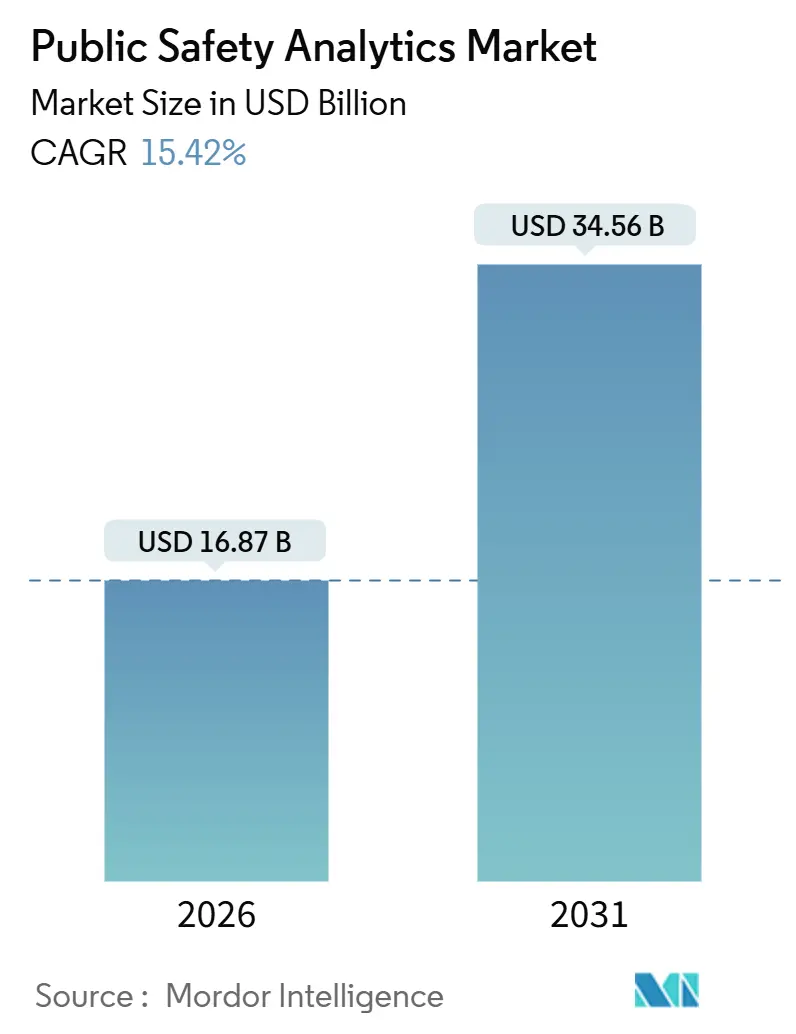
| Market Size (2026) | USD 16.87 Billion |
| Market Size (2031) | USD 34.56 Billion |
| Growth Rate (2026 - 2031) | 15.42% CAGR |
| Fastest Growing Market | Asia Pacific |
| Largest Market | North America |
| Market Concentration | Medium |
Major Players *Disclaimer: Major Players sorted in no particular order Image © Mordor Intelligence. Reuse requires attribution under CC BY 4.0. | |
Public Safety Analytics Market Analysis by Mordor Intelligence
The public safety analytics market size stood at USD 16.87 billion in 2026 and is projected to reach USD 34.56 billion by 2031, reflecting a 15.42% CAGR over the forecast period. The growth trajectory stems from federally mandated Next Generation 9-1-1 upgrades, algorithmic-transparency rules under the EU AI Act, and 5G-enabled edge nodes that stream real-time video from first responders. Vendors able to demonstrate audited datasets and bias-mitigation protocols now enjoy preferred-bidder status in European tenders. In the United States, federal opioid-crisis grants and FirstNet’s 5G core upgrades sustain high software and services demand, while Asia-Pacific city-digitization programs widen the global addressable base for end-to-end command-center platforms. Competitive intensity remains moderate as cloud-native specialists attack discrete use cases that legacy record-management incumbents have been slow to modernize.
Key Report Takeaways
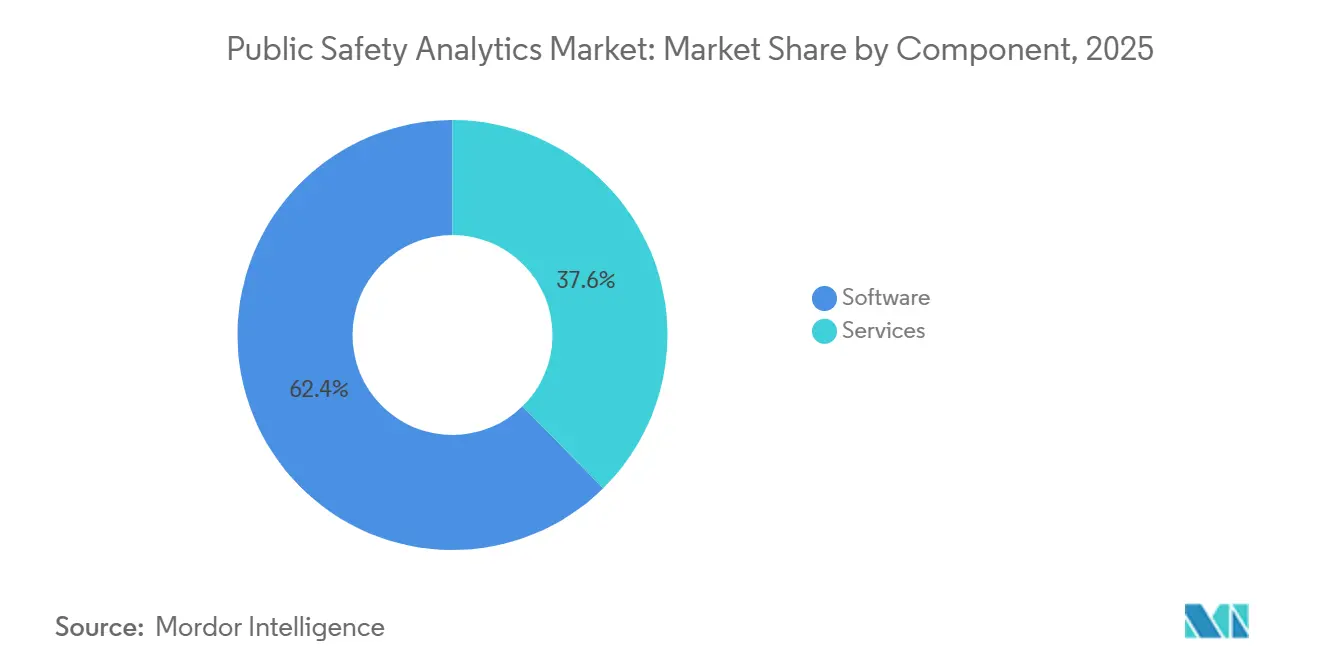
- By component, software led with 62.36% of the public safety analytics market share in 2025 while services are forecast to expand at a 17.02% CAGR through 2031.
- By analytics type, predictive analytics captured 38.63% revenue in 2025 whereas prescriptive analytics is advancing at a 16.43% CAGR to 2031.
- By deployment model, on-premises platforms accounted for 57.74% spending in 2025, yet cloud and Software-as-a-Service offerings are progressing at a 16.65% CAGR.
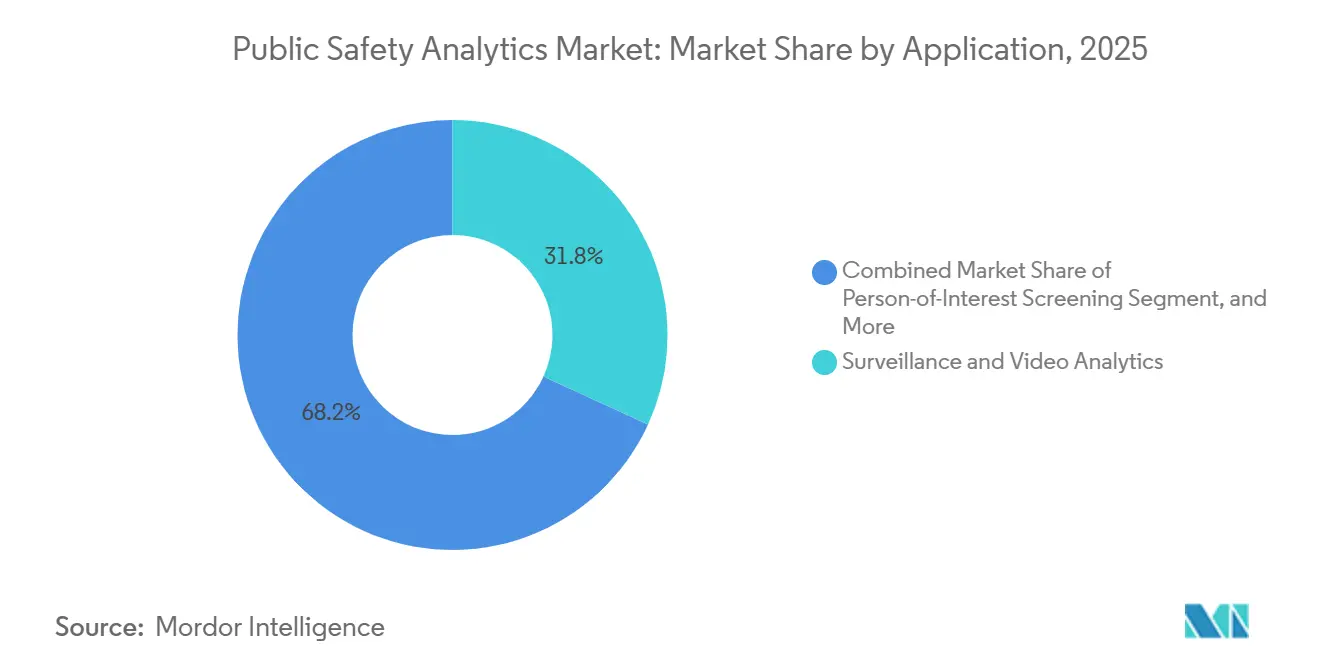
- By application, surveillance and video analytics commanded 31.83% revenue in 2025, while resource-allocation optimization is the fastest-expanding use case at 16.32% CAGR.
- By end-user, law enforcement held 32.84% spending in 2025 and transportation and critical infrastructure segments are growing at a 16.37% CAGR.
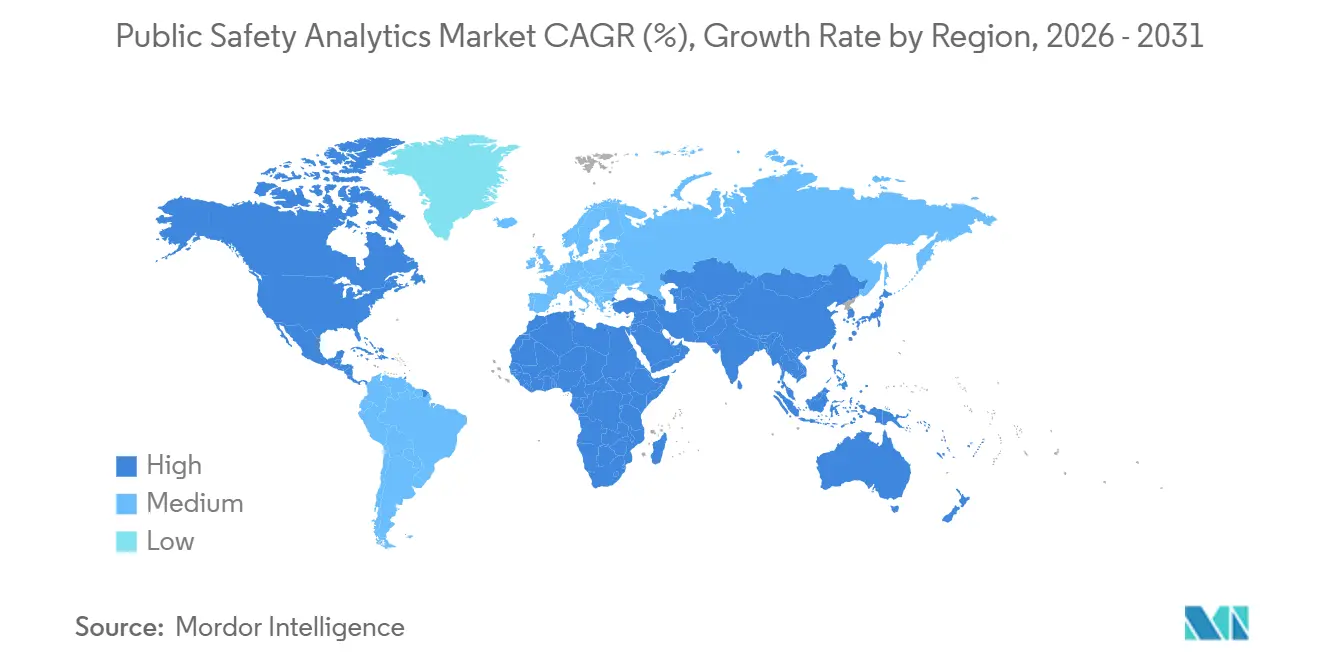
- By geography, North America contributed 38.74% revenue in 2025 whereas Asia-Pacific is registering the quickest regional CAGR at 16.54%.
Note: Market size and forecast figures in this report are generated using Mordor Intelligence’s proprietary estimation framework, updated with the latest available data and insights as of January 2026.
Global Public Safety Analytics Market Trends and Insights
Drivers Impact Analysis*
| Driver | (~) % Impact on CAGR Forecast | Geographic Relevance | Impact Timeline |
|---|---|---|---|
| Mandated NG 9-1-1 Data-Integration Rollouts | +3.8% | North America, with spillover to EU and Asia-Pacific adopting similar standards | Medium term (2-4 years) |
| EU AI Act Requirements for Algorithmic Transparency | +2.9% | Europe core, influencing global vendors serving EU jurisdictions | Short term (≤ 2 years) |
| Accelerating 5G Edge Deployments for First-Responder Video Streams | +3.2% | North America and Asia-Pacific core, early gains in urban metros | Medium term (2-4 years) |
| Rapid Urbanisation Spurring Smart-City Safety Platforms | +2.6% | Asia-Pacific and Middle East, with selective deployments in South America | Long term (≥ 4 years) |
| Federal Opioid-Crisis Funds Requiring Analytics-Led Prevention | +1.7% | North America, concentrated in states with high overdose rates | Short term (≤ 2 years) |
| Satellite EO and GNSS Data Becoming Budget-Line Items for Disaster Readiness | +1.2% | Global, with priority in disaster-prone regions (Asia-Pacific, South America, Africa) | Long term (≥ 4 years) |
| Source: Mordor Intelligence | |||
Mandated NG 9-1-1 Data-Integration Rollouts
The U.S. Federal Communications Commission’s November 2024 order obliges public safety answering points to ingest text, images, and video within 6–12 months of a formal request, pushing many counties to overhaul legacy dispatch platforms.[1]Federal Communications Commission, “FCC Finalizes Next Generation 9-1-1 Location Accuracy Rules,” fcc.gov Multimedia calls demand geospatial precision within 50 meters, a leap from cell-tower triangulation averages of 300 meters, and agencies that miss the deadline face civil-liability exposure demonstrated by recent litigation. Consortia purchasing models have emerged to help rural counties pool upgrade budgets, accelerating opportunities for cloud-native vendors.
EU AI Act Requirements for Algorithmic Transparency
The AI Act classifies law-enforcement analytics as high-risk and mandates audited datasets, bias-testing logs, and human-oversight controls by August 2026.[2]European Commission, “The EU AI Act: High-Risk AI Systems and Compliance Requirements,” digital-strategy.ec.europa.eu Proprietary black-box models now give way to dashboards that surface SHAP values and counterfactual explanations to meet evidentiary standards. Compliance costs favor enterprises with in-house legal teams, prompting smaller firms to partner or exit European procurements. The Act’s extraterritorial reach effectively globalizes transparency norms, influencing product roadmaps in North America and Asia-Pacific.
Accelerating 5G Edge Deployments for First-Responder Video Streams
FirstNet completed a USD 6.3 billion 5G standalone core upgrade in 2024, enabling sub-20-millisecond latency for body-camera and drone feeds in more than 50 U.S. metros.[3]FirstNet Authority, “FirstNet 5G Core Infrastructure and Edge Computing Deployment,” firstnet.gov Edge nodes process video locally, cutting backhaul by 70% and keeping biometric data inside jurisdictional borders. Fire departments in Los Angeles and Phoenix use edge-enabled thermal cameras to spot victims through smoke, trimming rescue times during wildfires.[4]Los Angeles Fire Department, “Edge-Enabled Thermal Cameras for Wildfire Response,” lafd.org However, rural counties face capital hurdles for ruggedized servers and small-cell densification.
Rapid Urbanization Spurring Smart-City Safety Platforms
China counts over 500 smart cities equipped with integrated public-safety analytics that blend surveillance, crowd sensing, and traffic management.[5]Government of China, “Smart-City Safety Platform Rollouts,” gov.cn India’s Smart Cities Mission funds AI-enabled cameras across 100 municipalities, automating unattended-baggage and collision alerts within 10 seconds. Gulf Cooperation Council cities embed public-safety modules inside broader city-tech rollouts, while Southeast Asian metros adopt command-and-control centers for flood and festival management. Interoperability lags due to proprietary data models, driving standards-body engagement.
Restraints Impact Analysis*
| Restraint | (~) % Impact on CAGR Forecast | Geographic Relevance | Impact Timeline |
|---|---|---|---|
| Litigation Risk from Algorithmic Bias Cases | -1.9% | North America and EU, with emerging scrutiny in APAC | Short term (≤ 2 years) |
| Fragmented Legacy RMS/CAD Data Silos Below County Level | -1.4% | North America, particularly in rural and under-resourced jurisdictions | Medium term (2-4 years) |
| Procurement-Cycle Delays Tied to Public-Tender Rules | -0.8% | Global, most pronounced in EU and South America | Medium term (2-4 years) |
| Scarcity of Cleared Data-Science Talent Inside Agencies | -1.1% | North America and EU, with acute shortages in specialized federal roles | Long term (≥ 4 years) |
| Source: Mordor Intelligence | |||
Litigation Risk from Algorithmic Bias Cases
Pasco County, Florida paid USD 105,000 in December 2024 to settle claims that a predictive-policing model disproportionately targeted minority neighborhoods. Similar lawsuits have driven several U.S. departments to pause deployments until external audits validate fairness metrics. Agencies now demand vendor indemnification clauses, inflating insurance premiums for software providers. Civil-liberties groups in San Francisco and Seattle disclosed racial-disparity rates through public-records requests, heightening reputational risks.
Fragmented Legacy RMS/CAD Data Silos Below County Level
Fewer than 40% of U.S. local agencies have adopted National Information Exchange Model standards, leaving neighboring jurisdictions unable to share incident data in real time. Proprietary on-premises platforms installed before 2015 persist in rural counties, with data-migration costs topping USD 500,000 for mid-sized departments. Fusion-center analysts confront inconsistent offense codes and missing geospatial tags, degrading predictive-model accuracy. Cloud consolidation offers a remedy but collides with data-sovereignty concerns.
*Our forecasts treat driver/restraint impacts as directional, not additive. The impact forecasts reflect baseline growth, mix effects, and variable interactions.
Segment Analysis
By Component: Services Gain Momentum as Talent Gaps Persist
Software remained the largest contributor, delivering 62.36% revenue in 2025. Record-management, investigation-management, and criminal-intelligence suites dominate because they plug directly into long-standing dispatch workflows and respect data-sovereignty mandates. Agencies prize modules that overlay geospatial layers on incident data and that backfill evidentiary chains which courts now expect in electronic form. Yet the services sub-segment is clocking a 17.02% CAGR, the fastest within the public safety analytics market. Professional-services teams handle data cleansing, legacy-system migration, and officer training, while managed-service contracts keep machine-learning models updated without straining in-house IT. A U.S. Office of Personnel Management tally showed more than 10,000 unfilled cleared-analytics positions in 2024, a gap that drives agencies to outsourced Public-Safety-as-a-Service agreements.
Demand for services also arises when small municipalities band together under volume contracts that bundle software licenses, cloud hosting, and 24/7 support. Vendors retain cleared data scientists who rotate across multiple counties, scaling scarce talent. As a result, services revenues will increasingly tie into outcome-based pricing schemes, with fees linked to response-time or crime-reduction benchmarks. The expanding role of services therefore not only cushions budget cycles but also deepens customer lock-in across the public safety analytics industry.


By Analytics Type: Prescriptive Capabilities Move Center Stage
Predictive analytics led revenue with a 38.63% slice in 2025, largely through crime-forecasting heat maps refreshed hourly to guide patrol routes. Prescriptive modules, growing at a 16.43% CAGR, fill that void by recommending ambulance repositioning or patrol redeployment. The U.S. Department of Health and Human Services earmarked part of a USD 1.5 billion opioid-crisis grant for overdose hot-spot routing, catalyzing prescriptive adoption in emergency medical services.
Prescriptive models demand high-quality, real-time input, pushing agencies to improve data-governance processes. Fire departments seeking to keep response times below the National Fire Protection Association’s six-minute benchmark employ reinforcement-learning loops to refine engine placement with every call outcome. The public safety analytics market size associated with prescriptive solutions is expected to widen most rapidly in jurisdictions where clean, structured data is already available from smart-city sensors.
By Deployment Model: Hybrid Cloud Threads the Needle on Sovereignty
On-premises systems absorbed 57.74% spending in 2025, a testament to deep-seated concerns about housing criminal evidence in multitenant clouds. State statutes often stipulate that personally identifiable data remain within borders, and only a handful of hyperscalers have achieved FedRAMP High status. However, compute-heavy video analytics make rigid on-premises architectures costly. Hybrid designs that keep raw video local but burst inference workloads to FedRAMP-certified clouds are therefore scaling at a 16.65% CAGR.
Microsoft Azure Government and Amazon Web Services GovCloud both received FedRAMP High authorization by 2024, easing migration fears for federal agencies. Axon’s cloud suite demonstrates how evidence is redacted and transcribed in the cloud while master files stay on agency servers. Cost-benefit analyses show that hybrid models can trim total cost of ownership by 20% over five years, savings that resonate with budget officers and accelerates cloud momentum inside the public safety analytics market.
By Application: Resource-Allocation Optimization Takes Off
Surveillance and video analytics dominated with 31.83% revenue in 2025 as body-camera mandates proliferated. Generative-AI transcription tools now auto-draft incident reports, freeing officers for field work. Yet resource-allocation optimization is the fastest climber at 16.32% CAGR. The Los Angeles Fire Department cut average response times by 8% after deploying a platform that repositions apparatus in real time based on historical call density and current traffic.
As smart-city sensors stream occupancy, weather, and special-event data into command centers, prescriptive engines ingest those feeds to predict surge demand. Public-transport agencies also use the algorithms to adjust staffing at rail hubs prone to crowding. Consequently, the public safety analytics market size tied to resource-allocation optimization is expected to show the sharpest absolute gains through 2031.

By End-User: Critical Infrastructure Operators Accelerate Spend
Law-enforcement agencies remained the largest buyers with 32.84% spending in 2025, spanning case-management, evidence tracking, and community-engagement dashboards. However, transportation and critical-infrastructure entities are expanding budgets at a 16.37% CAGR. Airports now deploy anomaly-detection video analytics that flag unattended bags in seconds, while electric-utility operators integrate radar and acoustic sensors to meet tightening North American Electric Reliability Corporation mandates.
Port authorities rely on cargo-flow anomaly detection to spot contraband, and rail operators fuse passenger-density analytics with threat-detection feeds for safer operations. With uptime mandated by regulators, critical-infrastructure operators contract for service-level agreements that include predictive maintenance, embedding themselves as a durable growth vector inside the public safety analytics industry.
Geography Analysis
North America generated 38.74% of 2025 revenue, powered by United States investments in NG 9-1-1, opioid-crisis analytics, and FirstNet’s 5G edge rollouts. Provinces in Canada are consolidating municipal systems into provincial command centers to improve interoperability, while Mexico focuses deployments along border corridors and metropolitan hubs. Adoption in smaller U.S. counties is rising through state-negotiated consortia contracts that distribute upgrade costs.
Europe’s share reflects rapid uptake in Germany, the United Kingdom, France, Italy, and Spain, all of which must meet the EU AI Act’s transparency mandates by 2026. Nordic countries demonstrate high digital maturity, using prescriptive allocation models across firefighting and emergency medical services. Tender timelines, however, extend procurement cycles beyond 18 months in many EU jurisdictions, slowing the otherwise robust expansion of the public safety analytics market.
Asia-Pacific charts the fastest CAGR at 16.54% as China’s 500-plus smart-city program mainstreams license-plate readers, crowd sensors, and incident-management suites. India’s 100-city initiative, plus Gulf Cooperation Council megaprojects like NEOM, inject steady order flow. Japan and South Korea integrate seismic sensors with analytics to automate earthquake alerts, while Australia deploys satellite GNSS feeds for wildfire prediction. Despite infrastructure gaps in Africa and budget constraints in parts of South America, São Paulo and Buenos Aires showcase integrated command centers blending social-media monitoring with emergency hotlines, illustrating the broader regional potential of the public safety analytics market.

Competitive Landscape
Moderate concentration prevails, with the top five suppliers holding roughly 40-45% collective share, leaving headroom for disruptors offering prescriptive modules, satellite-data fusion, or gunshot-detection subscriptions. Incumbents such as Motorola Solutions and Tyler Technologies leverage entrenched record-management and dispatch footprints to cross-sell analytics add-ons, increasing average contract values. Cloud-native challengers pursue open-API strategies that interoperate with legacy systems, winning agencies that prefer incremental modernization.
Strategic moves cluster around AI-talent acquisitions, FedRAMP High certifications, and partnerships with satellite-imagery providers. For instance, multiple vendors integrated wildfire-risk layers derived from earth-observation feeds, appealing to Western U.S. agencies confronting record fire seasons. Explainability is now table stakes; Palantir embeds SHAP diagnostic tools that let detectives interrogate why a location surfaces as a hot spot without scripting SQL queries.
Pricing models evolve toward outcomes, with performance clauses linked to response-time metrics or crime-rate deltas. Although litigation risks temper aggressive deployments, vendors that offer indemnity and bias-testing toolkits differentiate themselves. Over the medium term, mergers among mid-tier firms are likely as scale proves critical for absorbing regulatory overhead inside the public safety analytics market.
Public Safety Analytics Industry Leaders
Splunk Inc. (Cisco Systems Inc.)
SAS Institute Inc.
IBM Corporation
Tyler Technologies Inc.
Omnigo (The Riverside Company)
- *Disclaimer: Major Players sorted in no particular order

Recent Industry Developments
- December 2025: Los Angeles Fire Department expanded its prescriptive-dispatch platform citywide after an 8% pilot reduction in response times.
- September 2025: Workday faced an age-bias lawsuit targeting its AI-driven hiring screens, broadening scrutiny of public-sector algorithms.
- March 2025: The 2025 National Drug Threat Assessment by the Drug Enforcement Administration credits intelligence-led operations and advanced analytics for a 25% reduction in overdose deaths.
- March 2025: Ondas Holdings and Palantir partnered to integrate Foundry analytics into autonomous drones, enhancing workflows and expanding defense and public safety applications.


Research Methodology Framework and Report Scope
Market Definitions and Key Coverage
Our study defines the public safety analytics market as all revenue earned from software platforms and linked professional services that collect, fuse, and analyze multi-source data, including video, CAD logs, IoT sensor streams, and social media, for threat detection, resource deployment, and incident resolution. According to Mordor Intelligence, coverage spans predictive, descriptive, diagnostic, and prescriptive modules delivered on-premise or through SaaS to law enforcement, emergency medical, firefighting, transportation, and critical infrastructure agencies worldwide.
Scope Exclusions: Hardware such as cameras, radios, and barricades, as well as internal HR or payroll analytics, are not counted.
Segmentation Overview
- By Component
- Software
- Record Management
- Investigation Management
- Location/Geo-Spatial Intelligence
- Criminal and Crime Intelligence
- Predictive and Prescriptive Modules
- Services
- Professional Services
- Managed / PSaaS
- Software
- By Analytics Type
- Descriptive Analytics
- Diagnostic Analytics
- Predictive Analytics
- Prescriptive Analytics
- By Deployment Model
- On-Premise
- Cloud / SaaS
- By Application
- Person-of-Interest Screening
- Surveillance and Video Analytics
- Incident Detection and Management
- Pattern Recognition and Hot-Spot Mapping
- Resource-Allocation Optimisation
- By End-User
- Law Enforcement
- Emergency Medical and EMS
- Firefighting and Rescue
- Transportation and Critical Infrastructure
- Other Government Agencies
- By Geography
- North America
- United States
- Canada
- Mexico
- South America
- Brazil
- Argentina
- Rest of South America
- Europe
- Germany
- United Kingdom
- France
- Italy
- Spain
- Rest of Europe
- Asia-Pacific
- China
- India
- Japan
- South Korea
- Australia and New Zealand
- Rest of Asia-Pacific
- Middle East
- Saudi Arabia
- United Arab Emirates
- Turkey
- Rest of Middle East
- Africa
- South Africa
- Nigeria
- Egypt
- Rest of Africa
- North America
Detailed Research Methodology and Data Validation
Primary Research
Mordor analysts interviewed city CIOs, police data science leads, fire command chiefs, and regional system integrators across North America, Europe, Asia-Pacific, and the GCC. These conversations validated platform fee structures, deployment backlogs, and forecast assumptions that secondary sources could not fully illuminate.
Desk Research
We gathered core indicators from openly available tier-1 sources such as the US Bureau of Justice Statistics, Eurostat crime and rescue datasets, UNODC incident counts, and FCC/NENA filings that detail NG911 rollouts. Trade associations, including IJIS Institute white papers and Smart Cities Council dashboards, helped us trace adoption of edge AI video platforms. Annual reports and 10-Ks from leading software vendors, plus patent families pulled via Questel, clarified technology intensity and pricing skews.
Shipment and license flow trends were further cross-checked through Volza customs records, while news sweeps on Dow Jones Factiva flagged material contract wins and funding rounds. This list is illustrative; many additional public and proprietary references informed the desk phase.
Market-Sizing & Forecasting
A top-down build starts with public sector ICT spend, filtered to safety functions and then tempered by analytics penetration ratios derived from respondent interviews and smart city grant data. Supplier roll-ups of sampled annual contract value (ACV) and average seat pricing provide a bottom-up sense check before totals are locked. Key variables feeding the model include 1) annual 911/112 call volumes, 2) installed base of IP cameras, 3) urban population above one million, 4) number of sworn officers per 10k residents, and 5) cloud migration share. A multivariate regression with ARIMA overlay projects each driver through 2030, letting us stress test growth under conservative and accelerated digital investment scenarios. Gaps in vendor roll-ups, common in smaller municipalities, are bridged with imputed averages from matched peer clusters.
Data Validation & Update Cycle
Outputs face variance checks against historical crime clearance rates and smart city budget outlays; anomalies trigger re-contact of experts. Two senior reviewers sign off on every model. We refresh annually and issue interim updates when major legislation, mergers, or funding surges occur.
Why Mordor's Public Safety Analytics Baseline Stays Reliable
Published figures often diverge because firms pick dissimilar solution mixes, assume different adoption ramps, or freeze exchange rates at varied points. Our disciplined scope and annual refresh cadence reduce drift.
Key gap drivers include some studies that fold broader 'public safety & security' hardware into totals, others that rely on enterprise IT spend proxies without primary validation, and several that convert regional currencies only once per forecast cycle.
Benchmark comparison
| Market Size | Anonymized source | Primary gap driver |
|---|---|---|
| USD 14.60 B (2025) | Mordor Intelligence | - |
| USD 13.00 B (2024) | Global Consultancy A | combines analytics with basic reporting tools and uses one-time FX rates |
| USD 8.29 B (2024) | Regional Forecasting Center B | excludes managed services and applies conservative penetration multipliers |
| USD 12.14 B (2025) | Industry Publisher C | limited primaries; heavier reliance on vendor press releases for totals |
Taken together, the comparison shows that Mordor's blend of documented scope, dual track modeling, and live expert inputs delivers a balanced, transparent baseline that decision makers can trace back to clear drivers and replicate with confidence.


Key Questions Answered in the Report
How large is the public safety analytics market in 2026?
The public safety analytics market size reached USD 16.87 billion in 2026.
What CAGR is projected for public safety analytics to 2031?
The sector is forecast to expand at a 15.42% CAGR through 2031.
Which component grows fastest inside public safety analytics platforms?
Services, including managed and professional offerings, are advancing at a 17.02% CAGR as agencies outsource data-science expertise.
Why is prescriptive analytics gaining traction among public-safety agencies?
Prescriptive modules recommend concrete actions, such as ambulance repositioning, and are expanding at a 16.43% CAGR thanks to opioid-prevention grants and response-time mandates.
Page last updated on:


