Control Valve Market Size and Share
Market Overview
| Study Period | 2020 - 2031 |
|---|---|
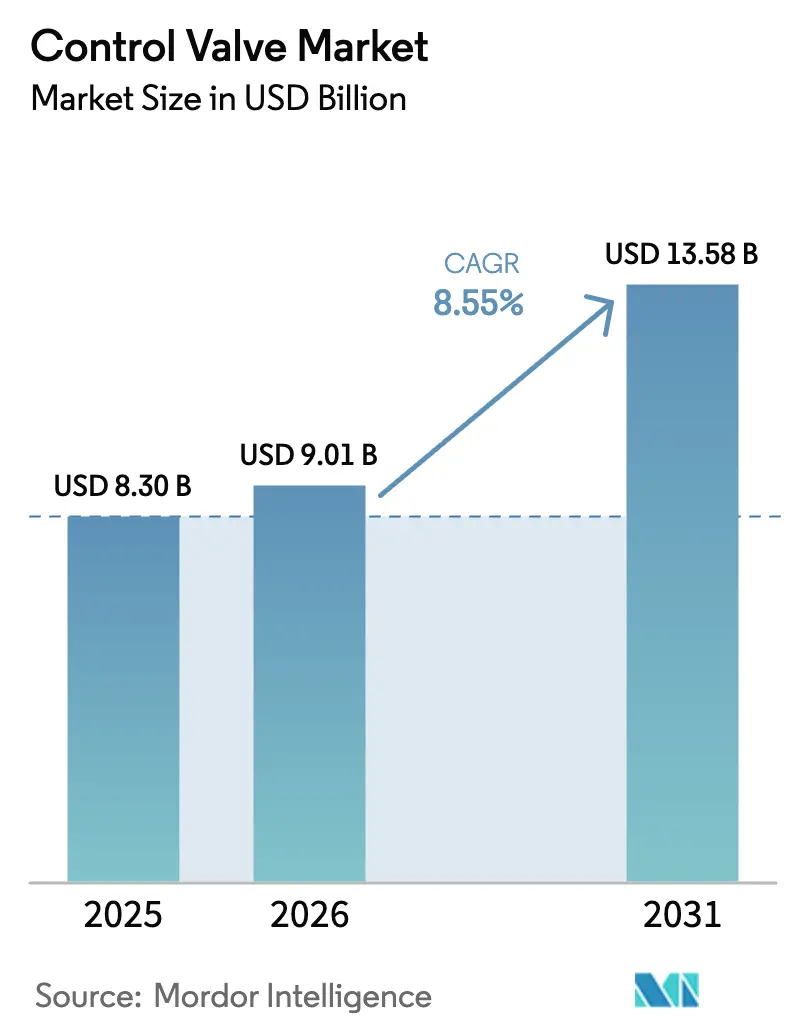
| Market Size (2026) | USD 9.01 Billion |
| Market Size (2031) | USD 13.58 Billion |
| Growth Rate (2026 - 2031) | 8.55% CAGR |
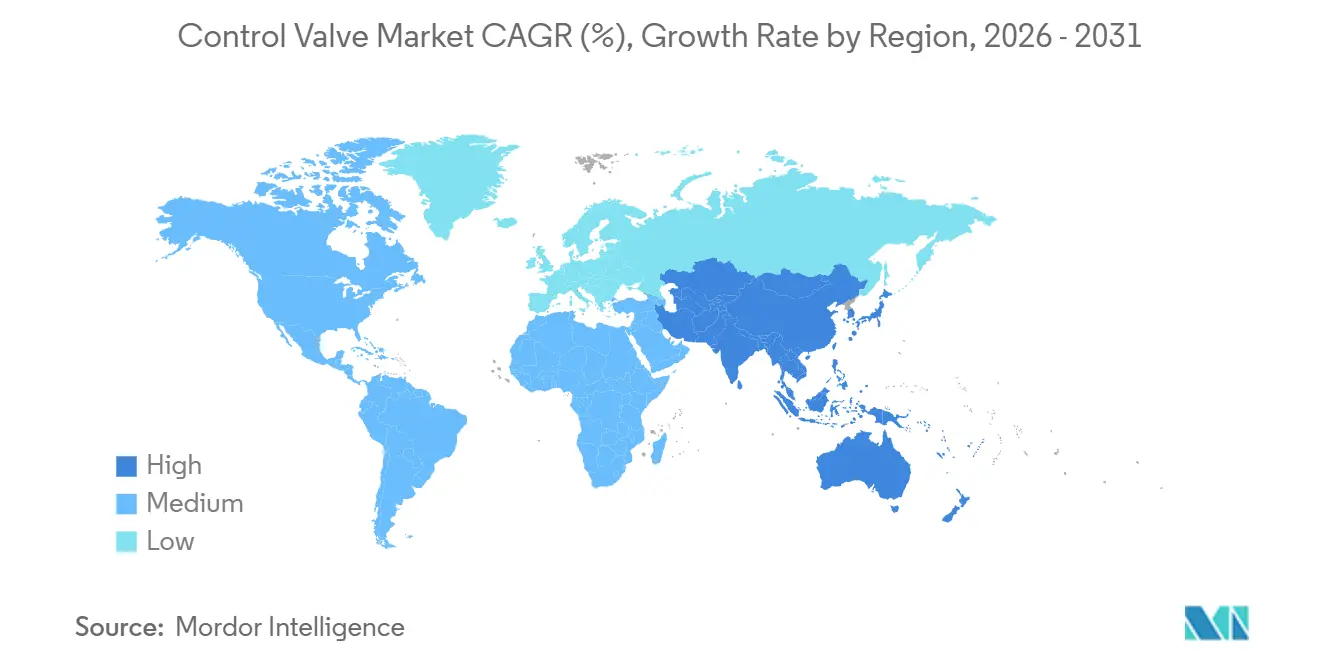
| Fastest Growing Market | Asia Pacific |
| Largest Market | North America |
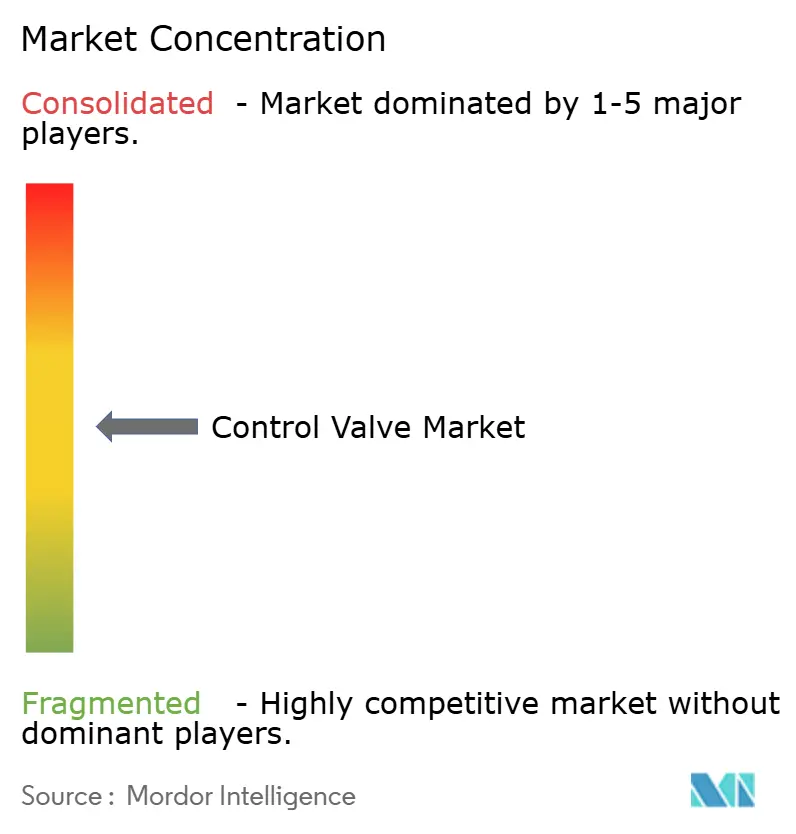
| Market Concentration | Medium |
Major Players *Disclaimer: Major Players sorted in no particular order Image © Mordor Intelligence. Reuse requires attribution under CC BY 4.0. | |
Control Valve Market Analysis by Mordor Intelligence
The control valve market size stood at USD 9.01 billion in 2026 and is projected to advance to USD 13.58 billion by 2031, registering an 8.55% CAGR during the forecast period. Elevated global spending on water infrastructure, stringent fugitive-emission mandates, and the engineering demands of hydrogen and small modular reactor (SMR) projects redirect capital toward higher-specification flow-control equipment. Vendors able to supply low-leakage packing, severe-service trim, and smart digital positioners are winning multi-plant framework agreements with utilities, pharmaceutical majors, and energy producers. Mergers among large Western suppliers aim to marry vast installed bases with software analytics, while smaller Asian manufacturers capture commodity volumes in isolation and on-off duties by leveraging cost advantages. At the application level, biologics manufacturing, advanced wastewater treatment, and SMR construction collectively open long-duration order books that dilute the historic cyclicality tied to upstream oil and gas spending.
Key Report Takeaways
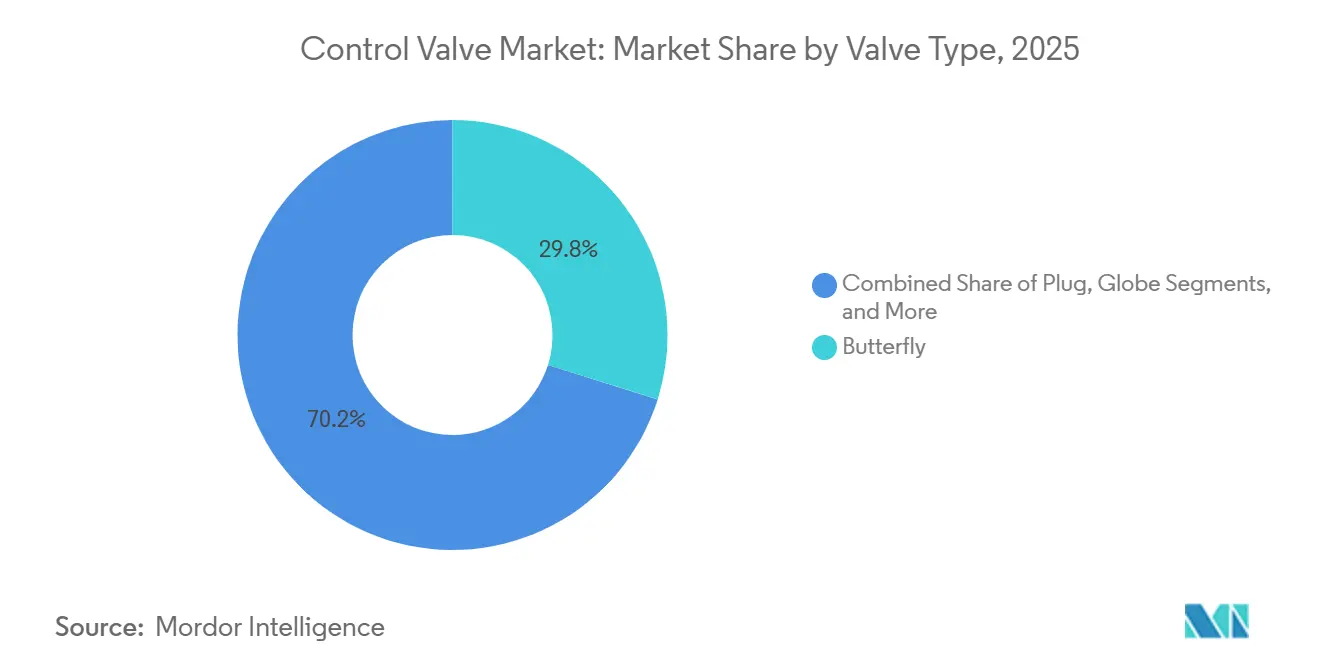
- By valve type, butterfly valves led with 29.84% revenue share in 2025 of the control valve market; plug valves are projected to expand at a 9.03% CAGR through 2031.
- By actuation technology, pneumatic actuators commanded 47.73% share of the control valve market size in 2025, while electric actuators are set to post the fastest 10.02% CAGR to 2031.
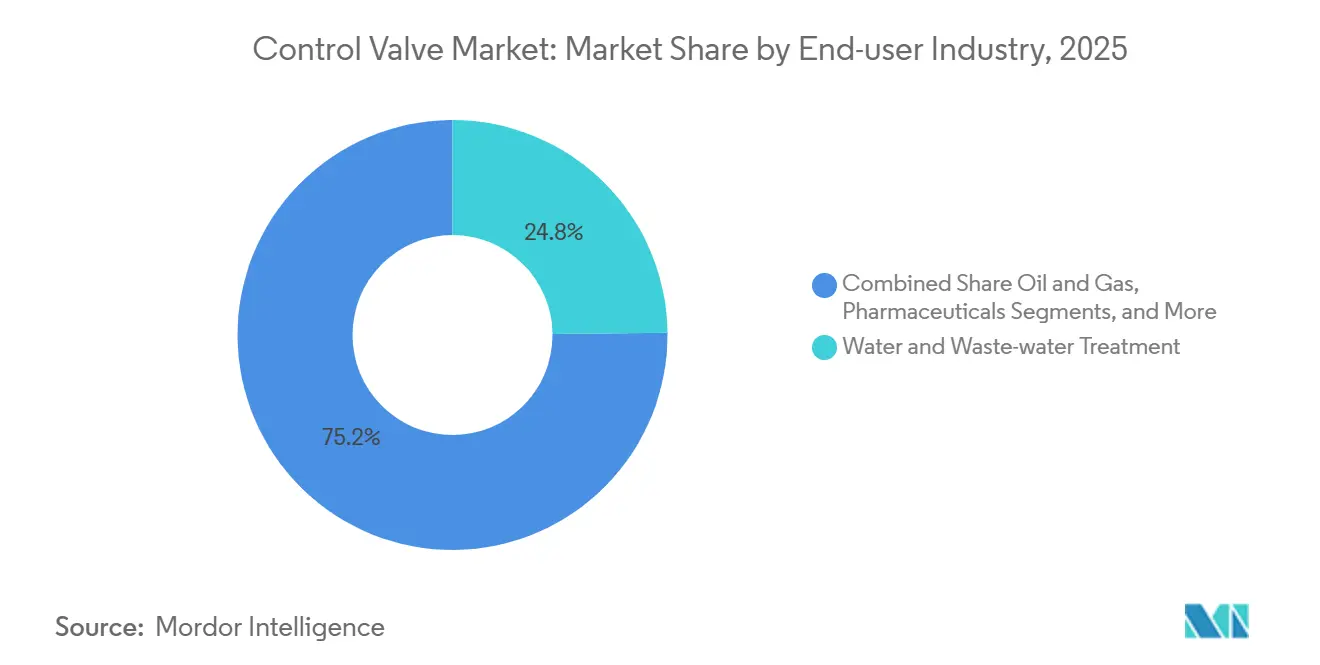
- By end-user industry, water and wastewater treatment accounted for a 24.84% share of the control valve market size in 2025, whereas pharmaceuticals are forecast to grow at 9.05% CAGR through 2031.
- By material, steel held 41.83% of the control valve market share in 2025; alloy-based valves will record the quickest 9.97% CAGR during the outlook period.
- By geography, North America captured 38.73% of 2025 revenue of the control valve market, yet Asia-Pacific is projected to register the highest 9.69% CAGR to 2031.
Note: Market size and forecast figures in this report are generated using Mordor Intelligence’s proprietary estimation framework, updated with the latest available data and insights as of January 2026.
Global Control Valve Market Trends and Insights
Drivers Impact Analysis*
| Driver | (~) % Impact on CAGR Forecast | Geographic Relevance | Impact Timeline |
|---|---|---|---|
| Rising investments in water and wastewater infrastructure | +1.2% | Global, with concentration in North America, Europe, and Asia-Pacific urban centers | Medium term (2-4 years) |
| Modernization of aging power and process plants | +1.5% | North America and Europe, with spillover to Middle East and Asia-Pacific coal-to-gas conversions | Long term (≥ 4 years) |
| Stringent environmental regulations on emissions | +1.8% | Global, led by North America and EU regulatory enforcement; emerging in Asia-Pacific | Short term (≤ 2 years) |
| Surging post-pandemic pharmaceutical capacity expansions | +1.4% | North America, Europe, and Asia-Pacific (India, Singapore, China) | Medium term (2-4 years) |
| Hydrogen-economy scale-up requiring high-pressure valves | +1.0% | Europe (green hydrogen), Middle East (blue hydrogen), North America (industrial hydrogen hubs) | Long term (≥ 4 years) |
| SMR rollout driving demand for severe-service valves | +0.8% | North America (US, Canada), Europe (UK, Sweden), Asia-Pacific (China, South Korea) | Long term (≥ 4 years) |
| Source: Mordor Intelligence | |||
Rising Investments in Water and Wastewater Infrastructure
Global utilities are executing the largest capital replacement cycle in three decades. The United States Infrastructure Investment and Jobs Act allocates USD 65 billion over 10 years for water projects, prompting a wholesale switch from manual gate valves to automated butterfly and ball formats with remote diagnostics.[1]The White House, “Infrastructure Investment and Jobs Act,” whitehouse.gov Severn Trent Water’s GBP 200 million (USD 254 million) Minworth upgrade illustrates how European tenders bundle control, safety, and signaling packages into single multi-year lots. Emerging Asia-Pacific markets follow suit, fueled by ASEAN foreign direct investment that rose 44% between 2021 and 2024, channeling USD 13 billion into water infrastructure.[2]UNCTAD, “ASEAN Investment Report 2025,” unctad.org Utilities favor compact automated butterfly valves coupled with wireless positioners, cutting confined-space entries and extending inspection intervals mandated by EPA leak-detection programs. Valve suppliers now earn recurring revenue from diagnostics software that reduces unplanned downtime by up to 30%, creating service annuities atop hardware sales.
Modernization of Aging Power and Process Plants
Coal-to-gas conversions and fast-cycling combined-cycle gas turbines replace decades-old trim designs with cage-guided globe valves able to withstand high thermal swings. A 2025 regulating-valve retrofit in a North American turbine cooling circuit improved minimum-load capability while enabling hydrogen-ready fuel blends. Digital platforms integrate valve health with plant DCS, letting operators ramp units to meet intermittent renewable profiles without violating ramp-rate constraints. In process industries, Bluetooth-enabled electric actuators allow technicians to access diagnostics in hazardous areas without hot-work permits, extending asset life by 15-20 years and trimming fugitive emissions below tightening thresholds.
Stringent Environmental Regulations on Emissions
EPA 40 CFR 63 caps leaks at 500 ppm for valves in light-liquid service and mandates repair within 15 days, an edict driving widespread adoption of low-emission packing that achieves sub-100 ppm leakage.[3]United States Environmental Protection Agency, “40 CFR Part 264—Standards for Owners and Operators of Hazardous Waste Treatment, Storage, and Disposal Facilities,” ecfr.gov European counterparts enforce similar rules, while IEC 61508 functional-safety standards push chemical operators toward bellows-seal bonnets for near-zero stem leakage. Suppliers offer duplex PTFE-graphite packing rated to 51.7 bar and 232 °C, allowing plants to extend monitoring intervals from monthly to quarterly. Digital positioners automatically compile audit trails, slashing compliance reporting labor and cementing software as a profit center for the control valve market.
Surging Post-Pandemic Pharmaceutical Capacity Expansions
Manufacturers committed more than USD 25 billion to new biologics campuses between 2024 and 2026, including Eli Lilly’s USD 13 billion multistate program and Novo Nordisk’s USD 8.5 billion North Carolina hub. Cleanroom automation demands diaphragm and pinch valves with 3-A and EHEDG certifications, plus electric actuators delivering sub-0.1% positioning accuracy for continuous manufacturing skids. Wireless valve controllers reduce technician exposure in aseptic suites, while predictive maintenance maintains batch integrity and uptime. Suppliers with validation expertise command premium pricing and long-term service contracts, making pharmaceuticals the fastest-growing vertical in the control valve market.
Restraints Impact Analysis*
| Restraint | (~) % Impact on CAGR Forecast | Geographic Relevance | Impact Timeline |
|---|---|---|---|
| Oil-price volatility curbing oil and gas CAPEX | -1.5% | Global, with highest impact in North America shale, Middle East upstream, and offshore deepwater projects | Short term (≤ 2 years) |
| Pricing pressure from low-cost Asian suppliers | -0.9% | Global, with most acute impact in North America and Europe mid-tier suppliers | Medium term (2-4 years) |
| Alloy supply-chain disruptions | -0.6% | Global, with concentration in regions dependent on Chinese rare earth and nickel imports | Medium term (2-4 years) |
| Cyber-security risks in smart positioners | -0.3% | Global, with highest concern in critical infrastructure sectors (power, water, oil and gas) | Short term (≤ 2 years) |
| Source: Mordor Intelligence | |||
Oil-Price Volatility Curbing Oil and Gas CAPEX
Commodity swings dampen exploration appetite, deferring greenfield pipeline and LNG projects that rely heavily on high-value valves. Australian Energy Producers note that the country attracted only 1.2% of global exploration spending over five years, underscoring a conservative investment climate. PETRONAS’ 2025-2027 outlook echoes this caution, emphasizing brownfield optimization over capacity expansion. While baseline maintenance keeps the installed base active, short-cycle discretionary spending remains at risk until pricing visibility improves. Deferred megaprojects such as Dow’s USD 8.5 billion Fort Saskatchewan complex eliminate multiyear valve procurement pipelines, tempering the otherwise robust expansion of the control valve market.
Pricing Pressure from Low-Cost Asian Suppliers
Chinese exporters shipped USD 588 million worth of check valves in 2023, underpricing Western competitors by 20-40%. Firms such as Neway leverage vertical integration and scale to win bids for commodity on-off valves, forcing North American and European mid-tier suppliers either to specialize in severe-service niches or relinquish share. End-users increasingly dual-source, awarding critical loops to premium brands while assigning auxiliary service to low-cost vendors, compressing volumes and margins in the control valve industry across mature economies.
*Our forecasts treat driver/restraint impacts as directional, not additive. The impact forecasts reflect baseline growth, mix effects, and variable interactions.
Segment Analysis
By Valve Type: Plug Valves Gain Traction in Slurry Lines
Plug valves accounted for a modest portion of 2025 revenue yet are poised to post a 9.03% CAGR to 2031 as mining, pulp, and wastewater operators favor their self-cleaning, abrasion-resistant design. In contrast, butterfly valves dominated with 29.84% share thanks to their compact footprint in large-diameter water mains, although pressure-class limitations restrain their growth in severe service. The control valve market for plug valves is set to grow as slurry pipelines and mineral concentrators retrofit legacy globe valves to reduce downtime. Suppliers market hardened plug sleeves and live-loaded packing to extend mean time between failures, while operators cite easier automation with quarter-turn actuators compared with linear globe configurations. Continuous-process plants also appreciate the lower torque demands, permitting adoption of smaller electric drives that align with energy-efficiency programs.
Globe and ball variants remain indispensable in high-pressure and emergency shutdown duties, respectively, but their higher capex and space requirements temper growth. Product differentiation, therefore, centers on trim geometry and noise-attenuation cages that cut cavitation by up to 35 dB, features especially valued in SMR steam circuits. Ramén’s ball-sector design illustrates how niche engineering, originally created for Swedish pulp mills, can migrate into wider slurry services. As global demand for copper, lithium, and rare-earth ores accelerates, abrasive media handling will underpin steady uptake of plug valves within the control valve market.


By Actuation Technology: Electric Momentum Challenges Pneumatic Leadership
The electric segment will record a 10.02% CAGR through 2031, outpacing pneumatic alternatives that still commanded 47.73% share in 2025. Lower total cost of ownership stems from eliminating compressed-air generation, which can absorb 10-30% of a plant’s electricity. Modern brushless-DC motors, silicon-carbide inverters, and onboard power electronics enable precise step changes, facilitating advanced model-predictive control. Remote firmware upgrades and Bluetooth diagnostics, exemplified by Rotork’s IQ4 and AUMA’s MATIC AM ranges, reduce technician travel and improve safety in confined spaces. Consequently, segment revenues tied to digital service contracts expand alongside hardware shipments, reinforcing the annuity profile of the control valve market.
Pneumatic actuators remain favored where intrinsic fail-safe action is paramount, especially in hydrocarbon processing units regulated by ATEX and IECEx. Hybrid packages combine pneumatics for safety shutoff with electric drives for fine throttling, a design growing popular in hydrogen compression skids that must accommodate both explosion-risk mitigation and millisecond-level stroke resolution. Hydraulic options stay confined to subsea and extra-large penstock gates, leaving the competitive frontier squarely between electric and pneumatic systems.
By End-User Industry: Pharmaceuticals Lead Growth Curve
Water and wastewater retained the single largest slice at 24.84% in 2025, yet the pharmaceutical sector is forecast to expand at 9.05% CAGR, outpacing every other vertical. Biologics plants require thousands of diaphragm, pinch, and mini-ball valves validated to USP Class VI, with automated clean-in-place sequences driving additional actuator demand. The control valve market share for suppliers that meet good manufacturing practice standards rises as firms bundle documentation, material traceability, and lifecycle support into procurement criteria. Water utilities, in turn, continue long replacement cycles but face budget ceilings, especially in emerging economies.
Oil and gas, chemicals, and power remain volume engines but face uncertainty amid the energy transition. Small modular reactors and blue-hydrogen initiatives introduce new severe-service specifications, expanding alloy demand and diagnostics content per valve. Metals, mining, and pulp producers select abrasion-resistant or medium-consistency designs, showing stable if unspectacular expansion linked to commodity cycles. Overall, pharmaceutical margins and regulatory barriers shield suppliers from low-cost challengers, granting them a disproportionately positive impact on the overall control valve market.
By Material: Steel Dominates as Plastics Gain Share
Steel still dominated with 41.83% revenue in 2025, but alloy-based products will clock a 9.97% CAGR as hydrogen pipelines, carbon-capture plants, and SMRs specify duplex stainless, Inconel, and Hastelloy grades for embrittlement and corrosion resistance. The control valve market size tied to alloys benefits from ASME B31.12-2023, which codifies hydrogen-specific design rules. Tight nickel supply, identified by the U.S. Department of Energy as a near-critical risk, pushes OEMs to diversify sourcing and adopt additive manufacturing to reduce material waste.
Cast iron remains relevant in gravity-fed water networks, while engineered plastics dominate ultrapure acid and semiconductor wet-bench niches. Still, longer-term momentum clearly favors nickel- and chromium-rich alloys, aligning material strategy with the decarbonization trajectory of the control valve market. Alloy-based titanium and nickel grades sustain small but lucrative demand in offshore topsides and chlorine production where chloride stress-corrosion is acute. Geopolitical friction around nickel supply widens lead times, prompting OEMs to dual-source castings and co-develop additive manufacturing routes to secure critical materials.
Geography Analysis
North America generated 38.73% of 2025 revenue, underpinned by USD 65 billion in federal water funding, USD 15 billion in announced pharmaceutical expansions, and upstream CAPEX expected to add USD 77 billion by 2030. EPA fugitive-emission rules accelerate adoption of low-leakage packing and digital controllers, while the Chart-Flowserve merger forms a USD 19 billion entity positioned to dominate aftermarket services. Canada’s first BWRX-300 SMR at Darlington further lifts severe-service demand, with Velan booked to supply critical valves.
Asia-Pacific is the fastest-growing region at a 9.69% CAGR to 2031. ASEAN attracted USD 226 billion in FDI during 2024, with manufacturing inflows up 147% and electronics commanding 27% of greenfield value. Semiconductor fabs and data centers in Singapore, Malaysia, and Vietnam propel orders for ultrapure-water and cooling valves. India’s 8.2% GDP growth and 28% jump in federal capex turbocharge infrastructure pipelines, while China’s dominance in rare-earth processing provides local actuator suppliers with cost leverage, reshaping the competitive map of the control valve market.
Europe exhibits steady replacement demand driven by emission regulations and power-plant conversions, even as deindustrialization pressures slow new capacity. In the Middle East and Africa, low breakeven oil fields, petrochemical diversification, and blue-hydrogen megaprojects sustain a robust project slate. Baker Hughes’s 2024 expansion of its Dukhan facility and Emerson’s USD 150 million automation award for an Egyptian ethylene complex exemplify sizable regional orders. South America depends on Brazil’s deepwater programs and Argentina’s shale rollout, though political volatility remains a headwind.

Regulatory Landscape
Control valve design, testing, and documentation are shaped by emissions-compliance rules, functional-safety requirements, and actuator-interface standards across major regions. In the United States, EPA leak requirements used in process industries, including 40 CFR 63 leak thresholds and repair timelines for valves in light-liquid service, keep low-emission packing, audit trails, and documented maintenance workflows central to procurement. ISA control-valve standards (ISA-75 series) are also commonly referenced in specifications.
In Europe, CEN updates have tightened conformity expectations for valve assemblies used in safety-instrumented functions and pressure systems, including EN 17955:2024 on functional safety and EN 16668:2025 for metallic valves as pressure accessories. On the component side, ISO published ISO 5211:2026 for part-turn actuator attachments and ISO 22109:2026 for valve gearboxes, supporting interchangeability and standardization in automated valve packages. Trade and technology controls also influence sourcing for digital positioners and electronics, with U.S. actions in 2024-2026 affecting procurement pathways for semiconductor-related components used in industrial control equipment supply chains.
Value Chain Analysis
The control valve value chain begins with raw materials and semi-finished inputs (steel and high-alloy castings/forgings, seals and packing, and electronics for positioners), moving into machining, trim fabrication, and actuator/positioner assembly. Suppliers then support testing and certification for service conditions such as low-emissions and functional safety. From there, the chain runs through OEM channels and EPC-driven project procurement, with large end users, including water and wastewater, power, chemicals, oil and gas, and pharmaceuticals, increasingly buying packaged solutions that combine valve bodies, actuators, digital positioners, and documentation rather than stand-alone hardware.
Lead times and compliance needs keep the chain sensitive to alloy availability and to dual-use electronics constraints, which has pushed OEMs and EPCs toward dual-qualification of sources and more local stockholding for fast-moving sizes. Capability expansion and portfolio consolidation are also reshaping the chain, with severe-service specialization and nuclear-grade qualification reinforced by Valmet completing the acquisition of Severn Group in July 2026 (adding Severn Glocon, ValvTechnologies, and LB Bentley into its flow control footprint). SMR-related supply alignment has also been reinforced through collaborations such as GE Vernova Hitachi Nuclear Energy and Velan (June 2026) on BWRX-300 valve supply. Distribution and service partners increasingly monetize diagnostics-enabled installed bases via commissioning, calibration, and digital asset-management support around positioners and actuators.
Competitive Landscape
The top six producers accounted for a notable share of global revenue in 2025, indicating moderate market concentration. Chart Industries and Flowserve expect USD 300 million in annual cost synergies within three years of their June 2025 merger announcement, leveraging an installed base exceeding 5.5 million assets. Baker Hughes broadened its pressure-management scope by purchasing Continental Disc for USD 540 million in August 2025, bolstering Industrial and Energy Technology margins. Emerson’s March 2025 consolidation of Aspen Technology equips it with end-to-end digital twins and optimization software, reinforcing lock-in across its FIELDVUE controller ecosystem.
Smaller but specialized players stake claims in emerging niches. Velan secured engineering support slots for the first commercial BWRX-300 SMR, while Swedish start-up Blykalla tapped KSB to co-develop lead-cooled reactor pumps. Chinese manufacturers such as Neway penetrate mid-to-high-spec bids by coupling API and SIL certifications with cost advantages, challenging incumbents in commodity segments. Technology differentiation now hinges on predictive analytics and wireless diagnostics; Valmet’s November 2025 Bluetooth-enabled Stonel app typifies this pivot, enabling maintenance in hazardous zones without hot-work permits. As software revenue outpaces hardware growth, suppliers capable of integrating valves, sensors, and analytics will consolidate share in the control valve market.
Emerging disruptors include Chinese firms such as Neway and Valve King, which are penetrating mid-to-high-end markets through technology investment and quality certifications while maintaining cost advantages of 20% to 40% relative to Western suppliers, and specialized players such as Ramén Valves, which developed the Ball Sector Valve for pulp and paper fiber suspensions with self-cleaning, low-torque, and elliptic-opening features that address application-specific pain points.
Control Valve Industry Leaders
Emerson Electric Co.
Flowserve Corporation
IMI plc
Baker Hughes Company
Valmet Oyj
- *Disclaimer: Major Players sorted in no particular order

Market Opportunities and Future Outlook
A whitespace is forming around regionalized manufacturing and faster lead-time response for projects that require higher specification valves, including severe service, low-emissions, and validated or traceable builds. Evidence of capacity and localization efforts includes IMI opening a manufacturing and engineering facility in Chennai in June 2026 (covering turbine bypass valves, control valves, desuperheaters, and hydraulic supply units), AS-Schneider inaugurating a production site in Coimbatore in March 2026, and Neway breaking ground in April 2026 on Phase II of a flow control project designed around IoT and intelligent manufacturing. These moves map to end-user expectations for local documentation support, quicker spares availability, and domestically compliant supply chains for infrastructure and power projects.
Digitalization and electrification in actuation and control also increase addressable value per valve, shifting competition toward integrated packages that combine electric actuation, smart positioners, and software-enabled diagnostics. ISO 5211:2026 and ISO 22109:2026 support standardized actuator and gearbox interfaces, and suppliers that can provide interoperable assemblies plus cybersecurity-aware diagnostics are better positioned in water utilities, pharmaceuticals, and power generation upgrades where remote monitoring and audit trails are being written into tenders and maintenance regimes.
Recent Industry Developments
- June 2026: Flowserve completed the acquisition of Trillium Flow Technologies Valves Division for USD 490 million (plus working capital adjustments). The deal adds specialized valve products and capabilities that are commonly specified in nuclear and other power end markets. The acquisition reinforces Flowserve's position in severe-service applications and in installed-base driven aftermarket.
- March 2026: IMI secured a contract to supply ultra-high-pressure control valves for chemical injection systems in a North Sea offshore development. The award highlights demand for advanced trim and materials capable of managing extreme differentials. It supports higher-value engineered valve content in offshore projects.
- June 2025: Chart Industries and Flowserve announced an all-stock merger of equals forming a combined entity positioned around industrial process technologies across LNG, hydrogen, and water treatment. Targeted operating synergies and a larger combined installed base increased scale for packaged flow-control solutions and lifecycle services.


Research Methodology Framework and Report Scope
Market Definition and Coverage
This market covers revenue earned from new control valve assemblies used to modulate flow, pressure, or temperature in industrial piping and process systems, across major end-use industries and regions.
Scope exclusions: We exclude on-off isolation valves, stand-alone actuators sold separately, and aftermarket spares and replacements.
Segmentation Overview
- By Valve Type
- Globe
- Ball
- Butterfly
- Plug
- Diaphragm
- Other Valve Types
- By Actuation Technology
- Pneumatic
- Hydraulic
- Electric
- Manual
- By End-user Industry
- Oil and Gas
- Chemical, Petrochemical and Fertilizer
- Energy and Power
- Water and Waste-water Treatment
- Metal and Mining
- Food and Beverage
- Pharmaceuticals
- Pulp and Paper
- Other End-user Industries
- By Material
- Steel
- Cast Iron
- Alloy-based
- Plastic (PVC, PP, PVDF)
- Other Materials
- By Geography
- North America
- United States
- Canada
- Mexico
- South America
- Brazil
- Argentina
- Rest of South America
- Europe
- Germany
- United Kingdom
- France
- Italy
- Spain
- Rest of Europe
- Asia-Pacific
- China
- Japan
- India
- South Korea
- ASEAN
- Rest of Asia-Pacific
- Middle East and Africa
- Middle East
- Saudi Arabia
- United Arab Emirates
- Rest of Middle East
- Africa
- South Africa
- Nigeria
- Rest of Africa
- Middle East
- North America
Data Sources, Market Sizing, and Validation
Desk Research
Desk research was used to anchor the demand environment and keep assumptions tied to public indicators. We reviewed sources such as the US Energy Information Administration (EIA), USGS, UN Comtrade, and World Bank industrial and infrastructure indicators, alongside publications from bodies like the International Energy Agency (IEA), depending on data availability for each region.
We also used annual reports, investor presentations, press releases, and project or tender announcements to understand capacity additions and upgrade cycles in end-use industries. Where needed, paid subscriptions for company financials and news intelligence, import and export shipment tracking, and patent databases were used to cross-check timelines, product focus, and supply chain signals. The desk sources listed here are illustrative only, and additional sources were reviewed to support data collection, validation, and clarification.
Primary Interviews and Surveys
Primary work focused on validating the factors that drive real buying decisions, then translating those inputs into model parameters that can be checked. We spoke with manufacturers, distributors, EPC and maintenance stakeholders, and end users in process industries, covering APAC, EMEA, and the Americas so regional pricing and project timing differences were not averaged out too early.
Distribution of primary research fieldwork respondents
| Company type | Respondent position | Region |
|---|---|---|
| Top tier: 37% | CXOs: 14% | APAC: 51% |
| Mid tier: 46% | Functional/Unit leaders: 29% | EMEA: 31% |
| Smaller Players: 17% | Managers: 57% | Americas: 18% |
Market-Sizing & Forecasting
Sizing starts with a top-down build where industrial activity and investment signals are translated into an addressable installed base and a project pipeline for flow control. We then applied conversion factors for control valve penetration, typical replacement cycles, and the share of applications that need modulating control rather than simple shut-off.
To keep the totals grounded, we corroborated the results with selective bottom-up checks, including sampled supplier revenue splits, distributor channel checks, and an ASP-to-volume approach for common valve types and actuation methods. Key model inputs included capital spending trends in oil and gas, chemicals, power, and water and wastewater, new plant and retrofit activity linked to emissions and leakage control, and automation intensity in process plants. We also modeled regional mix shifts between rotary and linear valves and tracked observed ASP movement tied to materials and sizing. Forecasts were run using scenario analysis supported by expert views on project award timing, capacity utilization changes, and modernization pace, then narrowed after consistency checks across regions and end uses. Where bottom-up data was missing in smaller countries, we used proxies from comparable industrial profiles and adjusted them using trade, project, and interview signals.
Data Validation & Update Cycle
Outputs were checked against independent signals, including industrial production trends, major project counts, and import and export patterns, then reviewed for outliers at the country and regional level. When we could not explain a variance with a clear driver, assumptions were revisited and select experts were re-contacted to confirm pricing, replacement rates, or end-use exposure.
Before sign-off, the model and assumptions go through multiple analyst reviews so unit logic, scope fit, and regional splits stay consistent. Reports are refreshed annually, and interim updates are made when material events occur that can shift demand or pricing. Right before delivery, we run a final pass on key indicators and relevant news so the client view reflects the latest available data.
Mordor Intelligence's Control Valve Market Estimate Compared With Other Published Estimates
Published market numbers for control valves often differ because each study defines the product boundary and revenue streams in its own way, then uses different pricing and timing assumptions. Differences also come from how demand is linked to end-use project cycles, rather than being extrapolated from a single broad industrial trend.
In this market, the biggest gap drivers are whether stand-alone actuators and accessories are counted inside the total, whether aftermarket spares are included, and how regional ASPs are adjusted for materials and sizing over time. The table also reflects how some estimates lean on a single base year and a straight CAGR, while others refresh inputs more often using updated project and retrofit signals, which can shift the current-year value.
Benchmark comparison
| Source | Market Size | Gaps in Research Methodology |
|---|---|---|
| Mordor Intelligence | USD 9.01 B (2026) | |
| Industry Data Publisher A | USD 9.85 B (2024) | Uses a component-based definition that explicitly includes actuators and other parts, and the year basis is earlier, which can lift totals if pricing is not aligned to the same cycle. |
| Business Insights Group B | USD 10.58 B (2025) | Counts a wider bundle of associated components and systems, which tends to expand the addressable revenue pool beyond new control valve assemblies alone. |
The spread mainly traces back to scope choices and to how pricing and demand signals are refreshed across regions. For that reason, our model keeps the market tied to new control valve assemblies and validates totals using project timing and end-use checks, a discipline applied across our Mordor Intelligence estimate approach.


Key Questions Answered in the Report
How large is the global control valve market in 2026?
It reached USD 9.01 billion and is forecast to climb to USD 13.58 billion by 2031, implying an 8.55% CAGR.
Which valve type is growing the fastest?
Plug valves are projected to expand at a 9.03% CAGR thanks to demand in abrasive slurry applications such as mining and pulp.
Why are electric actuators gaining traction?
Plants aim to cut compressed-air energy losses and gain precise digital control, driving a 10.02% CAGR for electric units.
Which end-user segment offers the strongest growth potential?
Pharmaceuticals lead with a 9.05% CAGR as biologics and continuous manufacturing drive validated valve demand.
What regions will contribute most to future expansion?
Asia-Pacific shows the highest 9.69% CAGR, fueled by manufacturing FDI, semiconductor fabs, and water infrastructure.
Page last updated on:


