Mooring Line Connector Market Size and Share
Market Overview
| Study Period | 2020 - 2031 |
|---|---|
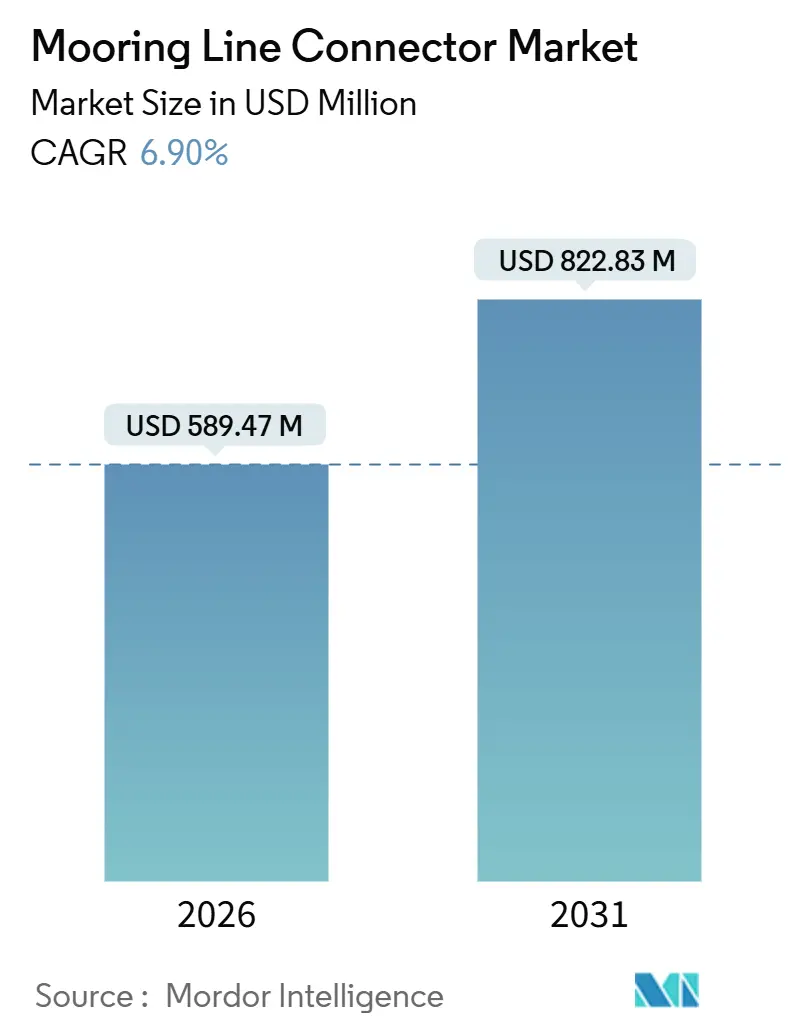
| Market Size (2026) | USD 589.47 Million |
| Market Size (2031) | USD 822.83 Million |
| Growth Rate (2026 - 2031) | 6.90% CAGR |
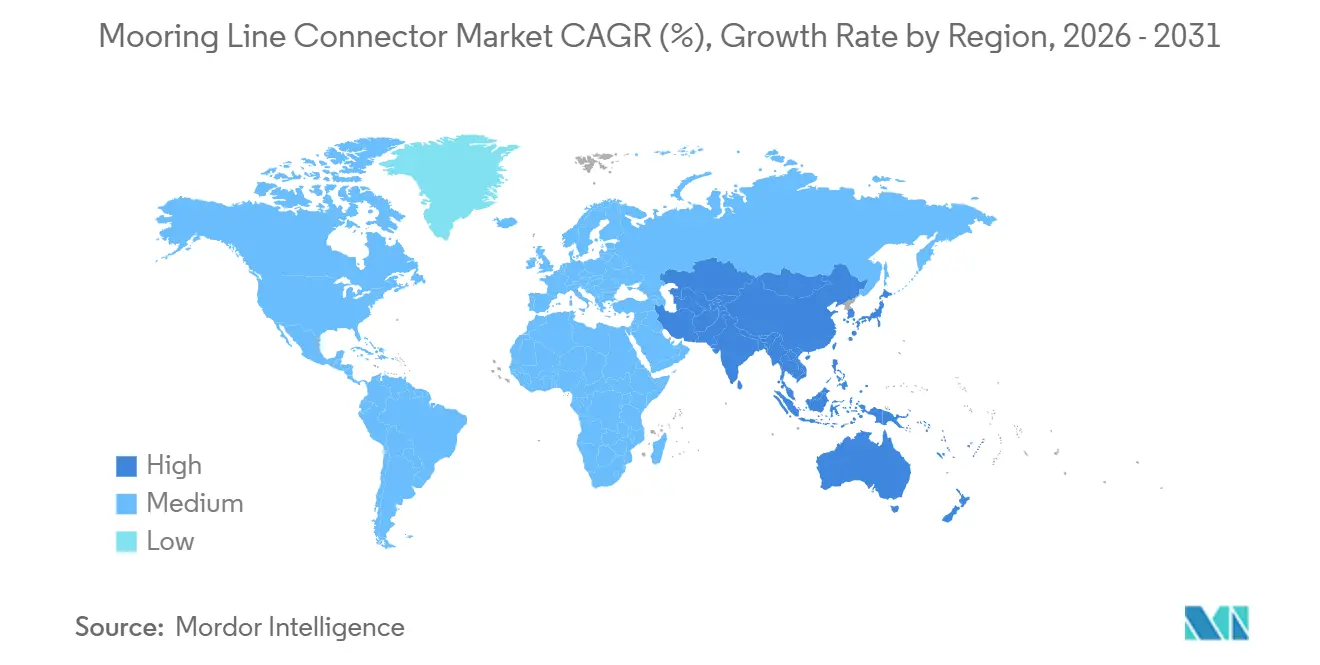
| Fastest Growing Market | Asia Pacific |
| Largest Market | North America |
| Market Concentration | Medium |
Major Players *Disclaimer: Major Players sorted in no particular order Image © Mordor Intelligence. Reuse requires attribution under CC BY 4.0. | |
Mooring Line Connector Market Analysis by Mordor Intelligence
The Mooring Line Connector Market size is estimated at USD 589.47 million in 2026, and is expected to reach USD 822.83 million by 2031, at a CAGR of 6.90% during the forecast period (2026-2031).
Demand originates from two directions: deepwater oil and gas field expansions and the rapidly growing fleet of floating renewable energy platforms. Aging pre-salt infrastructure in Brazil and Guyana continues to require high-integrity steel hardware; however, procurement is shifting toward lighter, corrosion-resistant components for floating wind farms that must withstand decades of cyclic loading. Developers are also prioritizing rapid offshore hookup, creating opportunities for modular designs and remotely operated connection mechanisms. Suppliers that combine broad certification portfolios with embedded digital sensors have begun separating themselves from competitors, as operators seek predictive maintenance capabilities that reduce unplanned downtime. Raw-material price swings for nickel-chromium alloys and the 18- to 24-month certification window for novel geometries represent the most immediate execution risks for the mooring line connector market.
Key Report Takeaways
- By type, H-Link connectors led with 41.50% of the mooring line connector market share in 2025, while K-Link designs are forecast to post an 8.01% CAGR through 2031.
- By material, forged steel accounted for 44.60% of the mooring line connector market size in 2025, whereas composite connectors are projected to expand at a 7.81% CAGR between 2026-2031.
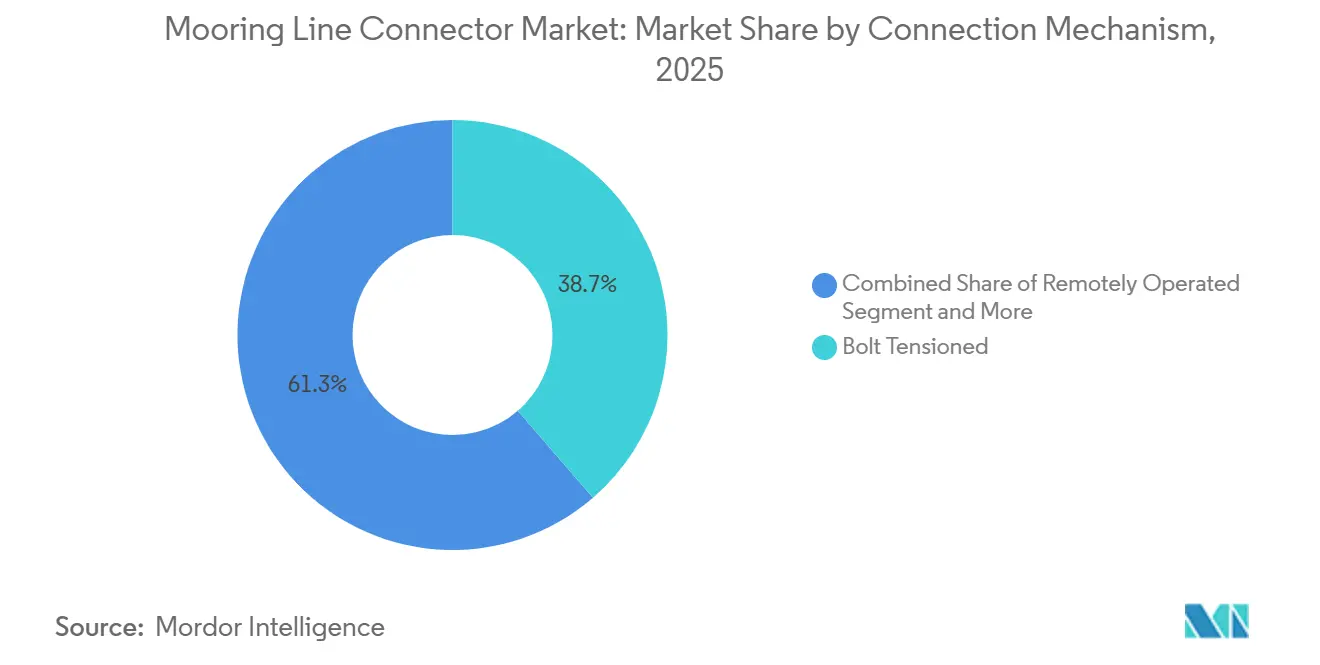
- By connection mechanism, bolt-tensioned systems held 38.67% revenue share in 2025, while remotely operated connectors are expected to progress at a 7.49% CAGR to 2031.
- By end-use industry, oil and gas represented 55.40% of 2025 demand, while offshore renewable energy is anticipated to grow at an 8.10% CAGR through 2031.
- By geography, Asia-Pacific captured 33.50% of the 2025 value, whereas the Middle East is projected to register a 7.95% CAGR over the forecast horizon.
Note: Market size and forecast figures in this report are generated using Mordor Intelligence’s proprietary estimation framework, updated with the latest available data and insights as of January 2026.
Global Mooring Line Connector Market Trends and Insights
Drivers Impact Analysis*
| Driver | (~) % Impact on CAGR Forecast | Geographic Relevance | Impact Timeline |
|---|---|---|---|
| Rising Offshore Oil and Gas Exploration and New Deepwater Projects | +1.2% | South America, Middle East, Asia-Pacific | Medium term (2-4 years) |
| Accelerating Deployment of Floating Offshore Wind Farms | +1.8% | Europe, Asia-Pacific, North America | Long term (≥ 4 years) |
| Increasing Adoption of Remotely Operated Mooring Systems | +0.9% | Global, early uptake in North Sea and Gulf of Mexico | Medium term (2-4 years) |
| Expansion of LNG Carrier Fleet and Marine Transportation Volumes | +0.7% | Asia-Pacific, Middle East | Short term (≤ 2 years) |
| Technological Advancements in High-Strength Lightweight Materials | +1.1% | Global R&D hubs in Europe and North America, manufacturing scale in Asia-Pacific | Long term (≥ 4 years) |
| Government Incentives for Domestic Subsea Manufacturing | +0.6% | North America, Europe, Asia-Pacific | Medium term (2-4 years) |
| Source: Mordor Intelligence | |||
Accelerating Deployment of Floating Offshore Wind Farms
Floating wind capacity installations surged to 520 MW in 2025, quadrupling the 2024 base as projects off Scotland, Norway, and South Korea validated semi-submersible and spar-buoy platforms in water depths exceeding 60 m. Each turbine typically needs three to four connectors, and developers are specifying K-Link variants for quick-release capability during storms. National funding programs, such as Japan’s JPY 120 billion (USD 800 million) allocation for demonstration arrays, shorten payback periods and de-risk supply chains. Classification societies have streamlined type approvals for dynamic applications, enabling suppliers with existing data packs to reach the market faster. As a result, floating wind is set to be the single largest incremental demand source for the mooring line connector market over the next decade.
Rising Offshore Oil and Gas Exploration and New Deepwater Projects
Brazil’s pre-salt cluster added three floating production, storage, and offloading (FPSO) units in 2025, each equipped with up to 16 mooring lines rated for a static load of 2,000 tons. Guyana’s Stabroek Block hit 645,000 bpd in late 2025, with four additional FPSOs queued for 2028 that will deploy redundancy-driven connector arrays. Saudi Aramco’s Marjan and Berri redevelopments similarly favor floating platforms in depths once reserved for jack-ups, generating incremental hardware orders valued at roughly USD 45 million per year. These projects underpin baseline growth for the mooring line connector market, even as the energy transition gradually reallocates capital toward renewable energy sources.
Technological Advancements in High-Strength Lightweight Materials
Composite housings fabricated from carbon-fiber-reinforced polymers cut individual connector weight by up to 40%, lowering installation vessel day-rates and enabling larger turbine nacelles. Accelerated fatigue testing conducted by European laboratories confirmed parity in 60-year service life with forged steel, alleviating insurer concerns. Suppliers now integrate Dyneema or other ultra-high-molecular-weight polyethylene sleeves to eliminate galvanic corrosion at metallic interfaces. Although composites comprise only 8% of the 2025 volume, cost curves are falling as Asian manufacturers ramp output, positioning the segment for above-market expansion within the broader mooring line connector market.
Increasing Adoption of Remotely Operated Mooring Systems
Operators in the North Sea and Gulf of Mexico face shortened weather windows and mounting dive-support vessel costs that exceed USD 150,000 per day. Remotely operated vehicle (ROV) compatible connectors enable tensioning, inspection, and disconnection at depths of up to 500 m without requiring human intervention, thereby compressing installation schedules from weeks to days. Successful field trials on Shell’s Whale FPSO in 2025 demonstrated a six-hour full-system release, satisfying hurricane evacuation protocols. As classification bodies refine standards for hydraulic actuation and embedded sensing, ROV-enabled solutions are becoming a default specification for new deepwater assets.
Restraints Impact Analysis*
| Restraint | (~) % Impact on CAGR Forecast | Geographic Relevance | Impact Timeline |
|---|---|---|---|
| High Initial Capital Outlay and Complex Retrofitting Requirements | -0.8% | Global, acute in India, Vietnam, West Africa | Short term (≤ 2 years) |
| Supply Chain Vulnerabilities for Specialty Alloys | -1.1% | Europe and North America | Medium term (2-4 years) |
| Stringent Certification and Classification Standards | -0.5% | Europe and North America | Medium term (2-4 years) |
| Volatility in Crude Oil Prices Affecting Upstream Investments | -0.9% | North America and West Africa | Short term (≤ 2 years) |
| Source: Mordor Intelligence | |||
Supply Chain Vulnerabilities for Specialty Alloys
Deepwater connectors rely on nickel-chromium-molybdenum forgings produced by four qualified mills worldwide, and the 2025 export restrictions lifted nickel prices by 22%. Lead times stretched to 14 months, forcing suppliers to invoke force majeure clauses and jeopardizing project schedules, even when end-user demand remained intact. European legislation that prioritizes battery-grade nickel further squeezes industrial alloy supply, while carbon-fiber precursor capacity is similarly concentrated. Until new mills pass certification audits, alloy tightness will cap upside for the mooring line connector market[1]American Petroleum Institute Supply Chain Group, “Specialty Alloys for Offshore Applications,” American Petroleum Institute, api.org.
High Initial Capital Outlay and Complex Retrofitting Requirements
A full mooring spread for one FPSO can cost more than USD 8 million, representing a major hurdle for marginal field developments. Retrofitting older platforms doubles the hardware expenditure once subsea surveys, custom adapter plates, and weather delays are factored in. India’s national operator postponed two FPSO projects in 2025 after connector budgets exceeded sanctioned limits by 18%, underscoring capital pressure. Floating wind ventures face a steep learning curve that can swing cost estimates by 40% between concept and procurement, dampening investor appetite.
*Our forecasts treat driver/restraint impacts as directional, not additive. The impact forecasts reflect baseline growth, mix effects, and variable interactions.
Segment Analysis
By Type: Modular Designs Gain Traction in Floating Wind
The K-Link subcategory is forecast to advance at an 8.01% CAGR, outpacing the overall mooring line connector market. Field data shows that modular K-Link assemblies reduce offshore hookup time by 30%, saving USD 2.5 million in vessel costs per turbine. The mooring line connector market share for H-Link designs was 41.50% in 2025, anchored by decades of use on semi-submersibles and tension-leg platforms. Y-Link and M-Link variants fill niche roles in taut-leg or spread-moored configurations where acute line angles or redundant load paths are essential.
Certification bodies approved 14 new K-Link designs in 2025, up from six in 2023, signaling maturity and improving lender confidence. Spread-moored FPSOs in Brazil still favor M-Link systems, capable of handling 3,000 t tensions, while proprietary geometries account for roughly 12% of the value, solving specialized challenges such as subsea tree tie-ins. Consequently, suppliers able to manufacture multiple connector types under one roof are best placed to capture cross-segment synergies in the mooring line connector market.


By Material: Composites Challenge Steel’s Dominance
Forged steel retained a 44.60% revenue share in 2025; however, its weight penalty becomes unsustainable as floating turbines scale up to 20 MW. Composite connectors, although accounting for only 8% of the volume, are projected to achieve a 7.81% forecast CAGR as operators seek to extend their service life and reduce transportation costs. Cast steel remains viable for single-point moorings where fatigue loading is moderate, while duplex stainless and nickel-based alloys cater to Arctic or high-temperature wells, commanding premium pricing.
Pilot deployments in the North Sea reported no degradation after one year of composite service, helping insurers relax coverage terms. Cost reductions stem from Asian producers leveraging automotive carbon-fiber supply chains, bringing composites within 1.3 times the per-kilogram price of forged steel by 2026. As certification datasets expand, the market size for mooring line connectors attributable to composites is expected to accelerate, especially in regions offering recycling incentives for lightweight materials.
By Connection Mechanism: Automation Reshapes Installation Economics
Remotely operated connectors are on track for a 7.49% CAGR through 2031, fueled by a global shortage of dive-support vessels and tighter safety regulations. Bolt-tensioned systems accounted for 38.67% of 2025 revenue, primarily in shallow-water brownfield upgrades where existing interface geometry limits alternative options. Quick-release products, growing at 6.8%, appeal to hurricane-exposed Gulf of Mexico installations that must safely disconnect within six hours. Mechanical latch designs serve installations lacking hydraulic power, and experimental electromagnetic solutions remain at the prototype stage.
The overall mooring line connector market benefits from ROV compatibility because operators can reallocate inspection budgets from vessel day-rates to digital monitoring. ABS certification was obtained in 2024 for the first fully integrated hydraulic-actuation connector, validating fatigue life parity with legacy hardware and mitigating perceived risk. Widespread adoption is likely once cost parity with bolt-tensioned systems narrows to 15% premium, a threshold anticipated by 2028.
By End-Use Industry: Renewables Reshape Demand Patterns
Oil and gas installations accounted for 55.40% of 2025 spending; however, growth is limited to a 5.8% CAGR, as investment shifts toward lower-carbon assets. Offshore renewable energy is showing the fastest advance, with an 8.10% projected CAGR that will steadily expand its share of the mooring line connector market. Marine transportation maintains a stable 22% share, as the liquefied natural gas trade underpins orders for floating storage and regasification units, each of which requires eight to twelve moorings.
Defense and scientific applications remain niche but command high margins because of strict security-of-supply terms. Floating aquaculture pens entering 100 m water depths in Norway exemplify emerging segments that demand robust yet lightweight connectors. Suppliers with cross-sector reference lists enjoy more predictable revenue, insulating them from cyclical swings in any single end-use vertical.
Geography Analysis
Asia-Pacific led with 33.50% of the 2025 value, supported by China’s dominance in shipbuilding and Japan’s early floating wind demonstrations. Local content rules anchor procurement to regional fabricators, limiting Western suppliers largely to design consultancy roles. South Korea’s shipyards deliver FPSO hulls globally, sustaining steady connector exports even when domestic upstream activity moderates. India’s Krishna-Godavari basin developments, although delayed by cost overruns, still represent a significant opportunity once financing gaps are addressed.
Europe held a 28% share, reflecting the mature North Sea oil and gas base, coupled with aggressive renewable deployments. Norway, the United Kingdom, and France jointly operated 420 MW of floating wind in 2025 and have 2 GW under development, ensuring ongoing demand for corrosion-resistant connectors. Brownfield asset life-extension projects in the U.K. Continental Shelf also drive replacement orders as mooring fatigue lives expire after 20 years. Suppliers in Spain and Norway benefit from proximity to end-users and established logistics channels[2]WindEurope Statistics Department, “Offshore Wind in Europe 2025,” WindEurope, windeurope.org.
North America accounted for 18%, split between Gulf of Mexico deepwater oil and gas and emerging floating wind lease areas offshore California and Maine. The Bureau of Ocean Energy Management fast-tracked environmental reviews in 2025, bringing the first grid-connected turbines within the 2029 window. The Middle East, although accounting for only 10% of revenue, is the fastest-growing region, with a 7.95% CAGR. Saudi Aramco’s Marjan redevelopment and QatarEnergy’s North Field expansion require connectors rated for extreme temperatures and airborne sand abrasion, offering premium pricing. South America’s trajectory depends heavily on Petrobras, whose 47-unit FPSO fleet ensures a baseline demand for refurbishment, even amid budget reallocations. Africa lags with 6% share due to financing hurdles in Mozambique and Senegal, but discoveries off Namibia could catalyze orders after 2027.

Competitive Landscape
The top ten suppliers accounted for approximately 60% of the 2025 revenue, positioning the mooring line connector market in a moderately concentrated segment. Acteon Group, Vryhof, and InterMoor utilize extensive certification libraries to secure positions in deepwater hydrocarbon projects, while First Subsea and Flintstone Technology concentrate on lightweight composites and automation for renewable energy applications. Vertical integration is a growing trend: incumbents have acquired synthetic rope manufacturers and installation service firms to bundle turnkey packages, thereby increasing switching costs for operators.
Technology has emerged as the decisive differentiator. NOV Inc. introduced digital strain-gauge-equipped connectors in 2024 that extend inspection intervals to five years by feeding fatigue data into cloud analytics[3]NOV Investor Relations, “Digital Mooring Integrity System Investor Presentation,” NOV, nov.com. Smaller disruptors, such as Blackfish Engineering Design, deliver modular housings that accept interchangeable latch or hydraulic modules, minimizing retrofit expenses. Classification societies indirectly influence competition by updating fatigue and digital monitoring rules. ABS’s 2024 revision favors firms with in-house finite-element modeling capabilities, raising the bar for regional fabricators.
Price pressure remains modest because connectors represent a small fraction of the overall platform cost, yet the stakes for reliability are high. Operators therefore prioritize proven performance over unit cost, particularly for projects in water depths of 2,000 m or in typhoon-prone zones. Suppliers with global after-sales support networks and remote diagnostics can command premiums of 10%-15% above commodity offerings, reinforcing incumbents’ advantage. Nonetheless, regional manufacturing incentives embedded in U.S. and European industrial policy could spawn new entrants after 2027.
Mooring Line Connector Industry Leaders
Acteon Group Ltd.
Delmar Systems Inc.
Offspring International Ltd.
Mooring Systems Inc.
Saxton Marine Services Pty Ltd.
- *Disclaimer: Major Players sorted in no particular order


Recent Industry Developments
- January 2026: ABS and AMOG Consulting have formalized a memorandum of understanding (MOU) to collaborate on the development of an Offshore Mooring Digital Twin. This agreement integrates AMOG’s advanced monitoring technology with ABS’ expertise in classification and certification to deliver a comprehensive integrity-monitoring solution for floating offshore assets.
- January 2026: Qingdao Port, a subsidiary of the Shandong Port Group, officially launched China's first vacuum-based automatic mooring system, commencing live commercial operations at the Qingdao Automated Container Terminal.
- December 2025: Jawaharlal Nehru Port Authority, India’s largest state-owned container gateway, intends to implement an Automated Mooring System (AMS)—the first of its kind in India—at one of its private terminals as a pilot project. This initiative aims to improve operational safety and efficiency while reducing vessel turnaround times by automating the mooring and unmooring processes.
- May 2025: Petrobras awarded Delmar Systems a USD 34 million contract to furnish connectors for two FPSOs destined for the Buzios pre-salt field offshore Brazil, rated for 2,100 m water depth.


Global Mooring Line Connector Market Report Scope
The Mooring Line Connector Market Report is Segmented by Type (H-Link, Y-Link, M-Link, K-Link, Other Types), Material (Forged Steel, Cast Steel, High-Strength Alloy, Composite, Other Materials), Connection Mechanism (Bolt Tensioned, Quick Release, Remotely Operated, Mechanical, Other Connection Mechanisms), End-Use Industry (Oil and Gas Industry, Marine Transportation, Offshore Renewable Energy, Defense and Security, Other End-Use Industries), and Geography (North America, South America, Europe, Asia-Pacific, Middle East and Africa). The Market Forecasts are Provided in Terms of Value (USD).
| H-Link |
| Y-Link |
| M-Link |
| K-Link |
| Other Types |
| Forged Steel |
| Cast Steel |
| High-Strength Alloy |
| Composite |
| Other Materials |
| Bolt Tensioned |
| Quick Release |
| Remotely Operated |
| Mechanical |
| Other Connection Mechanisms |
| Oil and Gas Industry |
| Marine Transportation |
| Offshore Renewable Energy |
| Defense and Security |
| Other End-Use Industries |
| North America | United States | |
| Canada | ||
| Mexico | ||
| South America | Brazil | |
| Argentina | ||
| Rest of South America | ||
| Europe | United Kingdom | |
| Norway | ||
| Germany | ||
| France | ||
| Russia | ||
| Rest of Europe | ||
| Asia-Pacific | China | |
| Japan | ||
| South Korea | ||
| Australia | ||
| New Zealand | ||
| India | ||
| Rest of Asia-Pacific | ||
| Middle East and Africa | Middle East | Saudi Arabia |
| United Arab Emirates | ||
| Turkey | ||
| Rest of Middle East | ||
| Africa | South Africa | |
| Nigeria | ||
| Rest of Africa | ||
| By Type | H-Link | ||
| Y-Link | |||
| M-Link | |||
| K-Link | |||
| Other Types | |||
| By Material | Forged Steel | ||
| Cast Steel | |||
| High-Strength Alloy | |||
| Composite | |||
| Other Materials | |||
| By Connection Mechanism | Bolt Tensioned | ||
| Quick Release | |||
| Remotely Operated | |||
| Mechanical | |||
| Other Connection Mechanisms | |||
| By End-Use Industry | Oil and Gas Industry | ||
| Marine Transportation | |||
| Offshore Renewable Energy | |||
| Defense and Security | |||
| Other End-Use Industries | |||
| By Geography | North America | United States | |
| Canada | |||
| Mexico | |||
| South America | Brazil | ||
| Argentina | |||
| Rest of South America | |||
| Europe | United Kingdom | ||
| Norway | |||
| Germany | |||
| France | |||
| Russia | |||
| Rest of Europe | |||
| Asia-Pacific | China | ||
| Japan | |||
| South Korea | |||
| Australia | |||
| New Zealand | |||
| India | |||
| Rest of Asia-Pacific | |||
| Middle East and Africa | Middle East | Saudi Arabia | |
| United Arab Emirates | |||
| Turkey | |||
| Rest of Middle East | |||
| Africa | South Africa | ||
| Nigeria | |||
| Rest of Africa | |||


Key Questions Answered in the Report
What is the current value of the mooring line connector market?
The mooring line connector market size stood at USD 589.47 million in 2026 and is projected to reach USD 822.83 million by 2031.
Which segment is growing fastest by connector type?
K-Link designs are forecast to post the highest growth, with an 8.01% CAGR through 2031 thanks to their modular, quick-installation attributes.
How quickly is the renewable segment expanding?
Offshore renewable energy applications are expected to register an 8.10% CAGR, the steepest among all end-use categories.
Which region shows the highest growth outlook?
The Middle East leads with a projected 7.95% CAGR, underpinned by new floating production and liquefied natural gas initiatives.
What is the main supply chain risk facing manufacturers?
Limited global capacity for nickel-chromium-molybdenum alloy forgings, combined with volatile nickel prices, can extend lead times beyond one year.
How are digital technologies influencing connector procurement?
Operators now prefer connectors with embedded load sensors and predictive analytics, which extend inspection intervals and reduce lifecycle costs by roughly 18%.
Page last updated on:


