Construction And Demolition Waste Management Market Size and Share
Market Overview
| Study Period | 2020 - 2031 |
|---|---|
| Market Size (2026) | USD 123.5 Billion |
| Market Size (2031) | USD 167.10 Billion |
| Growth Rate (2026 - 2031) | 6.23% CAGR |
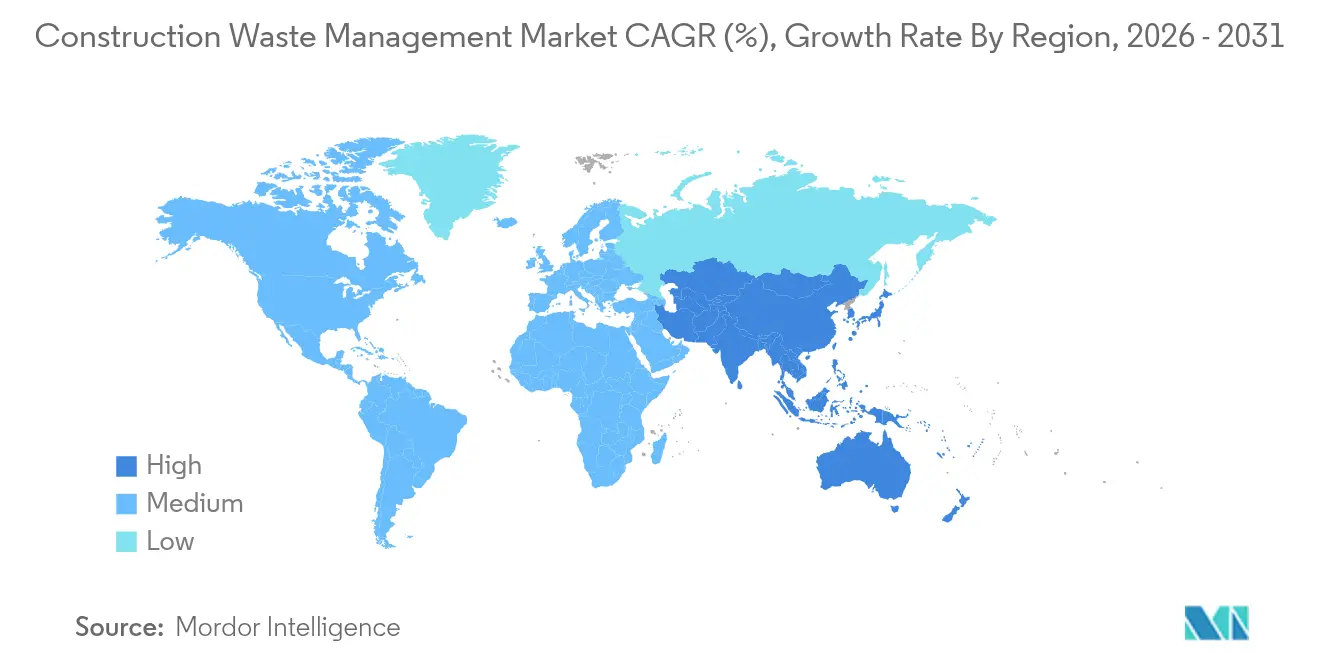
| Fastest Growing Market | Asia Pacific |
| Largest Market | North America |
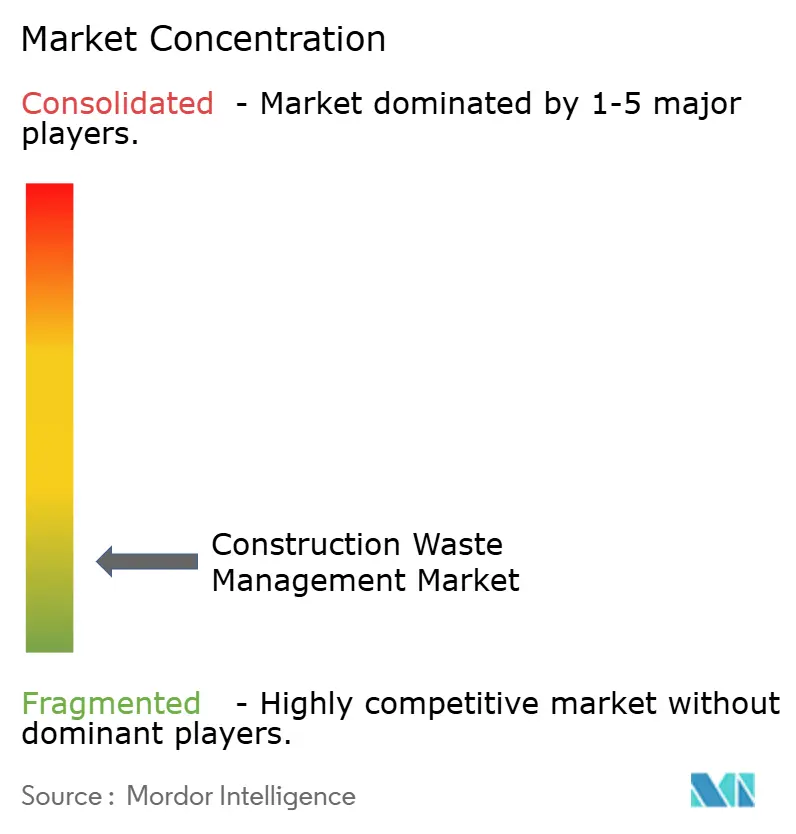
| Market Concentration | Low |
Major Players *Disclaimer: Major Players sorted in no particular order Image © Mordor Intelligence. Reuse requires attribution under CC BY 4.0. | |
Construction And Demolition Waste Management Market Analysis by Mordor Intelligence
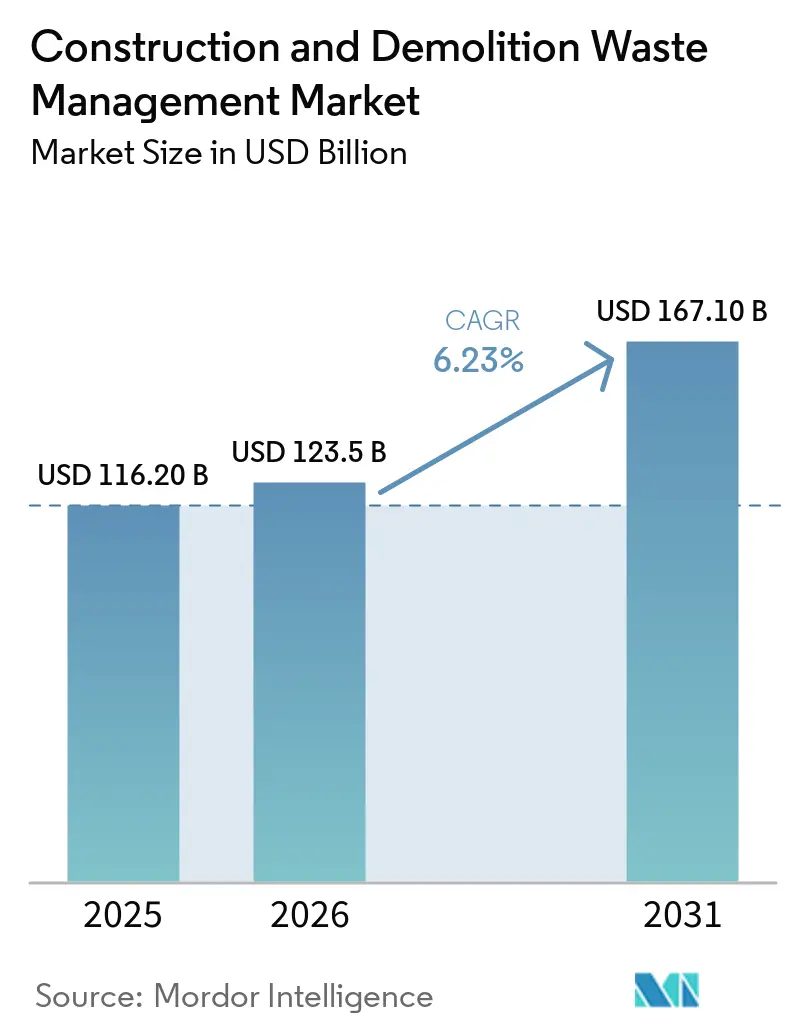
The Construction And Demolition Waste Management Market size was valued at USD 116.20 billion in 2025 and is estimated to grow from USD 123.5 billion in 2026 to reach USD 167.10 billion by 2031, at a CAGR of 6.23% during the forecast period (2026-2031).
Regulatory mandates are pushing diversion and recovery targets higher, which sustains steady investment in sorting and processing capacity across mature and emerging regions. Rapid urbanization in Asia and multilateral financing for resilient infrastructure in Africa are expanding waste volumes and formalizing disposal pathways, which benefits integrated operators with scale. Circular procurement, digital product passports, and embodied carbon rules are redirecting demand toward certified secondary materials and verifiable chain-of-custody, which favors data-rich operators able to prove recycled content. Public grants in North America and policy harmonization in Europe continue to steer capital into optical sorting and AI-enabled material recovery, while corporate recyclate uptake validates the business case for higher-quality outputs
Key Report Takeaways
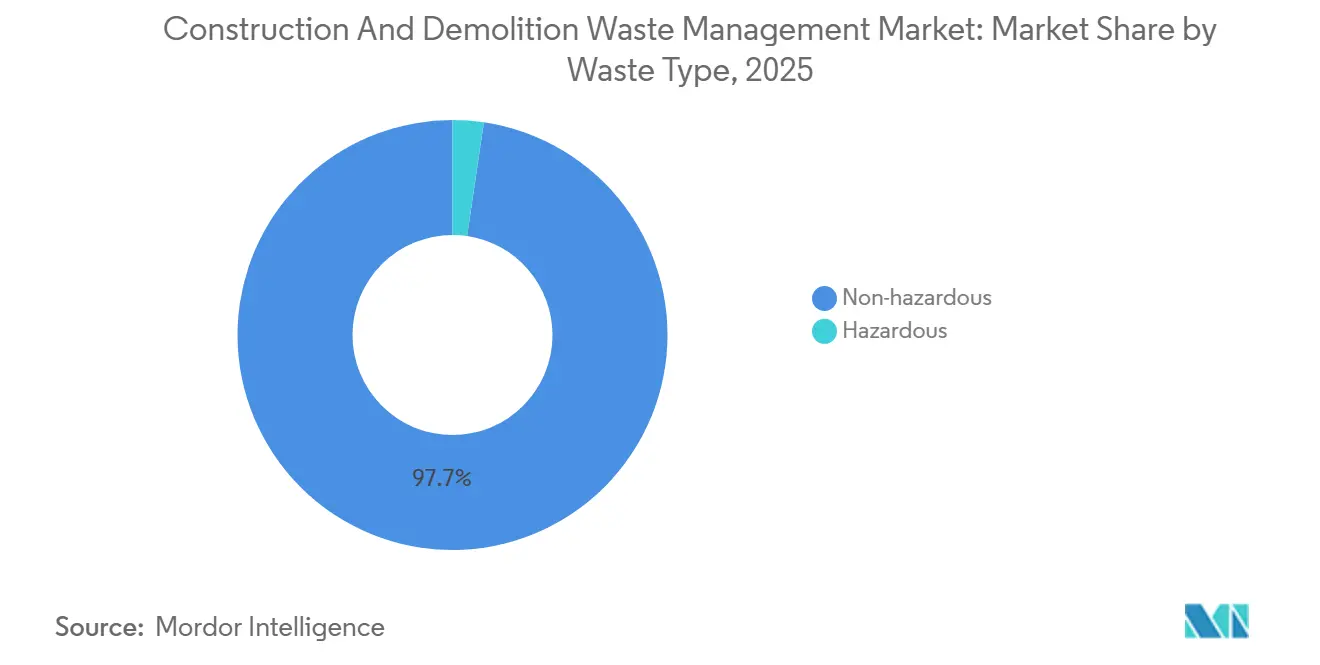
- By waste type, non-hazardous waste led with 97.67% of the Construction and Demolition Waste Management Market share in 2025 and is projected to expand at a 6.71% CAGR to 2031.
- By material, concrete and bricks commanded 60.42% share in the Construction and Demolition Waste Management Market size in 2025 and are set to grow at a 6.56% CAGR to 2031.
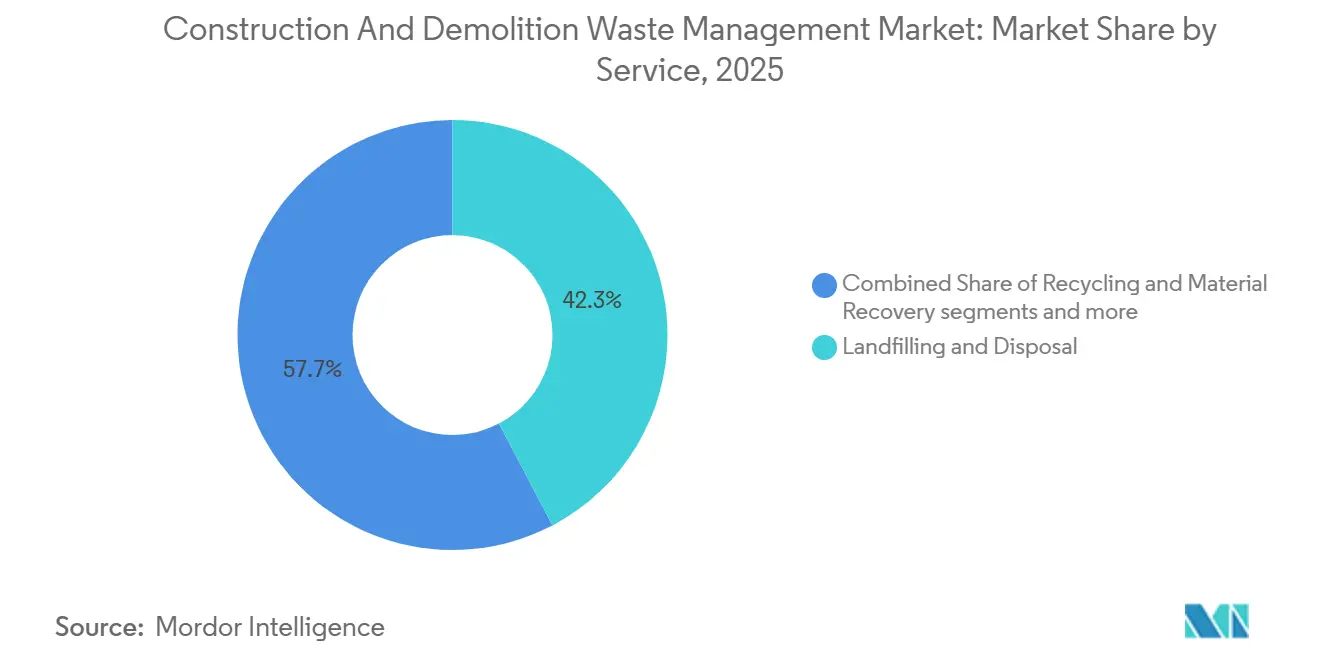
- By service, landfilling and disposal held 42.31% share in 2025 and is advancing at a 6.81% CAGR through 2031.
Note: Market size and forecast figures in this report are generated using Mordor Intelligence’s proprietary estimation framework, updated with the latest available data and insights as of 2026.
Global Construction And Demolition Waste Management Market Trends and Insights
Drivers Impact Analysis*
| Driver | (~) % Impact on CAGR Forecast | Geographic Relevance | Impact Timeline |
|---|---|---|---|
| Technological advancements in waste sorting, processing, and recycling equipment | +1.8% | Global, concentrated in developed markets (North America, Europe, Asia-Pacific core regions) | Short term (≤ 2 years) |
| Stringent government regulations and policies for waste reduction and recycling | +1.5% | Global, particularly strong in EU, North America, China | Medium term (2-4 years) |
| Growing demand for recycled construction materials due to resource scarcity | +1.2% | Global, with early gains in resource-constrained markets (EU, Japan, Singapore) | Medium term (2-4 years) |
| Rising adoption of circular economy principles in construction industry | +1.0% | Global, led by EU and select Asia-Pacific markets (Japan, South Korea) | Long term (≥ 4 years) |
| Increasing awareness about environmental sustainability and carbon footprint reduction | +0.6% | Global, strongest in markets with ESG reporting mandates | Long term (≥ 4 years) |
| Growing urbanization and infrastructure development activities worldwide | +0.5% | APAC core, spillover to MEA and Latin America | Long term (≥ 4 years) |
| Source: Mordor Intelligence | |||
Technological Advancements in Waste Sorting, Processing, and Recycling Equipment
Automation and AI are redefining the economics of mixed C&D recovery by improving recognition, purity, and consistency across mineral and non-mineral fractions. Terex’s ZenRobotics fourth-generation systems raised identification capabilities to more than 500 waste categories and achieved up to 80 picks per minute, which enables cleaner separation of plastics and wood streams at scale. Aalto University research found that computer vision-enabled automated sorting cut comparative costs by 27% when labor wages exceeded EUR 20,980 annually and reduced workforce requirements by 91.7% versus conventional lines, improving facility-level viability. Digitalization is also raising throughput in heavy-duty applications, with HAZEMAG’s Recycling Plant 4.0 reaching 300 tonnes per hour and embedding analytics such as recipe management and belt weighing to match end-market quality needs. Addressing contamination is critical because the global externality cost of mismanaged waste flows has been significant, and robotic sensors now distinguish nuanced features like paint on wood to improve reuse pathways.
Stringent Government Regulations and Policies for Waste Reduction and Recycling
The policy environment intensified in 2024-2026 as regulators linked diversion targets to embodied carbon reporting and traceability requirements in permits and public procurement. The EU’s revised Construction Products Regulation mandates Environmental Product Declarations with carbon indicators, while the region’s competitiveness agenda targets doubling the circular material use rate to 24% by 2030 from 12.2% in 2024. Member States are working toward harmonized end-of-waste criteria for high-potential streams such as aggregates, concrete, fired clay bricks, and gypsum to build confidence in secondary materials.[1]Publications Office of the European Union, “End-of-waste criteria for construction materials,” Publications Office, op.europa.eu In the United States, SWIFR grants require grantees to report C&D tonnages collected, recycled, and managed by material type, which strengthens measurement and accountability for recovery outcomes. China’s 14th Five-Year Plan on Circular Economy sets targets for recycled non-ferrous metals and a resource recycling industry valued at RMB 5 trillion (USD 694.4 billion) by 2025, signaling sustained demand for recovered materials in infrastructure programs.[2]International Energy Agency, “14th Five-Year Plan on Circular Economy,” IEA, iea.org
Growing Demand for Recycled Construction Materials Due to Resource Scarcity
Pressure on natural aggregates and raw materials is rising as global extraction trends accelerate, which raises the attractiveness of high-quality recycled aggregates in urban projects. Process innovations such as acid washing, alkali treatment, and accelerated carbonation improve the performance and permeability of recycled concrete aggregates, broadening structural use cases while reducing embodied emissions and water consumption. Corporate initiatives like Holcim UK’s ECOCycle, which integrates a minimum 10% recycled C&D content with a 2030 target of 20%, illustrate how product portfolios are adjusting to procurement criteria that elevate circularity in bids. Developing regions are also committing funds to bridge supply gaps for recovered aggregates, as seen in Kazakhstan’s circular economy investment plan through 2030.[3]World Bank, “Lao PDR Pollution and Waste Management Project,” World Bank, worldbank.org China’s green building materials market expansion and revised evaluation standards that require higher recycled content underpin rising demand for compliant secondary materials. In Ukraine, municipal plants are converting demolition debris into road repair inputs, showing how capacity investments can stabilize supply in reconstruction contexts.
Rising Adoption of Circular Economy Principles in the Construction Industry
Construction and demolition waste is the largest single waste stream in the EU, and circular economy uptake is growing through targets, procurement rules, and building standards that value reuse, high-quality recycling, and traceability. Japan demonstrates advanced selective demolition and near-total concrete recycling rates, leveraging technologies such as Tecorep to maintain high-quality outputs. Singapore’s Green Mark encourages recycled content in non-structural applications and aligns major projects with recycled aggregate targets, reinforcing market signals for secondary materials. EU projects like RECOMPOSE have validated structural elements such as steel-concrete composite slabs using recycled aggregate, with modeling that adheres to Eurocode reliability requirements. National and regional funds, such as Navarra’s support for C&D and industrial waste recovery, are moving capital toward facilities and standards that can scale high-value reuse rather than downcycling. Standards from ISO TC 323 on measurement and product circularity data sheets now provide a common language for companies as EU reporting requirements tighten.
Restraints Impact Analysis*
| Restraint | (~) % Impact on CAGR Forecast | Geographic Relevance | Impact Timeline |
|---|---|---|---|
| High initial capital investment for waste management infrastructure and equipment | -0.7% | Global, particularly acute in developing regions | Medium term (2-4 years) |
| Limited availability of advanced recycling facilities in developing regions | -0.5% | Sub-Saharan Africa, South Asia, Southeast Asia, Latin America | Long term (≥ 4 years) |
| Contamination of waste streams reduces recyclability and material quality | -0.4% | Global, most severe in markets lacking source separation mandates | Medium term (2-4 years) |
| Lack of awareness and inadequate training among the construction workforce | -0.3% | Global, pronounced in emerging markets | Short term (≤ 2 years) |
| Source: Mordor Intelligence | |||
High Initial Capital Investment for Waste Management Infrastructure and Equipment
Capital intensity for C&D collection, transfer, sorting, and processing remains the largest headwind in many regions, particularly where tip fees are low, and commodity spreads are thin. Recent public finance programs are designed to reduce upfront cost barriers through grants and performance-based transfers, but multi-year funding commitments and reporting obligations add complexity for local governments and private operators. Indonesia’s performance-based grants approach, now rolling out across 30 local governments, shows how capital can be linked to source separation and cost recovery, although execution capacity varies. Lao PDR’s national program similarly pairs equipment, transfer facilities, and landfill upgrades with training for informal workers, which is essential for uptake but adds lead time to commissioning. In advanced markets, AI sorters and high-throughput lines require significant capital, though learning curves and operating savings from digitalization are gradually closing feasibility gaps.
Contamination of Waste Streams Reducing Recyclability and Material Quality
Contamination undermines recyclability and material value, which inflates residuals and reprocessing costs and keeps diversion rates below technical potential in many cities. Jurisdictions are responding with higher diversion thresholds, refundable deposits, and compliance audits that force better front-end segregation and verified facility performance, which helps reduce contamination at the MRF gate. Digital platforms for permit-linked plans and real-time receipt uploads are increasing traceability and allowing municipalities to enforce consequences for non-compliance, including forfeiture of deposits on projects. Technical countermeasures are also improving, including computer vision that detects surface coatings and embedded contaminants that once forced downgrades to backfill or disposal. Federal and state specifications are tightening practices to prevent hazardous crossover, such as UFGS restrictions on creating hazardous waste streams during on-site crushing, which raises compliance discipline across projects.
*Our forecasts treat driver/restraint impacts as directional, not additive. The impact forecasts reflect baseline growth, mix effects, and variable interactions.
Segment Analysis
By Waste Type: Non-Hazardous Dominance with Hazardous Growth Acceleration
Non-hazardous waste commanded 97.67% in 2025, while hazardous waste, at 2.33%, recorded the fastest 7.21% CAGR through 2031, reflecting heightened attention to legacy materials in aging buildings and infrastructure. This mix keeps the construction and demolition waste management market focused on mineral fractions in large volumes while compliance systems strengthen oversight of asbestos, lead, and PCBs in demolition workflows. Local permitting and landfill acceptance rules increasingly require certifications, notification, specialized handling, and scheduling, which support safe routing and documentation for hazardous materials. County-level practices, such as appointment-only acceptance and packaging standards, also reflect the operational safeguards around hazardous streams. Federal project specifications now restrict on-site activities that could create hazardous waste crossover, which raises the bar for diversion counting and contractor reporting across the construction and demolition waste management industry.
On the non-hazardous side, technology and process improvements are enhancing the quality and marketability of outputs. Water-based density separation and jigging systems have demonstrated high-purity mineral fractions, improving performance metrics that matter to end users in road base and structural applications. Standards and protocols for selective demolition and QA are fostering trust in recycled materials, which supports higher-value reuse and reduces downcycling risk in the construction and demolition waste management market. Digital reporting frameworks are tightening contamination controls and assuring that hazardous constituents are not co-mingled into otherwise recyclable mineral streams. Together, these measures help maintain the segment’s strong base while channeling investment into the smaller hazardous category, which is expected to grow faster from a low base due to regulatory pressure and targeted infrastructure.


By Material: Mineral Fractions Lead with Emerging Plastic-Wood-Glass Diversification
Concrete and bricks captured 60.42% in 2025, which reflects their volumetric dominance and well-established recycling pathways across public works projects and private developments. The Others category of plastics, wood, and glass is forecast to grow at 7.48% CAGR through 2031, benefiting from AI-enabled recognition, robotic picking, and pretreatment methods that improve purity and enlarge use cases. Mineral fraction economics favor applications such as road base and drainage layers, and improved interfacial transition zones in recycled concrete can mitigate strength penalties at higher substitution rates. Material property contrasts among concrete, brick, and gypsum illustrate why density and water absorption thresholds drive separation strategies, with jigging and density-based methods achieving high-purity outputs at scale. Quality assurance frameworks that emphasize selective demolition and contamination control are helping support structural and semi-structural use cases, which raises confidence in secondary aggregates in the construction and demolition waste management market.
Lower-density fractions are moving from cost centers to revenue opportunities as facilities invest in optical and robotic sortation. Computer vision is distinguishing coatings and surface features that once sent wood and plastics to landfill, which opens up reuse and productization in new channels. Facility case studies show that advanced installations can materially improve recovery rates and environmental performance across plastics, wood, and fines streams. Structural innovations, including carbonation of recycled aggregates, are capturing CO2 while improving permeability characteristics, which supports higher-value uses and advances climate targets in the construction and demolition waste management industry.
By Service: Disposal Incumbency Challenged by Recovery Economics
Landfilling and disposal retained 42.31% in 2025, reflecting both legacy practices and the persistence of mixed and contaminated streams beyond the reach of current recovery economics. Recycling and material recovery, projected to expand at 6.81% CAGR through 2031, is gaining share as automated sorting reduces labor intensity and policy incentives improve the business case for facility upgrades. Local ordinances that lift diversion thresholds, impose refundable deposits, and require verified facility rates are raising the floor for performance and channeling tonnage into higher-value pathways. Jurisdictions that embed digital plans and documentation in permitting have created real-time oversight for diversion targets, which strengthens compliance and helps reduce residuals. Donor-backed national programs that fund equipment, transfer facilities, treatment, and landfill upgrades are catalyzing new ecosystems where private investment had been constrained.
Processing economics continue to shift with scale and technology. Computer vision and robotics have demonstrated large reductions in labor requirements and comparative costs, which improve operating margins in a tight commodity environment. Environmental and public health grants tied to air-quality outcomes are also supporting upstream diversion of green waste and other streams, which reduces contamination pressure in C&D lines. Emerging analytics and verified performance reporting are expected to continue shifting volume from disposal toward recovery in the construction and demolition waste management market as specification frameworks and end-market confidence expand.
Geography Analysis
North America held 34.12% in 2025, reflecting a combination of mature permitting, local diversion mandates, and a growing use of digital compliance tools in project delivery. Federal and state guidance is linking capital grants to measured diversion outcomes, which streamlines reporting and scaling equipment deployments where gaps persist. County and city programs are adding refundable deposits, third-party facility certifications, and plan approvals that improve execution on job sites and raise confidence in downstream facilities. At the regional level, associations highlight new MRF and transfer investments that extend service coverage and internalize material flows. Together, these elements are strengthening diversion infrastructure and analytics across the construction and demolition waste management market in North America.
Asia-Pacific is the fastest-growing region with a 7.82% CAGR outlook, driven by large-scale construction activity, rapid urbanization, and an expanding policy framework in key countries. China generated 2.41 billion tonnes of construction waste in 2024, representing 25.9% of municipal solid waste, which demonstrates the scale at which national and city programs must support recovery. Policy signals include targets under the 14th Five-Year Plan for a resource recycling industry valued at RMB 5 trillion (USD 694.4 billion), and city-level performance ranges indicate room to raise utilization efficiency. Japan’s 97% concrete recycling under its Construction Materials Recycling Law and Singapore’s Green Mark recycled-content credits illustrate how specifications and scoring align the supply of circular materials with project goals. World Bank-backed programs in Southeast Asia are scaling city-level services with performance-based grants and cost recovery measures that support segregation and diversion.
Europe’s framework is anchored by high recovery rates and increasingly harmonized standards for end-of-waste criteria and EPDs, which expand cross-border confidence in secondary materials. The region targets a 24% circular material use rate by 2030, up from 12.2% in 2024, with C&D waste as the largest stream in scope. Ongoing work on end-of-waste criteria prioritizes aggregates, concrete, bricks, and gypsum, which align with the mineral fractions that dominate the construction and demolition waste management market size in Europe. EU-funded pilots have validated structural elements and digital tools that link BIM, non-destructive testing, and AI assessments, advancing QA methods that will matter to specifiers and code officials. The policy and standards trajectory continues to support high-value recycling over backfilling, with Member States adjusting tax and procurement levers to reward secondary material uptake.
Mordor Intelligence provides coverage of the construction and demolition waste management market across other key regional markets. Detailed country-level analysis extends to United Arab Emirates incorporating local coverage and market participation, as required.

Competitive Landscape
Market structure is moderately concentrated, with diversified waste majors operating alongside regional platforms and technology specialists whose core assets are AI training datasets and decision speeds. Technology suppliers are scaling fourth-generation robotics and optical sorters that extend high-purity extraction into challenging mineral fractions and dusty environments where conventional NIR systems struggle. At the plant level, digital control platforms and analytics improve throughput and quality, which feeds into EPD readiness and embodied carbon reporting workflows favored by public procurement. U.S. and EU project specifications are also tightening diversion counting methods and hazardous crossover prevention, which incentivizes integrated players that can verify chain-of-custody across the construction and demolition waste management market.
Strategic moves highlight vertical integration, transfer, and MRF upgrades, and platform partnerships that connect AI vision with legacy processing footprints. Industry association reporting and local government notices point to an ongoing pipeline of county and city projects that internalize recyclable flows and close service gaps in fast-growing areas. EU-funded research demonstrates structural feasibility for recycled aggregates in composite designs, which can unlock new product lines for suppliers focused on low-carbon materials. Standards progress via ISO TC 323 and regional QA frameworks embedded in guidance documents signal that verification and data quality will underpin competitive differentiation.
White-space opportunities are most compelling in geographies where collection and processing infrastructure is still thin and in specialized material streams where QA standards are evolving. National and local programs that link grants to reporting are shifting capital into equipment and data layers that can accelerate diversion in underserved areas of Asia and Africa. Facility-level advances in plastics, wood, and glass recovery also open the door for new entrants focused on low-density materials previously destined for landfill, contingent on consistent feedstock quality and end-market development. Across the construction and demolition waste management market, verification capacity for EPDs, BIM-linked material passports, and compliance-grade data flows is expected to determine which players meet rising procurement and reporting thresholds in North America and Europe.
Construction And Demolition Waste Management Industry Leaders
Veolia
WM (Waste Management)
Republic Services
REMONDIS
GFL Environmental
- *Disclaimer: Major Players sorted in no particular order

Recent Industry Developments
- February 2026: Holcim's 2025 results showed strong EBIT growth and an 18.3% margin, driven by recycling 8 million tonnes of CDM (up 23.5% from 2024), generating CHF 492 million in sales. The company invested CHF 347 million in EU Taxonomy-aligned CapEx, targeting 20+ million tonnes recycled annually and CHF 800+ million in CDM sales by 2030.
- February 2026: In 2025, Veolia secured GBP 1 billion in waste management contracts, expanding to 50+ UK local authorities and growing its municipal services by 35% since 2020. It also invested GBP 1 billion in UK recycling and waste infrastructure over the past decade.
- March 2026: Holcim acquired a majority stake in Cementos Pacasmayo, strengthening its presence in Latin America's cement and aggregates markets. This aligns with its green growth strategy, targeting 30% of Group sales from Solutions & Products.
- March 2026: The World Bank approved a USD 540 million, six-year urban development program for Uganda to benefit 5.6 million people, including 600,000 refugees, across 10 cities, 26 municipalities, and 13 refugee-hosting districts. The initiative will deliver climate-smart infrastructure and create 40,000 direct jobs while enhancing urban resilience.


Research Methodology Framework and Report Scope
Market Definitions and Key Coverage
Our analysis defines the construction waste management market as all paid activities that collect, transport, sort, recycle, recover, or landfill hazardous and non-hazardous materials generated during demolition, renovation, and new-build projects across residential, commercial, industrial, and infrastructure sites worldwide.
Scope Exclusions: Pure municipal solid-waste services that do not treat construction or demolition streams are outside the study's boundary.
Segmentation Overview
- By Waste Type
- Non-Hazardous Waste
- Hazardous Waste
- By Material
- Concrete & Bricks
- Asphalt
- Metal
- Timber
- Soil and Sand
- Gypsum & Drywall
- Others (Plastic, Glass)
- By Service
- Collection & Transportation
- Sorting & Segregation
- Recycling & Material Recovery
- Landfilling & Disposal
- By Geography
- North America
- United States
- Canada
- Mexico
- South America
- Brazil
- Argentina
- Chile
- Colombia
- Europe
- Germany
- United Kingdom
- France
- Italy
- Spain
- Netherlands
- Russia
- Asia Pacifc
- China
- India
- Japan
- South Korea
- Australia
- Southeast Asia (Indonesia, Vietnam, Thailand, Malaysia, Philippines)
- Middle East
- United Arab Emirates
- Saudi Arabia
- South Africa
- Nigeria
- Rest of Middle East And Africa
- North America
Detailed Research Methodology and Data Validation
Primary Research
Mordor analysts interview waste-hauling operators, demolition contractors, regulators, and equipment makers across North America, Europe, the Gulf, and fast-growing Asian metros. These discussions refine diversion targets, average service fees, and on-site technology adoption rates, letting us validate desk findings and adjust any outlier assumptions before model lock-in.
Desk Research
We start with structured reviews of tier-1 public sources such as the US EPA material-flow tables, Eurostat C&D recycling dashboards, OECD construction output data, and UNEP circular-economy briefs, which anchor baseline generation rates. Trade-body papers from the Construction Products Association and the Global Cement Directory help us map material recovery value chains, while company filings, investor decks, and news feeds accessed via D&B Hoovers and Dow Jones Factiva illuminate pricing and capacity changes. The resulting secondary evidence shapes initial tonnage, service-mix splits, and historic price corridors. This list is illustrative; many additional references guide data checks and contextual understanding.
Market-Sizing & Forecasting
We apply a hybrid top-down approach that begins with country-level construction spending, building-floor-area additions, and demolition permits; these flows are multiplied by documented waste-generation intensities (kg per m²) and adjusted for material-specific diversion quotas and landfill-gate-fee inflation. Supplier roll-ups of crusher output, landfill volumes, and sampled average service prices provide bottom-up cross-checks that cap or lift totals when variances exceed analyst thresholds. Key drivers include urban floor-space additions, landfill tipping-fee indices, regulatory recycling targets, recycled-aggregate price spreads, and AI-sorting equipment penetration; these factors feed a multivariate regression that projects demand through 2030. Gap handling uses regional analogs where data are thin and applies conservative coefficients flagged during primary interviews.
Data Validation & Update Cycle
Outputs face multi-stage variance screens, senior-analyst peer review, and anomaly resolution. We refresh each model annually and trigger mid-cycle updates when policy shifts, major mergers, or macro shocks move any input beyond a predefined tolerance band. Clients therefore receive a living baseline signed off just before publication.
Why Mordor's Construction Waste Management Baseline Commands Reliability
Published figures often diverge because firms pick different waste types, material mixes, price bases, and refresh cadences. We disclose our inclusions upfront, anchor values to verifiable material-flow statistics, and revisit inputs more frequently than most houses.
Key gap drivers include whether soil and dredging spoil are counted, how hazardous surcharges are averaged, currency-conversion dates, and the year chosen for base-case construction spending. Our disciplined scope and yearly recalibration minimize such drift.
Benchmark comparison
| Market Size | Anonymized source | Primary gap driver |
|---|---|---|
| USD 115.4 billion (2025) | Mordor Intelligence | - |
| USD 118.69 billion (2024) | Regional Consultancy A | Includes municipal renovation debris and converts currencies at prior-year averages |
| USD 232.1 billion (2023) | Global Consultancy B | Counts soil and dredged spoil, applies peak service prices, and uses a two-year-old construction output base |
These contrasts show why planners seeking a balanced, transparent, and reproducible baseline rely on Mordor Intelligence: our numbers rest on clearly defined boundaries, current data, and repeatable steps that can be traced end-to-end.


Key Questions Answered in the Report
What is the size and growth outlook for the construction and demolition waste management market?
The market is projected at USD 115.4 billion in 2025, USD 122.6 billion in 2026, and USD 165.9 billion by 2031 at a 6.23% CAGR over 2026-2031.
Which regions lead and which are growing fastest in construction and demolition waste management?
North America led with 34.12% in 2025 while Asia-Pacific is the fastest-growing with a projected 7.82% CAGR through 2031.
Which services are gaining share in construction and demolition waste management?
Landfilling and disposal held 42.31% in 2025, but recycling and material recovery is forecast to grow at 6.81% CAGR through 2031.
What policies are shaping demand for recycled construction materials?
European Union CPR EPD mandates, end-of-waste criteria efforts, U.S. SWIFR reporting, and China’s circular economy plan are accelerating high-value recovery and secondary material use.
What technologies are changing the economics of C&D recovery?
AI-enabled optical sorting, robotic picking, and digitalized plant controls are improving purity, reducing labor, and lifting throughput, which strengthens the recovery business case.
Page last updated on:


