Confectionery Ingredients Market Size and Share
Market Overview
| Study Period | 2021 - 2031 |
|---|---|
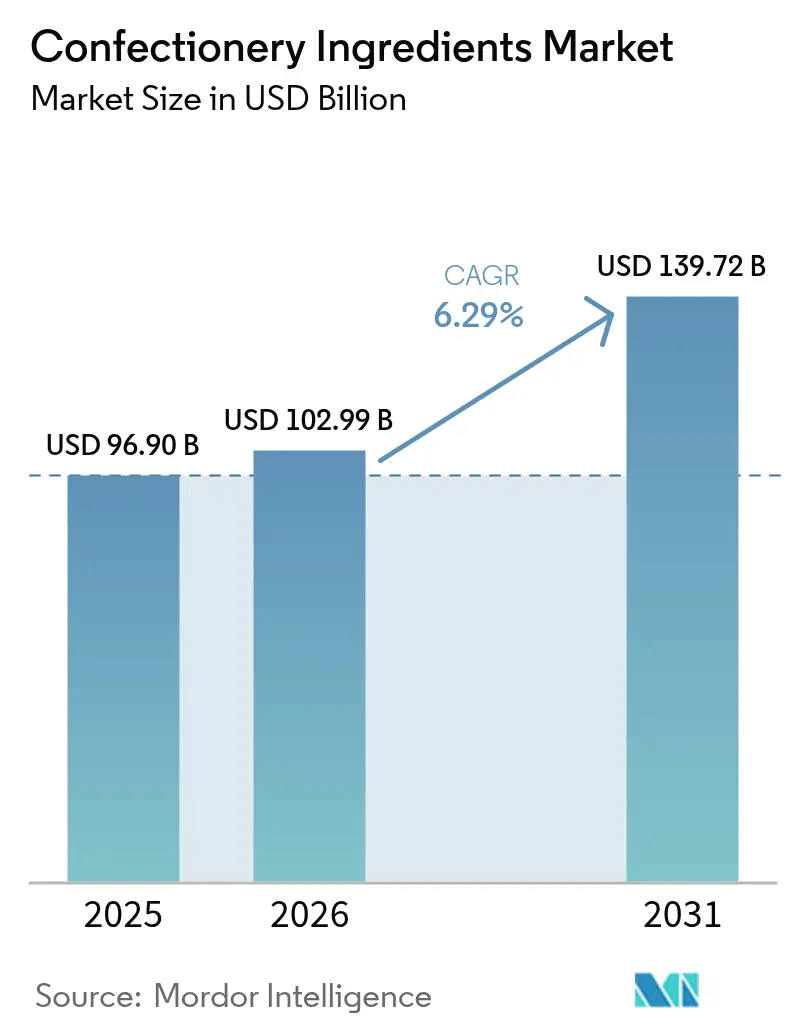
| Market Size (2026) | USD 102.99 Billion |
| Market Size (2031) | USD 139.72 Billion |
| Growth Rate (2026 - 2031) | 6.29% CAGR |
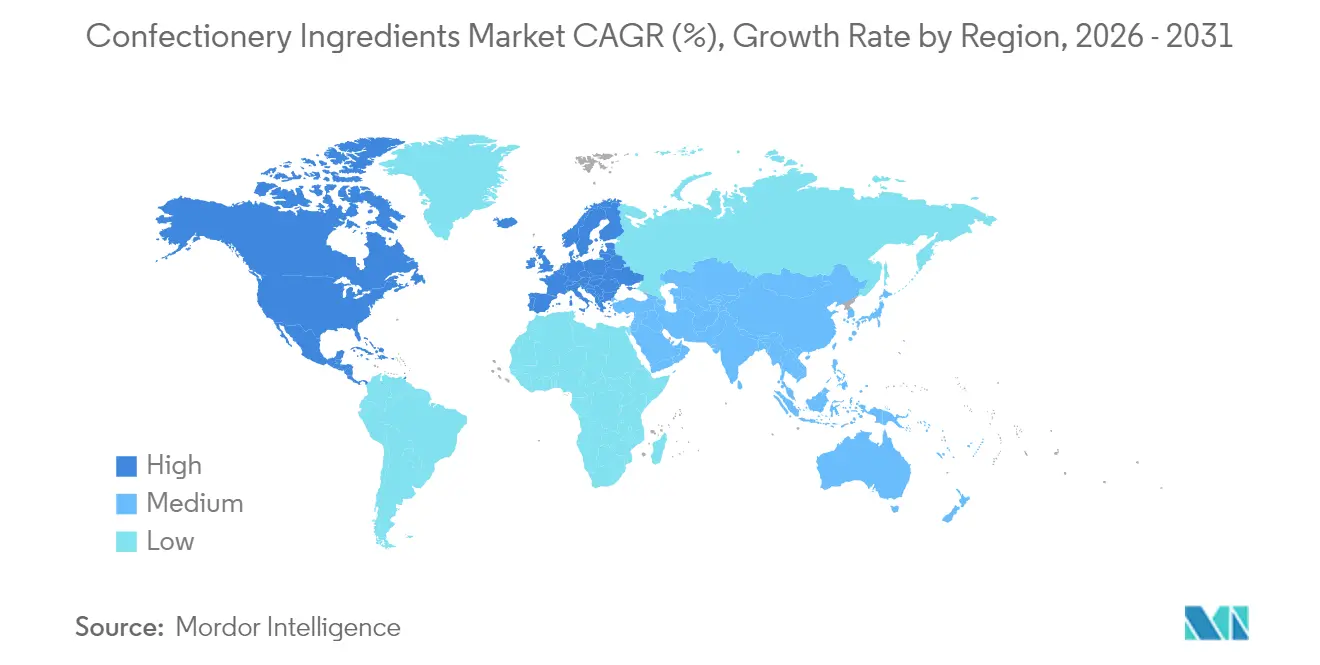
| Fastest Growing Market | Asia Pacific |
| Largest Market | Europe |
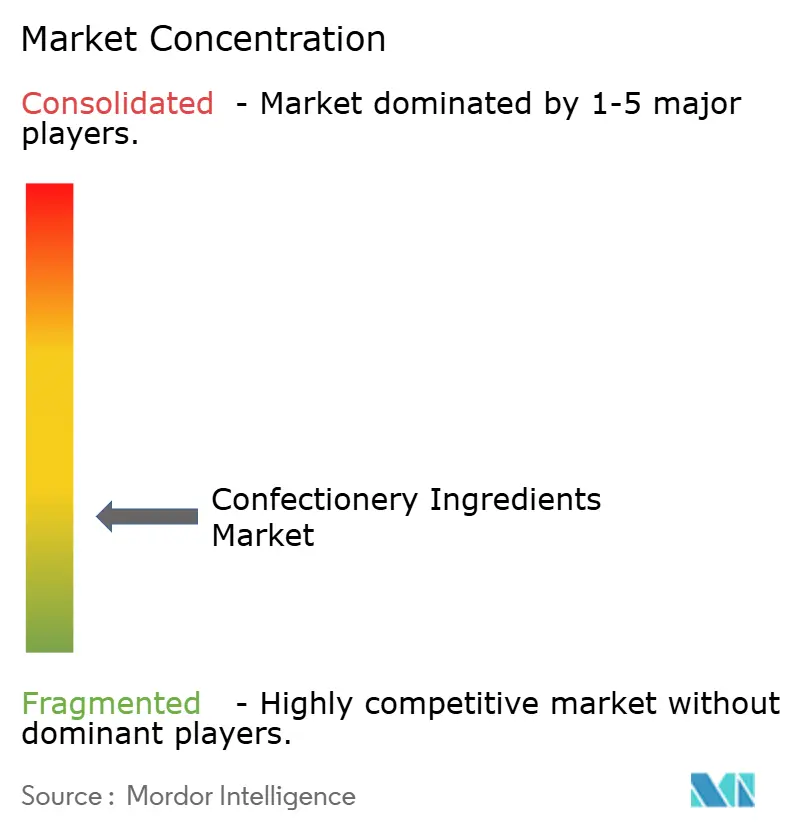
| Market Concentration | Low |
Major Players
*Disclaimer: Major Players sorted in no particular order Image © Mordor Intelligence. Reuse requires attribution under CC BY 4.0. |
|
Confectionery Ingredients Market Analysis by Mordor Intelligence
Confectionery ingredients market size in 2026 is estimated at USD 102.99 billion, growing from 2025 value of USD 96.90 billion with 2031 projections showing USD 139.72 billion, growing at 6.29% CAGR over 2026-2031. This growth trajectory is buoyed by a consistent consumer appetite for premium products, an escalating preference for sugar-reduced formulations, and a regulatory push towards traceable and ethically sourced ingredients. The increasing demand for clean-label products and natural ingredients is also driving innovation in the market, as manufacturers focus on meeting consumer preferences for healthier and more sustainable options. Additionally, advancements in ingredient processing technologies are enabling the development of novel textures and flavors, further enhancing product appeal. The Asia-Pacific region, bolstered by a burgeoning middle class and trends such as freeze-dried candy, is seeing a growing appetite for innovative flavors and textures. The region's rapid urbanization and rising disposable incomes are further expanding the market's addressable demand, making it a key growth area for confectionery ingredient manufacturers.
Key Report Takeaways
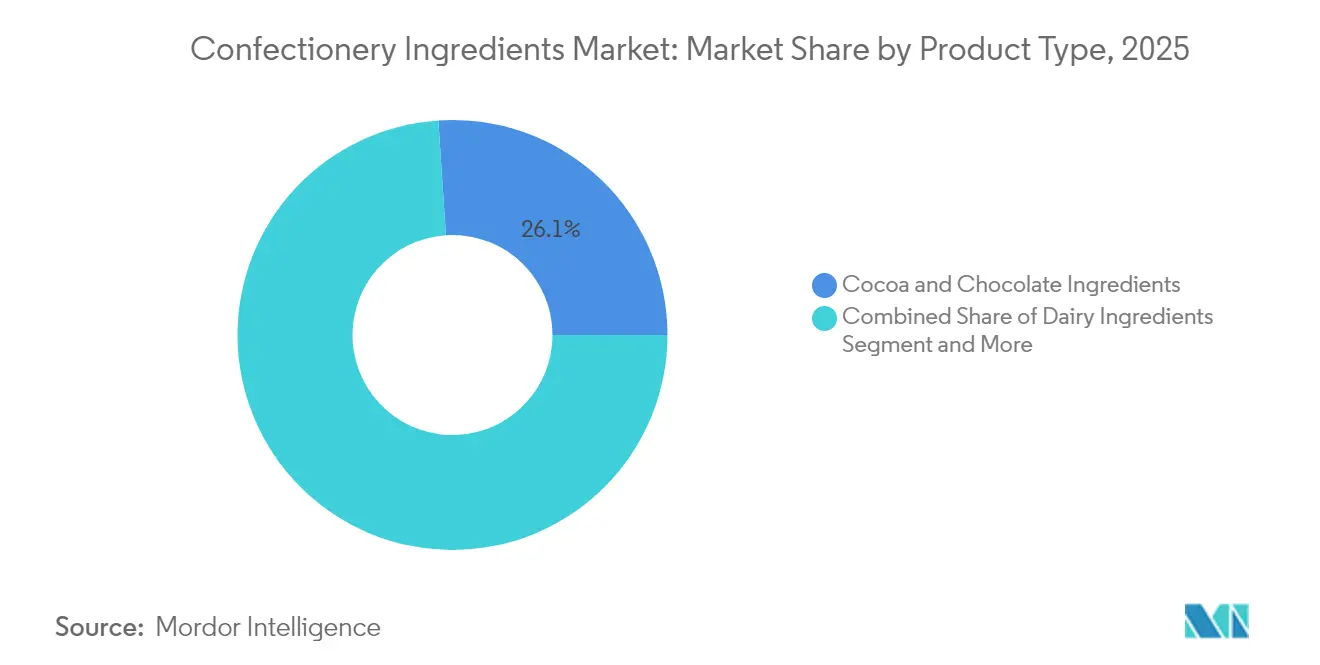
- By product type, cocoa and chocolate ingredients led with a 26.05% revenue share in 2025; flavor ingredients are projected to advance at a 7.62% CAGR through 2031.
- By nature, natural ingredients commanded a 70.20% share in 2025 and are forecast to expand at a 7.71% CAGR to 2031.
- By form, dry formats held 68.55% of the confectionery ingredients market share in 2025, while liquid formats are set to grow at 7.45% CAGR during 2026-2031.
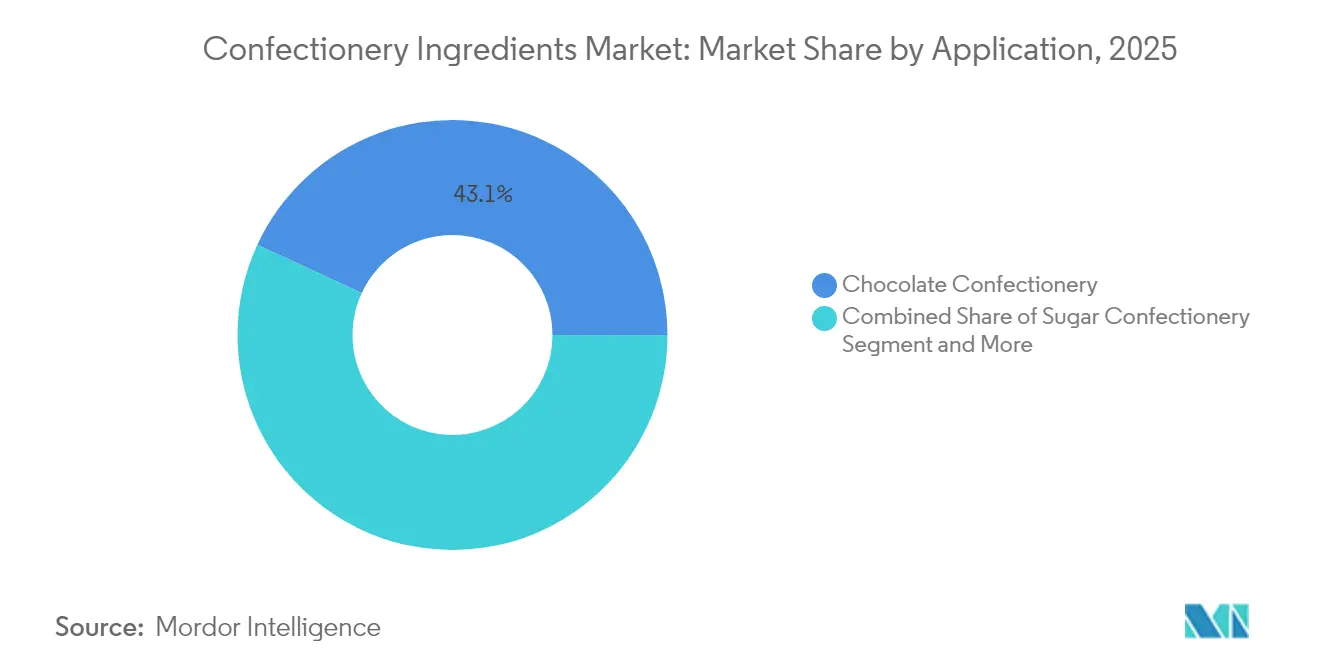
- By application, chocolate confectionery accounted for 43.10% of the confectionery ingredients market size in 2025; gums and jellies represent the fastest-growing application with an 7.83% CAGR to 2031.
- By geography, Europe retained the largest regional footing with 33.65% revenue share in 2025, whereas Asia-Pacific is poised for the strongest 8.02% CAGR through 2031.
Note: Market size and forecast figures in this report are generated using Mordor Intelligence’s proprietary estimation framework, updated with the latest available data and insights as of 2026.
Market Trends and Insights
Drivers Impact Analysis of Confectionery Ingredients Market*
| Driver | (~) % Impact on CAGR Forecast | Geographic Relevance | Impact Timeline |
|---|---|---|---|
| Surging demand for premium and artisanal confectionery | +1.2% | Global, with concentration in North America and Europe | Medium term (2-4 years) |
| Expansion of sugar-free and low calorie confectionary | +0.9% | Global, led by developed markets | Long term (≥ 4 years) |
| Growing demand for innovative flavors and textures | +1.1% | Global, with early adoption in Asia-Pacific | Short term (≤ 2 years) |
| Widespread adoption of sustainable cocoa and sugar | +0.8% | Global, driven by Europe regulations | Long term (≥ 4 years) |
| Adoption of advanced coating, glazing, and enrobing technologies | +0.7% | North America and Europe, expanding to Asia-Pacific | Medium term (2-4 years) |
| Increased demand for organic and natural Ingredients | +1.0% | Global, strongest in developed markets | Medium term (2-4 years) |
| Source: Mordor Intelligence | |||
Surging demand for premium and artisanal confectionery
The growing consumer preference for high-quality, unique, and handcrafted confectionery products is driving the demand for premium and artisanal confectionery. This trend is particularly evident in developed markets, where consumers are willing to pay a premium for products that offer superior taste, quality, and exclusivity. Additionally, government initiatives promoting local artisanal businesses and small-scale confectionery producers are further fueling this demand. For instance, the European Union has implemented programs under its Common Agricultural Policy (CAP) to support small-scale food producers, including artisanal confectionery manufacturers, by providing subsidies and grants [1]Source: European Commission, "The common agricultural policy at a glance", www.agriculture.ec.europa.eu. Similarly, in India, the Ministry of Food Processing Industries (MoFPI) has launched schemes such as the Formalization of Micro Food Processing Enterprises to assist small and medium enterprises in scaling their operations and improving product quality. These initiatives are enabling artisanal confectionery producers to expand their reach and cater to the increasing consumer demand for premium confectionery products.
Expansion of sugar-free and low calorie confectionary
Regulatory bodies and consumers alike are rallying behind the sugar reduction movement, driven by growing health concerns and the increasing prevalence of lifestyle diseases such as diabetes and obesity. A landmark moment arrived when the FDA greenlit the Brazzein sweetener, a game-changer for zero-calorie confectionery recipes. Sourced from a West African plant, this sweetener adeptly tackles the challenge of preserving taste and texture even with reduced sugar levels. Its approval provides manufacturers with a viable solution to create healthier confectionery products while adhering to WHO's guidelines advocating for diminished sugar consumption. This development also aligns with the broader industry trend of formulating products that cater to health-conscious consumers without compromising on sensory appeal. Meanwhile, China's GB 2760-2024 standards have been updated, introducing new stipulations for aspartame and acesulfame potassium [2]Source: Food Compliance International, "CFSA officially implements the standard for the use of food additives (GB 2760-2024)", www.foodcomplianceinternational.com. Such regulatory advancements are expected to drive innovation in the sugar-free and low-calorie confectionery market, encouraging manufacturers to explore novel sweetener solutions that meet both safety standards and consumer preferences.
Growing demand for innovative flavors and textures
As consumers increasingly seek novel sensory experiences, the confectionery ingredients market is experiencing significant growth driven by innovation in flavor and texture ingredients. Notably, DSM-Firmenich's declaration of 'Milky Maple' as the Flavor of the Year 2025 underscores this trend, reflecting the industry's focus on catering to evolving consumer preferences. The demand for unique taste profiles is encouraging manufacturers to experiment with unconventional combinations, creating products that stand out in a competitive market. Furthermore, emulsifiers have taken center stage in the quest for optimal texture. Recent studies highlight the pivotal roles of lecithin, ammonium phosphatides, and polyglycerol polyricinoleate in shaping both the rheological and sensory attributes of chocolate. These advancements are enabling manufacturers to create unique and appealing confectionery products, further fueling market expansion. The growing emphasis on premiumization and indulgence in confectionery products has also amplified the need for innovative ingredients that enhance both flavor and texture.
Widespread adoption of sustainable cocoa and sugar
Sustainability initiatives are reshaping sourcing practices for cocoa and sugar, driving growth in the confectionery ingredients market. The African Regional Standard for Sustainable Cocoa (ARS-1000) now offers a framework to align with EU Deforestation Regulation mandates, ensuring compliance and fostering sustainable practices [3]Source: World Cocoa Foundation, "Africa’s sustainable cocoa standard: 3 things to know about ARS-1000",www.worldcocoafoundation.org. This shift is encouraging manufacturers to adopt environmentally friendly sourcing methods, which is becoming a critical factor in consumer purchasing decisions. Meanwhile, Fairtrade's updated cocoa standard underscores a collective responsibility throughout the supply chain, urging commercial entities to bolster farmer organizations in their fight against child labor and deforestation. These efforts not only enhance the ethical appeal of confectionery products but also contribute to long-term sustainability in the market, further influencing the demand for responsibly sourced cocoa and sugar.
Restraints Impact Analysis of Confectionery Ingredients Market*
| Restraint | (~) % Impact on CAGR Forecast | Geographic Relevance | Impact Timeline |
|---|---|---|---|
| Health concerns over high sugar and calorie intake | -0.8% | Global, strongest in developed markets | Long term (≥ 4 years) |
| Stringent regulatory compliance regarding additives and labeling | -0.6% | Global, with varying regional intensity | Medium term (2-4 years) |
| Volatility in prices of key raw materials | -1.2% | Global, most severe in cocoa-dependent regions | Short term (≤ 2 years) |
| Rising prevalence of food allergies | -0.4% | Global, concentrated in developed markets | Long term (≥ 4 years) |
| Source: Mordor Intelligence | |||
Health concerns over high sugar and calorie intake
Rising health concerns linked to excessive sugar and calorie consumption act as a significant restraint in the confectionery ingredients market. Increasing awareness among consumers about the adverse health effects of high sugar and calorie intake, such as obesity, diabetes, and cardiovascular diseases, has led to a shift in preferences toward healthier alternatives. International Diabetes Federation reports that in 2024, around 589 million adults aged 20-79 are living with diabetes, with projections indicating a rise to 853 million by 2050 [4]Source: International Diabetes Federation, "Diabetes around the world in 2024", www.idf.orgGovernments and health organizations worldwide are also implementing stringent regulations and campaigns to reduce sugar consumption, further impacting the demand for traditional confectionery ingredients. This growing focus on health and wellness is compelling manufacturers to innovate and develop low-sugar or sugar-free alternatives, which could potentially alter the dynamics of the market. However, the challenge lies in maintaining the taste and texture of confectionery products while adhering to these health-driven demands, posing a significant hurdle for market players.
Volatility in prices of key raw materials
The confectionery ingredients market faces a significant restraint due to the volatility in the prices of key raw materials. Fluctuations in the costs of essential ingredients, such as sugar, cocoa, and dairy products, directly impact production expenses. These price variations are often driven by factors like unpredictable weather conditions, geopolitical tensions, and supply chain disruptions. For instance, adverse weather conditions in cocoa-producing regions can lead to reduced yields, causing a spike in cocoa prices. Similarly, geopolitical issues, such as trade restrictions or tariffs, can disrupt the supply of sugar and dairy products, further exacerbating price instability. Additionally, the rising demand for these raw materials in other industries, such as beverages and bakery, intensifies competition, leading to further price fluctuations. Such instability poses challenges for manufacturers in maintaining consistent pricing and profit margins, thereby affecting the overall market dynamics and hindering growth during the forecast period.
*Our forecasts treat driver/restraint impacts as directional, not additive. The impact forecasts reflect baseline growth, mix effects, and variable interactions.
Confectionery Ingredients Market Segment Analysis
By Product Type:
Cocoa Dominance Challenged by Flavor InnovationIn 2025, cocoa and chocolate ingredients held a 26.05% share of the confectionery ingredients market. However, disruptions in sourcing and rising costs are eroding their historical advantage. The volatility in cocoa supply chains, driven by factors such as climate change and geopolitical instability in key cocoa-producing regions, has significantly impacted the cost structure for manufacturers. To mitigate these challenges, manufacturers are increasingly exploring partial-replacement solutions, such as blending cocoa with alternative ingredients, to maintain product quality while controlling costs. Despite these efforts, the market size for cocoa applications in confectionery ingredients is projected to grow at a subdued pace, reflecting the ongoing pressures in the supply chain and cost dynamics.
Flavor ingredients are poised to achieve a 7.62% CAGR through 2031, driven by evolving consumer preferences and innovation in product offerings. Brands are increasingly focusing on differentiation by introducing exotic flavor profiles and cross-category fusion beverages, catering to the demand for unique and premium experiences. Flavor houses are leveraging advancements in biotechnology to develop flavors more efficiently, reducing the time-to-market for new products. Additionally, the utilization of regional crop biodiversity is enabling the creation of authentic and locally inspired flavors, which resonate with consumers seeking natural and sustainable options. These strategies are positioning flavor ingredients as a critical component in the future revenue mix of the confectionery market.


By Nature:
Natural Ingredients Surge Amid Clean-Label MovementNatural Ingredients accounted for 70.20% of the total revenue in 2025. These ingredients have emerged as the most dynamic contributor to the market, driven by increasing consumer demand for healthier and more sustainable options. The segment is projected to expand at a robust CAGR of 7.71% through 2031, reflecting the growing preference for natural and clean-label products. This trend is further supported by advancements in ingredient sourcing and processing technologies, which enable manufacturers to meet evolving consumer expectations while maintaining product quality and taste. Additionally, the rising awareness of the health benefits associated with natural ingredients, such as reduced artificial additives and preservatives, has significantly influenced consumer purchasing decisions.
Manufacturers are increasingly focusing on incorporating plant-based, organic, and minimally processed ingredients to cater to this demand. Furthermore, regulatory support for natural and organic certifications has encouraged market players to innovate and expand their product portfolios. The growing emphasis on sustainability and ethical sourcing practices has also played a crucial role in driving the adoption of natural ingredients, as consumers increasingly prioritize environmentally friendly and socially responsible products. This shift in consumer behavior is expected to create substantial growth opportunities for the natural ingredients segment in the confectionery market during the forecast period.
By Application:
Chocolate Confectionery Leads While Gums Show Rapid GrowthIn 2025, chocolate maintained a dominant 43.10% share of the global confectionery market revenue. This dominance is attributed to its enduring cultural significance and its role as a preferred choice for premium gifting occasions. Chocolate's popularity is deeply rooted in traditions across various regions, making it a staple in celebrations and festive events. However, this strong market position is increasingly under pressure due to the inflation of confectionery ingredient costs, primarily driven by cocoa shortages. These shortages have disrupted the supply chain, leading to higher production costs. To mitigate these challenges, manufacturers are adopting cost-engineering measures, such as incorporating extenders and alternative fats, to maintain profitability without compromising product quality.
Gums and jellies are emerging as a significant segment within the global confectionery market, projected to grow at a robust 7.83% CAGR through 2031. This growth is fueled by their versatility and alignment with evolving consumer preferences. These products leverage chewable delivery formats, which are increasingly being used to incorporate vitamins, botanicals, and other functional ingredients. This innovation aligns with the rising trend of wellness snacking, as consumers seek convenient and enjoyable ways to integrate health benefits into their diets. Additionally, gums and jellies are gaining traction due to their appeal across various age groups, from children to adults, and their ability to cater to diverse flavor preferences. As a result, gums and jellies are poised to play a pivotal role in the future growth of the confectionery market.
By Form:
Dry Ingredients Maintain Leadership Despite Liquid GrowthIn 2025, dry formats commanded a significant 68.55% share of the confectionery ingredients market. Their dominance is attributed to several advantages, including ambient logistics, which reduce the need for specialized storage and transportation conditions, making them cost-effective and convenient for manufacturers. Additionally, dry formats offer an extended shelf life, ensuring product stability over longer periods, which is particularly beneficial for bulk storage and distribution. These formats also integrate seamlessly into existing processing lines, allowing manufacturers to batch and process them efficiently without requiring significant modifications to their equipment. This adaptability and cost-efficiency make dry formats a preferred choice for many confectionery producers globally.
Liquid ingredients, while holding a smaller share of the market, are experiencing a robust 7.45% CAGR, highlighting their growing importance in the confectionery industry. These ingredients are indispensable in specific applications such as enrobing, glazing, and compound-coating processes, where their unique properties are critical. Liquid ingredients enable quick setup times, which enhance production efficiency, and their ability to achieve homogeneous dispersion ensures consistent quality in the final product. Their versatility allows manufacturers to create a wide range of textures and finishes, catering to diverse consumer preferences. Despite requiring more specialized handling and storage compared to dry formats, the functional benefits of liquid ingredients make them a vital component in the production of premium and innovative confectionery products.
Geography Analysis
EMEA, APAC and The Americas Confectionery Ingredients Market
In 2025, Europe commands a dominant 33.65% market share, propelled by its rigorous quality standards, a growing appetite for premium products, and robust regulatory frameworks that champion innovation in natural ingredients and sustainable sourcing. The European Food Safety Authority bolsters the region's leadership, actively ensuring ingredient safety with timely approvals for novel food applications and refreshed safety assessment guidelines. Additionally, the region's focus on sustainability and traceability in the supply chain has further strengthened its position in the market. European consumers are increasingly prioritizing products with clean labels, organic certifications, and environmentally friendly packaging, pushing manufacturers to innovate and align with these preferences. The region's well-established retail infrastructure and strong presence of global and local players also contribute to its sustained dominance. Asia-Pacific is set to outpace others, boasting an 8.02% CAGR from 2026 to 2031, fueled by rising disposable incomes, a burgeoning middle class, and a surge in chocolate consumption across its developing markets. The region's rapid urbanization and increasing exposure to Western lifestyles have significantly influenced consumer preferences, driving demand for premium and innovative confectionery products. Countries like China and India are emerging as key growth drivers due to their large populations and expanding retail sectors. Additionally, the rise of e-commerce platforms in the region has enhanced product accessibility, further boosting sales. Manufacturers are also focusing on introducing region-specific flavors and healthier alternatives to cater to the evolving tastes and health-conscious attitudes of consumers. North America, with its cutting-edge manufacturing and vibrant innovation ecosystem, sees consumers gravitating towards premium and functional confectionery. Yet, the region grapples with a health-conscious trend that limits traditional sugar-based products. Nevertheless, the North American regulatory landscape is a boon for innovation, as evidenced by the FDA's green light on natural color additives and sweeteners like Brazzein, paving the way for healthier confectionery options. South America demonstrates steady growth, driven by increasing urbanization, rising disposable incomes, and a growing preference for indulgent confectionery products. The Middle East and Africa region is witnessing gradual growth, supported by a young and expanding population, increasing urbanization, and a rising demand for affordable confectionery products.

Competitive Landscape
The global confectionery ingredients market exhibits significant fragmentation with a concentration score of 3 out of 10, creating opportunities for both established multinational corporations and emerging specialized suppliers to capture market share through innovation and strategic positioning. This fragmentation reflects the diverse nature of ingredient requirements across different confectionery applications and the ongoing evolution of consumer preferences toward premium, natural, and functional ingredients.
Companies are increasingly consolidating, aiming to curate comprehensive ingredient portfolios and harness synergies throughout the value chain. A pivotal differentiator in this landscape is technology adoption. Firms are channeling investments into precision fermentation, sustainable sourcing platforms, and the development of alternative ingredients, all in a bid to tackle supply chain hurdles and meet the changing demands of consumers. These technological advancements not only enhance production efficiency but also enable companies to align with sustainability goals and cater to the growing demand for innovative, health-focused confectionery products. By leveraging such technologies, companies can better address challenges like ingredient shortages, cost pressures, and the need for environmentally friendly solutions.
Notable disruptors in the field include biotechnology firms pioneering precision fermentation and startups championing upcycled ingredients. These efforts are bolstered by initiatives such as Ajinomoto's Next Generation Taste and Texture Technologies competition, which offers equity-free funding for ingredient innovation. Furthermore, the competitive landscape is increasingly influenced by regulatory compliance. Companies adept at navigating the intricate web of global standards are reaping benefits in terms of market access and bolstered consumer trust.
Confectionery Ingredients Industry Leaders
-
Cargill, Incorporated
-
Archer Daniels Midland Company
-
Kerry Group plc
-
Tate and Lyle PLC
-
Barry Callebaut AG
- *Disclaimer: Major Players sorted in no particular order
Confectionery Ingredients Market Companies Covered in this Report
- Cargill, Incorporated
- Archer Daniels Midland Company
- Kerry Group plc
- Tate and Lyle PLC
- Ingredion Incorporated
- Barry Callebaut AG
- Olam International Limited
- AAK AB
- Givaudan SA
- DSM-Firmenich
- Bunge Limited
- Corbion N.V.
- Puratos Group
- Symrise AG
- Bühler Group
- Jungbunzlauer Suisse AG
- Ajinomoto Co., Inc.
- Südzucker AG
- Sensient Technologies
- Fuji Oil Holdings

Recent Industry Developments in Confectionery Ingredients Market
- April 2025: Altinmarka, a cocoa and chocolate manufacturer, has partnered with Swiss-Ghana Koa to launch their latest product: Cacaonly chocolate. This groundbreaking range utilizes upcycled cocoa fruit pulp as a natural sweetener, eliminating refined sugars.
- January 2025: FlavorSum, a flavor producer based in North America, broadened its portfolio to introduce flavors with modulating properties (FMPs). These FMPs are designed to tackle specific taste challenges in various food and beverage items including confectionery ingredients. The newly introduced flavor systems possess the capability to mask bitterness, elevate mouthfeel, and reduce undesirable off-notes in products.
- December 2024: Tate & Lyle PLC, a key player in the confectionery ingredients market, has partnered with BioHarvest Sciences to revolutionize the sweetener market. Leveraging BioHarvest's advanced botanical synthesis technology, the duo aims to craft plant-based sweeteners that not only taste better but also boast enhanced sustainability credentials.
- February 2024: Brookside Flavors and Ingredients completed the acquisition of Sterling Food Flavorings, a manufacturer of flavoring systems for the food and beverage industry. The acquisition strengthens Brookside's product portfolio and expands its offerings to current and potential customers.


Confectionery Ingredients Market Report Scope and Research Methodology
Market Definition and Coverage
Our study views the confectionery ingredients market as the annual value of cocoa and chocolate, dairy derivatives, sweeteners, flavors, colors, oils and shortening, emulsifiers, and allied inputs sold to makers of chocolate, sugar candies, gums, jellies, and related treats. The scope tracks finished ingredient shipments, import-export flow, and contract tolling revenues, expressed in USD.
Scope Exclusions: Pharmaceutical actives, tabletop sugar substitutes sold at retail, and food-service recipe mixes lie outside the present definition.
Segments Covered in This Report
-
By Type
- Cocoa and Chocolate
- Dairy Ingredients
- Sweeteners
- Flavor
- Colors
- Oils and Shortening
- Emulsifiers
- Others
-
By Nature
- Artificial
- Natural
-
By Form
- Dry
- Liquid
-
By Application
- Chocolate Confectionery
- Sugar Confectionery
- Gums and Jellies
- Others
-
By Geography
-
North America
- United States
- Canada
- Mexico
- Rest of North America
-
Europe
- Germany
- United Kingdom
- Italy
- France
- Spain
- Poland
- Rest of Europe
-
Asia-Pacific
- China
- India
- Japan
- Australia
- Rest of Asia-Pacific
-
South America
- Brazil
- Argentina
- Rest of South America
-
Middle East and Africa
- South Africa
- Saudi Arabia
- United Arab Emirates
- Rest of Middle East and Africa
-
North America
Data Sources, Market Sizing, and Validation
Primary Research
To validate desk findings, we interviewed ingredient technologists in Europe, procurement heads at mid-size Asian confectioners, and distributor managers in Latin America. Follow-up surveys clarified clean-label adoption rates, liquid-form uptake, and current conversion losses, helping us trim model error margins.
Desk Research
Mordor analysts began with publicly available cornerstones such as UN Comtrade cocoa grindings, FAOSTAT sugar output, Eurostat food additive trade tables, USDA cocoa price series, and position papers from bodies such as CAOBISCO and the National Confectioners Association. Company 10-Ks, investor decks, and customs logs were mined to benchmark average selling prices and regional mix. Data bridges for smaller economies were filled using respected paid databases, for example, D&B Hoovers for supplier financials and Dow Jones Factiva for volume-weighted price checks. The sources cited above illustrate the mix and are not exhaustive.
Market-Sizing and Forecasting
A top-down build starts with cocoa grindings, regional confectionery output, and export ratios; these volumes are linked to weighted average ingredient usage rates to reach a baseline. Results are then stress-tested with selective bottom-up snapshots (supplier roll-ups and channel checks) before a single consolidated total is frozen. Key variables feeding our multivariate regression forecast include per-capita confectionery spend, retail sugar prices, premium product launches, share of natural colors, and regional GDP growth. An ARIMA overlay captures seasonality spikes tied to festive demand. Gap pockets in bottom-up estimates are smoothed with moving averages of import data.
Data Validation and Update Cycle
Model outputs pass variance checks versus historical series, anomaly flags trigger analyst re-runs, and senior review precedes sign-off. The dataset is refreshed annually; interim updates occur when raw-material shocks or regulatory shifts materially alter the outlook.
How Mordor Intelligence's Confectionery Ingredients Market Size Compares to Other Published Estimates
Published estimates often differ because firms choose alternate ingredient baskets, pricing assumptions, and refresh cadences. Mordor's disciplined blend of transparent scope, double-path modeling, and yearly contact with market participants delivers a figure users can reproduce with modest effort.
Key Gap Drivers: some publishers fold bakery fats or food-service mixes into totals, others quote factory-gate prices from one region across the globe, and a few extrapolate five-year-old volumes without reconfirming clean-label penetration. Our annual refresh and dual validation curb these drifts.
Benchmark comparison
| Market Size | Anonymized source | Primary gap driver |
|---|---|---|
| USD 96.9 B (2025) | Mordor Intelligence | - |
| USD 78.3 B (2023) | Global Consultancy A | Older base year and narrower regional coverage |
| USD 109.5 B (2025) | Industry Association B | Includes bakery shortenings and sugar-free table-tops |
| USD 80.7 B (2023) | Regional Consultancy C | Applies uniform ASPs, limited import reconciliation |
In sum, the side-by-side view confirms that Mordor's numbers sit between aggressive and conservative peers, reflecting verified usage factors and the most current trade data, giving decision-makers a balanced starting point.


Key Questions Answered in the Report
What is the current size of the confectionery ingredients market?
The confectionery ingredients market size is USD 102.99 billion in 2026 and is forecast to reach USD 139.72 billion by 2031.
Which region is growing fastest in confectionery ingredients?
Asia-Pacific leads growth with an 8.02% CAGR through 2031, propelled by rising disposable incomes and regulatory harmonization.
What ingredient types are gaining share fastest?
Flavor systems are expanding at a 7.62% CAGR as brands prioritize sensory differentiation, while natural additives overall post a 7.71% CAGR.
How are health trends shaping the market?
Regulations and consumer demand for sugar reduction drive investment in sweeteners like Brazzein and precision-fermented bulking agents.
Page last updated on:


