Condensed Milk Market Size and Share
Market Overview
| Study Period | 2021 - 2031 |
|---|---|
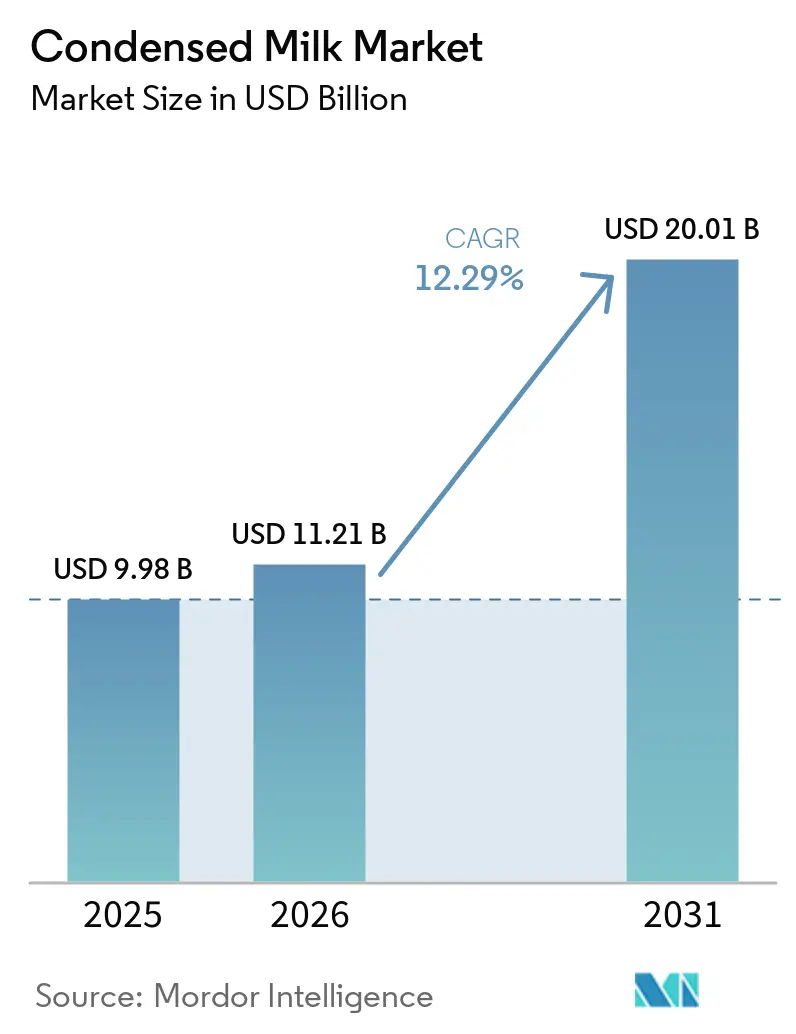
| Market Size (2026) | USD 11.21 Billion |
| Market Size (2031) | USD 20.01 Billion |
| Growth Rate (2026 - 2031) | 12.29% CAGR |
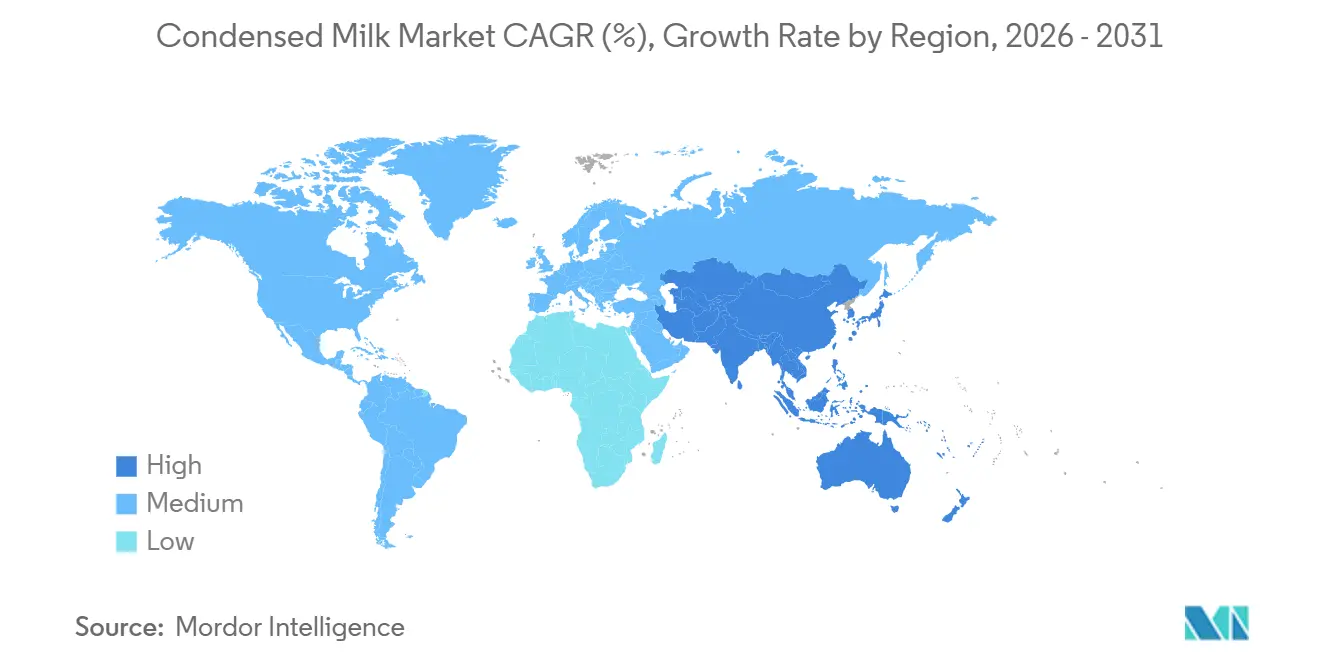
| Fastest Growing Market | Asia Pacific |
| Largest Market | North America |
| Market Concentration | Medium |
Major Players
*Disclaimer: Major Players sorted in no particular order Image © Mordor Intelligence. Reuse requires attribution under CC BY 4.0. |
|
Condensed Milk Market Analysis by Mordor Intelligence
The Condensed Milk Market size is projected to be USD 9.98 billion in 2025, USD 11.21 billion in 2026, and reach USD 20.01 billion by 2031, growing at a CAGR of 12.29% from 2026 to 2031. The market has evolved from being merely a traditional dairy product to a crucial ingredient in bakery manufacturing, ready-to-drink beverages, and plant-based products. This growth is driven by consistent demand from both industrial food processing and retail sectors, where the long shelf life and versatility of condensed milk help manufacturers effectively manage their supply chain operations. The expansion of the market is further supported by an increase in bakery and confectionery production, particularly in emerging markets where urban populations contribute to higher consumption of packaged desserts and convenience foods. Additionally, the incorporation of sweetened condensed milk in ready-to-drink coffee beverages has created new opportunities, as manufacturers use it for sweetening and enhancing texture to cater to the growing café culture.
Key Report Takeaways
- By product type, dairy formulations captured 86.52% share in 2025; non-dairy/plant-based alternatives are projected to rise at a 14.01% CAGR.
- By category, sweetened variants dominated with a 70.50% share in 2025, whereas unsweetened milk is forecast to post a 13.59% CAGR from 2026 to 2031.
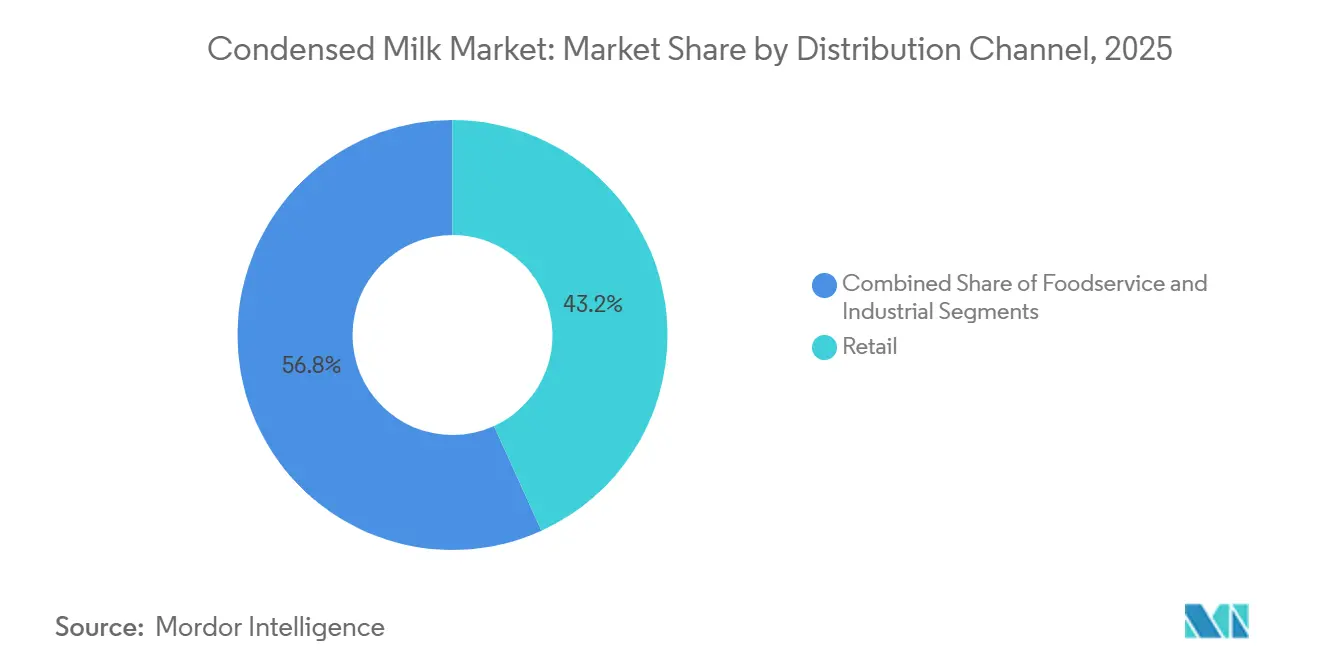
- By packaging type, cans captured 56.80% of the condensed milk market share in 2025, while tube formats are set to expand at a 12.48% CAGR to 2031.
- By distribution channel, retail accounted for 43.20% share of the condensed milk market size in 2025, yet foodservice is advancing fastest at a 13.09% CAGR.
- By geography, North America led with 41.22% of the condensed milk market share in 2025, and Asia-Pacific is projected to grow at a 12.01% CAGR through 2031.
Note: Market size and forecast figures in this report are generated using Mordor Intelligence’s proprietary estimation framework, updated with the latest available data and insights as of January 2026.
Global Condensed Milk Market Trends and Insights
Drivers Impact Analysis*
| Driver | (~) % Impact on CAGR Forecast | Geographic Relevance | Impact Timeline |
|---|---|---|---|
| Surge in Bakery and Confectionery Manufacturing Capacity | +2.5% | Global, with concentration in Asia-Pacific and Latin America | Medium term (2-4 years) |
| Growing Use of Sweetened Condensed Milk in RTD Coffee Beverages | +1.8% | North America, Europe, urban Asia-Pacific markets | Short term (≤ 2 years) |
| Rise of Vegan/Plant-Based Condensed Coconut and Oat Formulations | +1.2% | North America, Europe, Australia | Medium term (2-4 years) |
| Long Shelf Life Boosts Demand | +0.9% | Global, particularly emerging markets with limited cold chain | Long term (≥ 4 years) |
| Convenience and Versatility of Usage | +0.7% | Global, with emphasis on urban markets | Short term (≤ 2 years) |
| Rising Demand for Shelf-Stable Desserts in Tourist Hubs | +0.6% | Tourism-dependent regions: Caribbean, Southeast Asia, Mediterranean | Medium term (2-4 years) |
| Source: Mordor Intelligence | |||
Surge in Bakery and Confectionery Manufacturing Capacity
Industrial bakeries and confectionery producers are expanding production to meet the growing demand for shelf-stable ingredients, driving consistent demand for condensed milk. This ingredient is widely used as a sweetener, moisture-retention agent, and flavor enhancer. In 2024, Ferrero enhanced its North American operations by acquiring WK Kellogg for USD 2.8 billion, while Mondelez invested in emerging markets to localize supply chains and reduce import tariffs. Barry Callebaut expanded cocoa-processing facilities in West Africa and Southeast Asia, reflecting a trend of vertical integration to control costs and maintain quality. Condensed milk is essential in products like filled chocolates, caramel centers, and baked goods, serving as a sugar substitute and textural modifier. Manufacturers are focusing on balancing sweetness with longer shelf life, especially in the Asia-Pacific region, where urbanization and rising incomes are boosting demand for packaged confectionery and premium bakery products. According to the most recent data available from the International Dairy Deli Bakery Association[1]Source: International Dairy Deli Bakery Association, "Dollar Sales in Bakery Products", www.iddba.org, for 2024, sales in total bakery were up 5.7% from the prior year to USD 43.5 billion. This growth generated increased demand for condensed milk as an essential ingredient in various baked goods, including cakes, pastries, and confectioneries. Its versatility in enriching dough and creating fillings and toppings solidifies its importance in bakery applications.
Growing Use of Sweetened Condensed Milk in RTD Coffee Beverages
Ready-to-drink (RTD) coffee brands are now adding sweetened condensed milk, achieving a creamy texture and natural sweetness without the need for refrigeration. This is especially advantageous in markets where cold-chain infrastructure is limited. The RTD coffee segment is witnessing rapid growth in the Asia-Pacific region. Here, countries like Vietnam, Thailand, and Indonesia, with their traditional coffee culture, prominently feature condensed milk as a staple ingredient. In a notable move, Nestlé's Carnation brand has introduced vegan condensed milk formulations, crafted from oat and rice flour. This strategy aims to attract lactose-intolerant consumers and align with the growing plant-based trend. It underscores a significant shift: even established dairy brands are diversifying their ingredient platforms. Beverage formulators are increasingly valuing condensed milk not just for its creamy texture, but also for its ability to mask the bitterness of robusta coffee blends. Moreover, its high sugar content extends shelf life, minimizing the need for preservatives. This evolving dynamic is prompting RTD coffee producers to adjust their ingredient procurement strategies. They're now pursuing long-term supply agreements with condensed milk manufacturers, ensuring locked-in pricing and consistent quality.
Rise of Vegan/Plant-Based Condensed Coconut and Oat Formulations
Plant-based condensed milk alternatives made from coconut cream, oat milk, and almonds are gaining popularity in Western Europe and North America. Supportive regulations promoting plant-based labeling and sustainability claims are driving this growth. Thailand-based Nature's Charm has expanded its coconut-based condensed milk into major retailers in these regions, appealing to vegans and lactose-intolerant consumers with clean-label and allergen-free products. In 2024, Nestlé launched Carnation vegan condensed milk, blending oat milk and rice flour to replicate the texture and sweetness of dairy, showing how traditional players are adapting to protect market share. Oat-based options are environmentally friendly, using less water and producing fewer greenhouse gases, aligning with sustainability goals and consumer demand for eco-conscious products. However, scaling production remains a challenge due to price volatility and limited processing infrastructure in oat and coconut supply chains compared to dairy networks.
Long Shelf Life Boosts Demand
Condensed milk, with its long shelf life of over 12 months without refrigeration, is widely used in areas with unreliable cold-chain infrastructure. It is also a popular choice for consumers preparing emergency food supplies. In tourism-driven regions like the Middle East and Southeast Asia, shelf-stable dairy products are essential. Hospitality operators in these areas prefer ingredients like condensed milk because they reduce the risk of spoilage and help lower inventory costs. In Egypt, the recovery of the tourism sector has increased the demand for condensed milk in the HoReCa industry. Hotels and restaurants, as they rebuild operations, are opting for condensed milk as a cost-effective alternative to fresh dairy, which requires constant refrigeration. This trend is particularly significant in regions with inconsistent electricity or remote areas lacking cold-storage facilities. The high sugar content in condensed milk acts as a natural preservative, preventing microbial growth and extending its usability. This makes it especially popular in tropical climates and as a key item in disaster-preparedness supplies.
Restraints Impact Analysis*
| Restraint | (~) % Impact on CAGR Forecast | Geographic Relevance | Impact Timeline |
|---|---|---|---|
| Volatility in Global Whole-Milk Powder Prices | -1.4% | Global, with acute impact on import-dependent regions | Short term (≤ 2 years) |
| Logistics Cold-Chain Gaps | -0.8% | Emerging markets: Sub-Saharan Africa, Southeast Asia, Latin America | Medium term (2-4 years) |
| Stringent Import Quotas on Dairy Fat | -0.6% | North America, Europe, protected domestic markets | Long term (≥ 4 years) |
| Availability of Alternatives | -0.5% | Developed markets with diverse product offerings | Medium term (2-4 years) |
| Source: Mordor Intelligence | |||
Volatility in Global Whole-Milk Powder Prices
Raw material price fluctuations create margin pressure for condensed milk manufacturers. Weather-related disruptions in major dairy-producing regions, combined with geopolitical tensions affecting trade flows, amplify price volatility and complicate long-term contract negotiations between suppliers and food manufacturers. Smaller producers face particular challenges in managing price risk, as they lack the scale to implement sophisticated hedging strategies or negotiate volume-based pricing agreements with dairy suppliers. The 7% decline in Argentine milk production forecasted for 2024 due to economic instability illustrates how regional supply shocks can cascade through global pricing mechanisms, according to the United States Department of Agriculture [2]Source: United States Department of Agriculture, "Dairy and Products Annual- Argentina (November 2024)", usda.gov. Forward contracting becomes essential for maintaining competitive positioning, though it requires working capital commitments that strain smaller operators' financial resources.
Logistics Cold-Chain Gaps: Distribution Challenges Persist
In emerging markets, the lack of proper cold-chain infrastructure limits the distribution of condensed milk. This increases the risk of spoilage and restricts access to rural areas, where demand is growing rapidly. According to the USDA, sub-Saharan Africa, South Asia, and parts of Latin America face significant challenges in temperature-controlled transport and storage. These regions struggle with unreliable electricity and the high cost of refrigeration equipment. As a result, distributors often rely on ambient-temperature products. While this benefits condensed milk over fresh dairy, it also prevents the introduction of premium refrigerated products that offer higher profit margins. FrieslandCampina's experience in Nigeria highlights this issue: despite strong demand, delivering to smaller retailers requires products that can remain stable for several days without refrigeration. Solving this problem will require investments in cold-storage hubs, solar-powered refrigeration units, and training for logistics operators. However, these solutions are expensive, and many regional distributors cannot afford them without external funding or public-private partnerships.
*Our forecasts treat driver/restraint impacts as directional, not additive. The impact forecasts reflect baseline growth, mix effects, and variable interactions.
Segment Analysis
By Packaging Type: Innovation Drives Diversification
Tubes are expected to grow at a 12.48% CAGR through 2031, driven by their convenience, reduced waste, and single-serve formats that suit on-the-go consumers and small households. Unlike traditional cans, which require full consumption or refrigeration after opening, tubes allow precise dispensing, reduce oxidation, and extend usability. This makes them ideal for retail consumers and foodservice operators seeking flexibility. Tetra Pak's retortable carton technology, combining aseptic processing with fiber-based barriers, offers a sustainable alternative to metal cans. With 70% paperboard content, these cartons align with sustainability goals and consumer demand for reduced plastic use.
In 2025, cans accounted for 56.8% of the packaging market, supported by established supply chains, consumer familiarity, and cost efficiency in bulk production. Metal cans provide excellent barriers against light, oxygen, and moisture, ensuring long-term product stability without refrigeration. They dominate in emerging markets, where durability and bulk purchasing are priorities. However, sustainability concerns challenge cans due to the high carbon footprint of aluminum and steel production and low recycling rates in many regions. Bottles, pouches, and cartons cater to niche needs for resealability and transparency but face limitations from higher costs and complex processing.


By Category: Sweetened Dominates While Unsweetened Accelerates
In 2025, sweetened condensed milk held a 70.5% category share, driven by its role in desserts, beverages, and confections. Its high sugar content enhances flavor, preserves shelf life, and delivers the creamy texture and caramelized sweetness consumers expect. This product remains a staple in traditional recipes like Vietnamese coffee, Thai tea, and Brazilian brigadeiro, especially in Asia-Pacific and Latin America. In North America, brands like Nestlé's Carnation and Eagle Foods' Borden maintain strong market positions by leveraging brand recognition and extensive distribution to compete with private-label products.
Unsweetened evaporated milk is growing at a 13.59% CAGR through 2031, supported by demand from foodservice operators and industrial users seeking lower-sugar options for sauces, soups, and coffee blends. It appeals to health-conscious consumers and institutional buyers, particularly in Western Europe and North America, where sugar-reduction trends are reshaping products. With higher protein and calcium content, it is also used in infant nutrition and pediatric formulations to meet regulatory standards. Arla’s £90 million investment in its Lockerbie UHT center highlights the category’s growth potential. Post-pandemic foodservice recovery has further boosted demand for shelf-stable dairy products, increasing the adoption of unsweetened evaporated milk in commercial kitchens.
By Product Type: Non-Dairy Alternatives Gain Momentum
Traditional dairy formulations command 86.52% market share in 2025, reflecting established manufacturing infrastructure and consumer familiarity with conventional condensed milk products. However, non-dairy alternatives accelerate at 14.01% CAGR through 2031, driven by lactose intolerance awareness and environmental sustainability concerns that reshape purchasing decisions across developed markets. Dairy segments benefit from economies of scale in procurement and processing, where established relationships with milk suppliers enable cost-effective raw material sourcing and quality consistency.
Plant-based formulations face higher production costs due to specialized processing requirements and premium ingredient sourcing, though improving manufacturing efficiency gradually narrows the cost differential. Coconut-based condensed milk leads non-dairy growth through natural fat content that closely replicates dairy texture and mouthfeel, while oat-based variants gain traction in markets emphasizing nutritional benefits and sustainable sourcing. For instance, in October 2023, The Coconut Company launched a range of coconut products, including coconut condensed milk.
By Distribution Channel: Foodservice Growth Outpaces Retail
Foodservice channels are expected to grow at a 13.09% CAGR through 2031, driven by the recovery of hotels, restaurants, and cafés post-pandemic. These establishments increasingly prefer shelf-stable dairy products that require minimal cold-chain infrastructure. Rising tourism in the Middle East and Southeast Asia further supports this trend, as operators seek cost-effective dairy alternatives to reduce spoilage and inventory costs. In Egypt, the tourism rebound has boosted demand for condensed milk, which offers flexibility and durability without refrigeration. Its versatility, from coffee creamers to dessert toppings, allows operators to simplify menus and reduce ingredient variety. Additionally, industrial buyers in bakery, confectionery, and beverage manufacturing are scaling production to meet growing demand for packaged goods, further driving foodservice growth.
Retail channels accounted for 43.2% of the distribution share in 2025, led by supermarkets, hypermarkets, and online platforms catering to convenience-focused consumers. E-commerce growth in North America and Europe has enabled home delivery and subscription models, benefiting niche brands like Nature's Charm by reducing the need for physical stores. In emerging markets, supermarkets and hypermarkets dominate due to consumer preferences for in-store product inspection and price comparison. However, convenience stores are gaining traction in urban areas for their proximity and extended hours. Specialty stores serve premium and organic segments, offering curated products that appeal to health-conscious consumers willing to pay for clean-label and sustainable options.
Geography Analysis
In 2025, North America holds a 41.22% market share, supported by its strong food processing infrastructure and focus on premium products. At the same time, the Asia-Pacific region is the fastest-growing, with a 12.01% CAGR projected through 2031, driven by urbanization and rising disposable incomes. In North America, the condensed milk market is adapting to changing consumer preferences and production trends. The United States remains the largest consumer, with the USDA estimating milk production to reach 228.2 billion pounds in 2024, a 0.7% increase due to higher per-cow output despite smaller herd sizes [3]Source: United States Department of Agriculture, "Agricultural Outlook Forum 2024- Outlook for U.S. Dairy", usda.gov. Additionally, consumer interest is shifting toward premium and specialty products, particularly in the ready-to-drink (RTD) coffee market. Condensed milk is a key ingredient in cold brew coffee and nutrient-enriched beverages, which are increasingly popular among younger consumers.
In the Asia-Pacific region, urbanization and the growing café culture are driving market growth. In Vietnam, Vinamilk and FrieslandCampina dominate domestic production, reflecting both a concentration of market share and strong brand presence. In Indonesia, the steady growth of sweetened condensed milk sales highlights its continued popularity, especially in traditional beverages, as noted by the World Bank. However, limited cold-chain infrastructure restricts market access in rural areas of Indonesia and India. Efforts to address this issue are underway, with infrastructure investments supported by multilateral funding aiming to expand market opportunities in these regions.
In Europe, the focus is on sustainability and quality certifications. According to the European Dairy Association, milk production is expected to reach 145 million tonnes in 2024. Processors are increasingly channeling this output into value-added products instead of traditional commodity butter. Northern European consumers, who are highly conscious of carbon footprints, are showing a growing preference for plant-based condensed milk. This trend is encouraging established dairy companies to acquire or collaborate with niche vegan brands. In Eastern Europe, price sensitivity continues to drive demand for sweetened canned products, which are primarily imported from Poland and the Netherlands.

Competitive Landscape
The condensed milk market is moderately fragmented, enabling established companies to dominate significant portions of the market while allowing regional players and new brands to compete effectively. Leading companies like Nestlé, FrieslandCampina, and Fonterra rely on their strong distribution networks and well-known brands to maintain their leadership.
At the same time, regional players such as Vinamilk have secured strong positions in the market. In 2023, FrieslandCampina expanded its presence in Southeast Asia by opening a new sweetened condensed milk production facility in Indonesia. The market offers growth potential, particularly in plant-based alternatives and innovative packaging solutions.
New players, including plant-based product manufacturers and technology-driven companies like Warmsener, are entering the market. Warmsener is notable for producing Fairtrade and plant-based condensed milk using advanced production techniques. Digital transformation has become crucial for success in this market. For instance, Vinamilk's focus on digital initiatives to improve operational efficiency and customer engagement contributed to a 2.2% year-on-year revenue growth, reaching VND 61,824 billion in 2024.
Condensed Milk Industry Leaders
-
Santini Foods, Inc.
-
Hochwald Foods GmbH
-
Arla Foods Amba
-
Nestlé S.A.
-
Eagle Foods
- *Disclaimer: Major Players sorted in no particular order

Recent Industry Developments
- March 2026: Milky Mist launched its Chocolate Sweetened Condensed Milk, a rich and indulgent twist on its classic product. According to the brand, it is designed for quick treats, festive bakes, and beverages. It offers a creamy, pourable texture perfect for upgrading desserts.
- April 2025: Soprole, a Chilean dairy manufacturer known for its cheese, milk, and yogurt products, has launched condensed milk to its product line. This addition expands Soprole's portfolio to address the increasing market demand for dairy products.
- March 2025: Nestlé Indonesia launched its Carnation condensed milk in sachet packaging. According to the brand, the new Carnation condensed milk sachets offer a practical and cost-effective solution for consumers, eliminating the need for a full can and encouraging experimentation in food and beverage preparation.
- January 2025: Galloway Company, a Wisconsin-based dairy ingredients manufacturer, completed a facility expansion at its Neenah operations. The implementation of a custom-built evaporator increased the plant's sweetened condensed milk production capacity by 100%.


Research Methodology Framework and Report Scope
Market Definitions and Key Coverage
Our study defines the condensed milk market as all retail, food-service, and industrial sales of dairy and plant-based milk that is concentrated by removing at least sixty percent of water, with or without added sugar, and then commercially packaged for human consumption.
Scope Exclusion: Powdered milk, fresh UHT milk, and infant formula concentrates remain outside this analysis.
Segmentation Overview
-
By Product Type
- Dairy
- Non-Dairy/Plant-Based
-
By Category
- Sweetened Condensed Milk
- Unsweetened Evaporated Milk
-
By Packaging Type
- Cans
- Tubes
- Bottles and Pouches
- Cartons (Tetra Pak and Others)
- Others
-
By Distribution Channel
-
Retail
- Supermarkets/Hypermarkets
- Convenience Stores
- Specialty Stores
- Online Retail
- Foodservice
-
Industrial
- Bakery and Confectionery
- Beverages and Dairy-Based Drinks
- Infant and Pediatric Nutrition
- Others
-
Retail
-
By Geography
-
North America
- United States
- Canada
- Mexico
- Rest of North America
-
Europe
- Germany
- United Kingdom
- Italy
- France
- Spain
- Netherlands
- Poland
- Belgium
- Sweden
- Rest of Europe
-
Asia-Pacific
- China
- India
- Japan
- Australia
- Indonesia
- South Korea
- Thailand
- Singapore
- Rest of Asia-Pacific
-
South America
- Brazil
- Argentina
- Colombia
- Chile
- Peru
- Rest of South America
-
Middle East and Africa
- South Africa
- Saudi Arabia
- United Arab Emirates
- Nigeria
- Egypt
- Morocco
- Turkey
- Rest of Middle East and Africa
-
North America
Detailed Research Methodology and Data Validation
Primary Research
Mordor analysts interviewed dairy cooperatives in the Americas, bakery chains in Europe, ingredient distributors in ASEAN, and packaging suppliers worldwide. These conversations validated yield assumptions, regional penetration rates for sweetened versus unsweetened variants, and the pace at which squeezable tubes are replacing cans.
Desk Research
We began by mapping supply through publicly available datasets such as FAOSTAT farm-gate milk output, UN Comtrade HS-0402 trade flows, and Eurostat dairy manufacturing indices, which together signal how much raw liquid can realistically be converted into condensed formats. Industry guidelines from the International Dairy Federation and retail scanner data summarized by USDA Economic Research Service helped us understand pack sizes, shelf-life driven demand spikes, and price dispersion across regions.
Company 10-Ks, investor decks, and press releases were then screened in Dow Jones Factiva; these filings clarified capacity additions and sugar price passthroughs that move average selling prices. D&B Hoovers supplied revenue splits for key processors, allowing us to verify whether reported condensed milk lines align with customs volumes. The sources listed illustrate our approach and are not exhaustive.
Market-Sizing & Forecasting
A top-down reconstruction converts national milk output and net trade into a 'condensable pool,' adjusts for typical 8.5:1 concentration yields, and applies sugar-addition ratios; results are corroborated through a bottom-up check of sampled processor revenues and retail unit sales. Variables fed into our multivariate regression forecast include per-capita dessert spending, arabica coffee consumption (a key pairing), refined-sugar prices, aluminum can costs, regulatory sugar-tax timelines, and urban population growth. Where processor disclosures are absent, regional averages from similar plants bridge the gap.
Data Validation & Update Cycle
Outputs pass a three-layer review: automated variance checks against historical series, peer analyst scrutiny, and a senior sign-off. We refresh every twelve months and trigger interim updates for material events such as dairy trade bans or large plant shutdowns, ensuring clients always receive the latest view.
Why Mordor's Condensed Milk Baseline Commands Reliability
Published figures often diverge because firms pick different product mixes, currency years, and refresh cadences, making one-to-one comparisons tricky.
Key gaps arise when some publishers size only sweetened formats, model single-channel retail scans, or roll forward outdated yields without revalidating sugar content standards. Our study, by contrast, blends milk supply physics with channel checks and updates annually, giving decision-makers a balanced midpoint.
Benchmark comparison
| Market Size | Anonymized source | Primary gap driver |
|---|---|---|
| USD 11.21 B (2025) | Mordor Intelligence | - |
| USD 9.01 B (2024) | Regional Consultancy A | Focuses on sweetened only and excludes plant-based lines |
| USD 8.50 B (2024) | Industry Journal B | Uses static 6.5 % CAGR without revisiting yield or sugar-tax impacts |
The comparison shows that when scope breadth, yield logic, and annual refresh are standardized, our 2025 baseline sits comfortably between narrow retail snapshots and broad dairy overviews, giving stakeholders a dependable launching pad for strategy and budgeting.


Key Questions Answered in the Report
What is the current size of the condensed milk market?
The condensed milk market size is USD 11.21 billion in 2026 and is projected to reach USD 20.01 billion by 2031, growing at a 12.29% CAGR.
Which region holds the largest share of the condensed milk market?
North America leads with 41.22% market share in 2025, supported by advanced processing infrastructure and premium positioning.
Which product type is growing fastest within the condensed milk market?
Plant-based condensed milk, particularly coconut and oat formulations, is set to expand at 14.01% CAGR through 2031, outpacing dairy products.
Which companies are leading strategic investment in condensed milk production?
Which companies are leading strategic investments in condensed milk production?
Page last updated on:


