Computed Tomography (CT) Testing Market Size and Share
Market Overview
| Study Period | 2019 - 2030 |
|---|---|
| Market Size (2025) | USD 541.30 Million |
| Market Size (2030) | USD 651.20 Million |
| Growth Rate (2025 - 2030) | 3.77% CAGR |
| Fastest Growing Market | Asia Pacific |
| Largest Market | Asia Pacific |
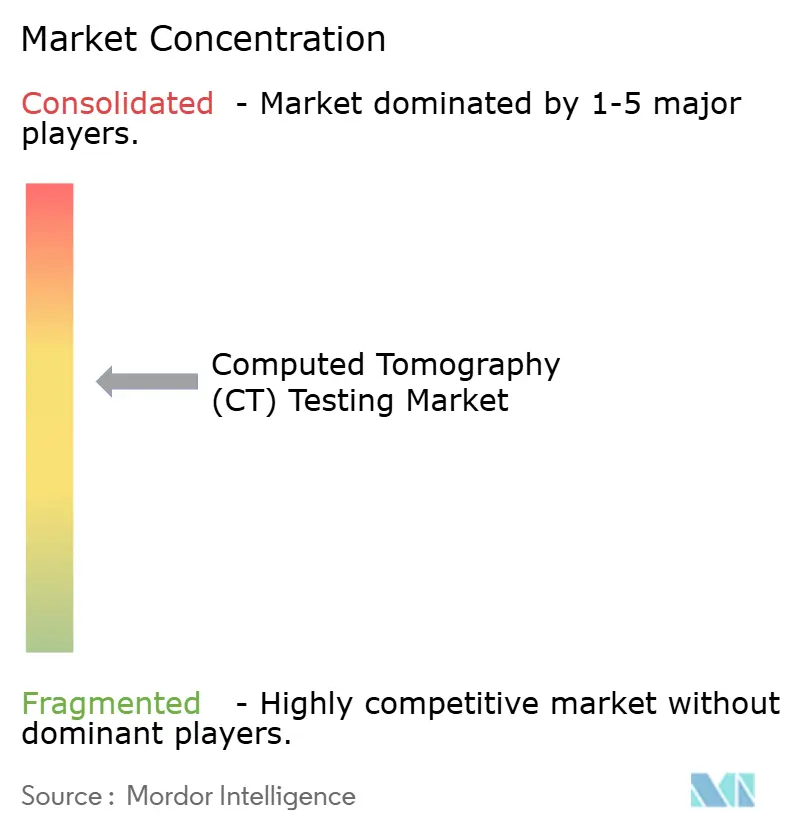
| Market Concentration | Medium |
Major Players *Disclaimer: Major Players sorted in no particular order Image © Mordor Intelligence. Reuse requires attribution under CC BY 4.0. | |

Computed Tomography (CT) Testing Market Analysis by Mordor Intelligence
The computed tomography CT testing market size stood at USD 541.3 million in 2025 and is projected to reach USD 651.2 million by 2030, registering a 3.77% CAGR over the forecast period. The continued migration of industrial CT from laboratory settings to automated production lines is expanding use cases beyond failure analysis and driving steady equipment upgrades across various manufacturing sectors. Stricter global quality regulations are amplifying growth, increasing the need for micron-level inspection of advanced electronics, and driving automotive electrification programs that demand 100% battery-pack validation. Meanwhile, falling scan times and smarter reconstruction algorithms have lowered the cost per inspection, helping the computed tomography CT testing market gain traction among medium-sized enterprises. Heightened competition, however, is expected to keep pricing pressure on stand-alone systems.
Key Report Takeaways
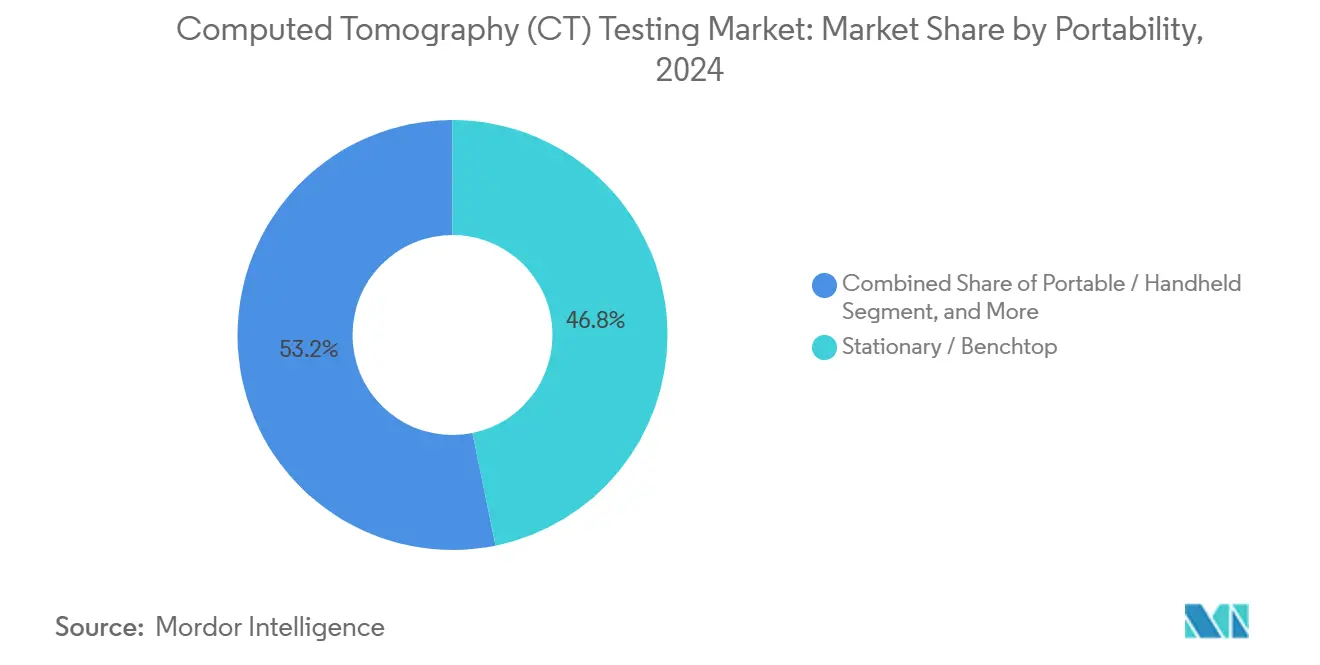
- By portability, stationary and benchtop systems led with 46.8% of the computed tomography CT testing market share in 2024, whereas automated and robotic platforms are set to expand at an 8.7% CAGR through 2030.
- By application, internal defect detection accounted for a 31.2% share of the computed tomography CT testing market size in 2024, while assembly verification is forecast to grow at an 8.2% CAGR to 2030.
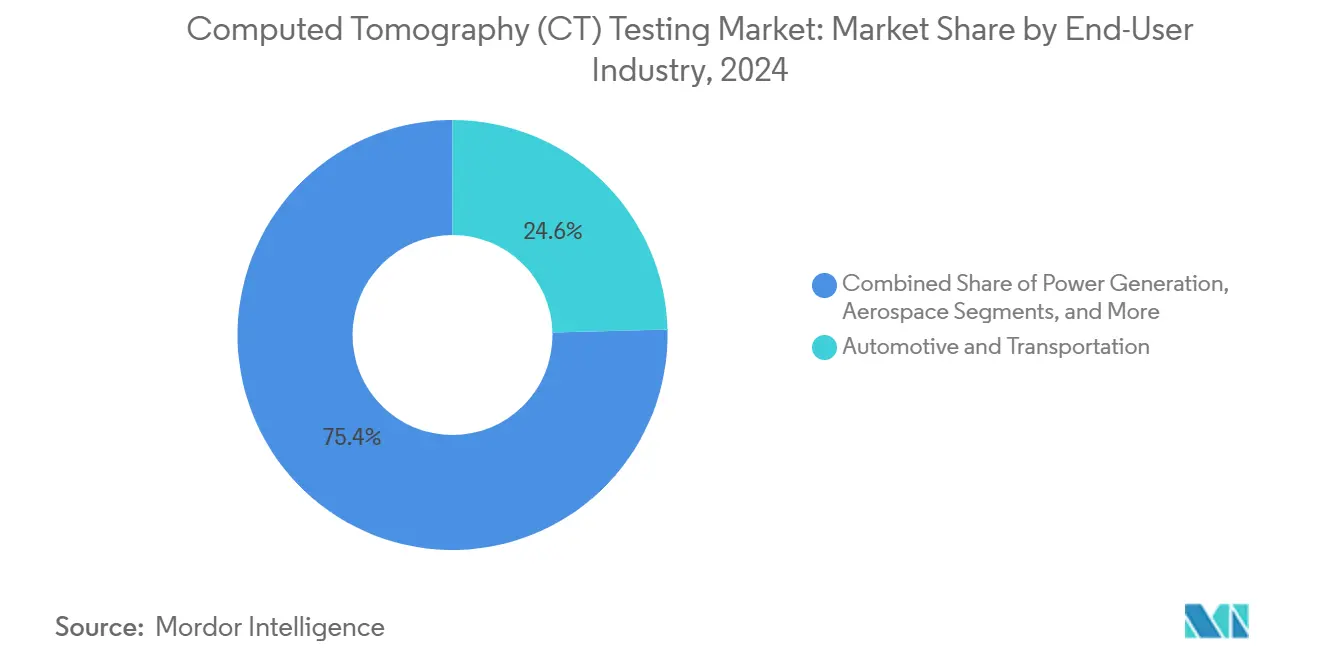
- By end-user industry, automotive and transportation captured 24.6% of the computed tomography CT testing market share in 2024; electronics and semiconductor applications are advancing at a 7.1% CAGR to 2030.
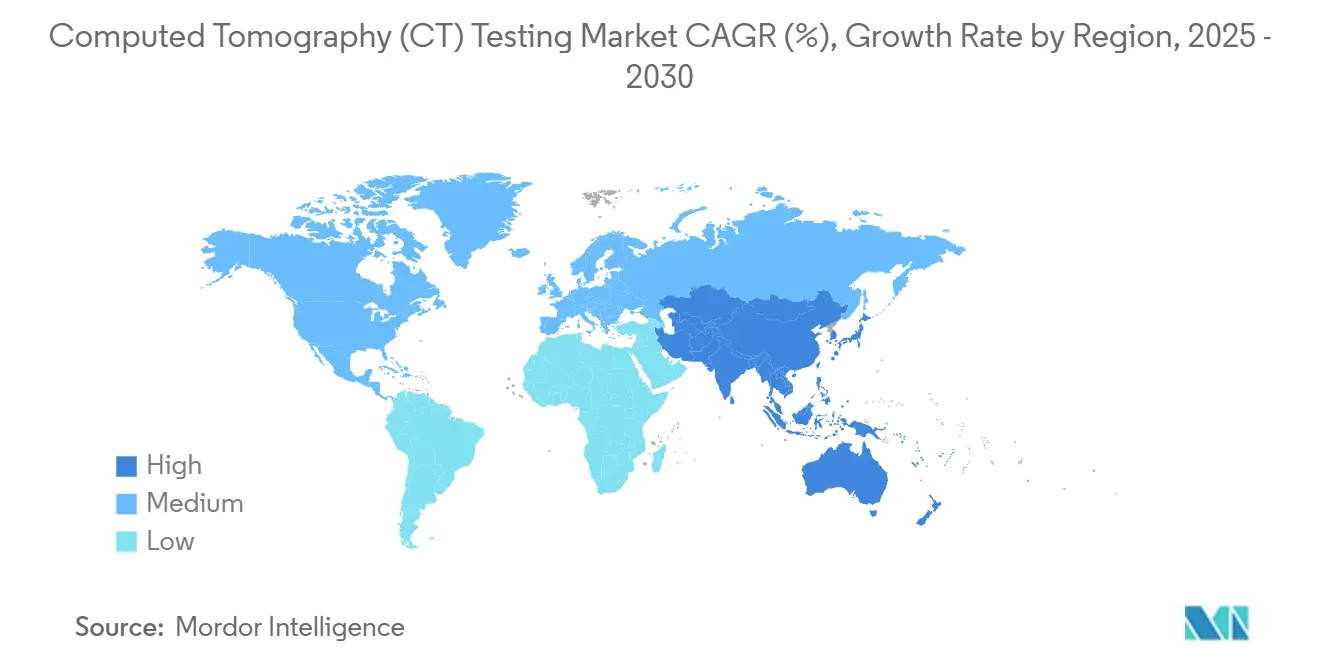
- By geography, the Asia-Pacific commanded 35.5% of the computed tomography CT testing market share in 2024 and remains the fastest-growing region with a 5.4% CAGR through 2030.
Global Computed Tomography (CT) Testing Market Trends and Insights
Drivers Impact Analysis*
| Driver | (~) % Impact on CAGR Forecast | Geographic Relevance | Impact Timeline |
|---|---|---|---|
| Rapid adoption of advanced composite materials | +0.8% | North America and Europe, expanding to the Asia-Pacific | Medium term (2-4 years) |
| Shift to Industry 4.0 inline inspection | +1.2% | Global, early uptake in Germany, Japan, South Korea | Short term (≤ 2 years) |
| Miniaturization in electronics | +0.9% | Asia-Pacific core, spillover to North America | Medium term (2-4 years) |
| Growing regulatory mandate for pipeline tests | +0.5% | North America and the Middle East, expanding globally | Long term (≥ 4 years) |
| Expanding electric vehicle battery gigafactories | +0.7% | China, Europe, North America | Medium term (2-4 years) |
| Emerging reimbursement codes for medical devices | +0.3% | North America and Europe | Long term (≥ 4 years) |
| Source: Mordor Intelligence | |||
Rapid Adoption of Advanced Composite Materials in Aerospace Manufacturing
Aerospace OEMs are incrementally substituting metal parts with carbon-fiber and ceramic-matrix composites, which introduce internal failure modes that are invisible to surface NDT. Boeing’s 787 program, in which composites account for 50% of structural weight, relies on volumetric CT to identify delaminations and fiber misalignment before final assembly. The U.S. Federal Aviation Administration’s Advisory Circular AC 20-107B tightened composite inspection protocols, compelling tier-one suppliers to install higher-energy CT scanners capable of penetrating thick wing spars.[1]Federal Aviation Administration, “Advisory Circular AC 20-107B: Composite Aircraft Structure,” faa.govOEM feedback indicates CT reduces scrap rates on large composite panels by 30%, offsetting lengthy scan times. As composite usage rises in single-aisle jets and urban air mobility platforms, the computed tomography CT testing market is expected to see sustained aerospace demand.
Shift to Industry 4.0 Inline Inspection on Production Floors
Global manufacturers are embedding CT scanners directly into automated cells to shorten feedback loops between production and quality control. Siemens documented a 40% reduction in cycle time when inline CT replaced offline sampling in turbine blade factories. German automotive plants now deploy robotic CT cells that complete a 360-degree scan and AI-based defect classification in under 10 minutes, keeping dimensional accuracy within 0.1% tolerance. ISO 15708 provides the metrology framework that enables these results to be directly integrated into statistical process control systems. Capital costs remain high, yet ROI is accelerated by fewer reworks and faster root-cause analysis, supporting deeper penetration of the computed tomography CT testing market across smart-factory programs.
Miniaturization Trend in Electronics Requiring High-Resolution Non-destructive Testing
Advanced packaging, encompassing 3D ICs, fan-out wafer-level modules, and system-in-package designs, features solder joints below 10 µm, which are beyond the reach of conventional X-ray inspection. IEEE 1149.10 now references CT for non-destructive inspection of micro-bump integrity, enabling the detection of failures without the need for destructive decapping.[2]Institute of Electrical and Electronics Engineers, “IEEE 1149.10-2024 Standard for High-Speed Test Access Port,” ieee.org Apple, Samsung, and TSMC have each reported defect escapes cut by more than 300% after shifting from 2D X-ray to sub-micron CT lines, even at the cost of higher per-unit inspection fees. As mobile and AI chips move to stacked die, high-magnification CT will remain indispensable, bolstering the computed tomography CT testing market size in semiconductor hubs across South Korea, Taiwan, and Mainland China.
Expanding Electric Vehicle Battery Gigafactories Demanding Volumetric Defect Analysis
Battery cell quality directly affects vehicle safety and warranty claims, driving automakers toward 100% CT inspection for electrodes, tabs, and cooling channels. Tesla’s U.S. Gigafactory integrates a robotic CT scanner that can process 1,000 battery packs daily, while maintaining 99.5% detection accuracy for separator tears and gas pockets. European and Chinese plants are following suit as they scale lithium-iron-phosphate and solid-state chemistries, which require even finer porosity control. Suppliers report that automated CT brings down battery scrap costs by USD 40 per pack, reinforcing its adoption curve and expanding the computed tomography CT testing market share in e-mobility supply chains
Restraints Impact Analysis*
| Restraint | (~) % Impact on CAGR Forecast | Geographic Relevance | Impact Timeline |
|---|---|---|---|
| High capital expenditure vs alternatives | -1.1% | Global, weightier for SMEs | Short term (≤ 2 years) |
| Limited availability of qualified radiographers | -0.6% | Southeast Asia, Africa, Latin America | Medium term (2-4 years) |
| Rising cybersecurity risks | -0.4% | Critical infrastructure sectors worldwide | Medium term (2-4 years) |
| Radiation safety compliance burden | -0.3% | Varies by national regulation | Long term (≥ 4 years) |
| Source: Mordor Intelligence | |||
High Capital Expenditure Versus Alternative NDT Modalities
Entry-level lab CT systems cost upwards of USD 300,000, while automated cells exceed USD 2 million after accounting for shielding and integration costs. By contrast, ultrasonic and magnetic particle testers rarely surpass USD 50,000, making CT appear unaffordable for small-batch fabricators. The total cost of ownership further increases when factoring in software licenses, annual maintenance, and site licensing. Payback periods, therefore, stretch past three years in low-margin industries, throttling near-term deployment and limiting the computed tomography CT testing market penetration among small and medium enterprises despite superior analytics.
Limited Availability of Qualified Radiographers in Developing Regions
Industrial CT operation requires ASNT-certified Level II or Level III radiographers, yet accredited training capacity in emerging economies lags far behind demand. Vacancy rates for certified personnel exceed 40% in Southeast Asia and 60% in sub-Saharan Africa, prompting companies to import expatriate specialists at daily rates topping USD 800.[3]American Society for Nondestructive Testing, “SNT-TC-1A: Personnel Qualification and Certification,” asnt.org High training costs, limited mentorship opportunities, and emigration of skilled workers compound the shortage, slowing project commissioning and dampening the computed tomography CT testing market growth in developing regions where infrastructure and mining projects would otherwise benefit from volumetric inspection.
*Our forecasts treat driver/restraint impacts as directional, not additive. The impact forecasts reflect baseline growth, mix effects, and variable interactions.
Segment Analysis
By Portability: Automated Platforms Accelerate Adoption
The automated and robotic segment is forecast to log an 8.7% CAGR, the fastest within portability, as manufacturers target lights-out inspection that merges seamlessly with conveyor handling and vision robots. Stationary and benchtop units still held 46.8% computed tomography CT testing market share in 2024, thanks to superior image fidelity and entrenched lab workflows. Automated cells at Tesla and Nikon now complete a 500-module battery scan in minutes, showcasing the computed tomography CT testing market size advantage that AI-driven automation brings to high-volume plants.
Software-defined workflows and predictive maintenance dashboards further boost uptime, shrinking the cost gap with rival NDT tools. Portable and handheld scanners, while trailing in resolution, are filling niche needs in pipeline weld audits and aerospace line maintenance, where moving large parts is impractical. Although limited detector size constrains image pixel density, the portability subsegment still contributes meaningful revenue in oil and gas projects that rank mobility over nano-scale accuracy.


By Application: Assembly Verification Outpaces Legacy Defect Detection
Assembly verification is projected to expand at an 8.2% CAGR as complex multi-component products require volumetric confirmation long before field deployment. Internal defect detection retained a 31.2% share of the computed tomography CT testing market size in 2024, illustrating CT’s historical strength in revealing cracks and voids inaccessible to surface probes. Apple’s micro-bump placement requires a 2 µm tolerance check, and Boeing validates adhesive spread in composite ribs, confirming CT’s unmatched spatial resolution.
Dimensional measurement and failure analysis remain staples, but heightened recall liabilities are prompting OEMs to adopt inline verification, which caps rework costs. Reverse engineering and R&D use cases generate incremental demand, particularly in the pharmaceutical industry, where CT enables the evaluation of tablet coating uniformity without the need for chemical dissolution. By encompassing both metrology and integrity analysis, the computed tomography CT testing market is broadening its application envelope beyond traditional aerospace and casting sectors.
By End-User Industry: Electronics Takes the Growth Crown
Electronics and semiconductor lines are expected to post a 7.1% CAGR through 2030, driven by 3D IC architectures and finer solder pitches. Automotive and transportation still commanded 24.6 of % computed tomography CT testing market share in 2024, anchored by battery pack inspection and lightweight composite validation. Aerospace users rely on high-energy CT to inspect thick CFRP wing spars, and oil and gas operators utilize it to verify the integrity of pipeline girth welds in accordance with API 1163.
Construction and infrastructure players are trialing CT for concrete void mapping, while medical device firms employ micro-CT for implant verification in accordance with FDA-recognized standards. Across verticals, CT adoption tends to mirror complexity: the more intricate the geometry and the higher the liability, the stronger the pull on the computed tomography CT testing market size.
Geography Analysis
Asia-Pacific controlled 35.5% of the global computed tomography CT testing market share in 2024 and is poised to sustain a 5.4% CAGR to 2030. The region’s semiconductor capacity expansions, exceeding USD 50 billion in 2024, demand sub-micron inspection to raise yields on advanced nodes. Meanwhile, Chinese EV battery plants and South Korean memory fabs are installing inline CT banks to secure process control.
Asia-Pacific’s computed tomography CT testing market dominance stems from a deep electronics manufacturing base, continuous EV battery investments, and government incentives that subsidize NDT modernization. China’s 2024 policy blueprint earmarked tax credits for CT equipment, accelerating procurement among tier-one suppliers.[4]China National Development and Reform Commission, “National Strategy for Advanced Manufacturing Technology,” ndrc.gov.cn South Korea’s SK Hynix ramped high-magnification CT to stabilize 3D NAND yields, and Taiwan Semiconductor Manufacturing Company adopted AI-enhanced recon algorithms to optimize die stacking.
North America benefits from stringent safety oversight. FAA AC 20-107B compels high-resolution scans of composite fuselage sections, while PHMSA’s 49 CFR 195 mandates volumetric crack detection on hazardous liquid lines, pushing pipeline operators toward field-deployable CT. Medical device OEMs also rely on CT for dimensional validation as FDA guidance increasingly cites ISO 10993-1 for biocompatibility assessments that lean on 3D imaging.
Europe focuses on intelligent automation aligned with its sustainability targets. German automotive groups integrate CT with MES software for immediate scrap classification, and Airbus applies dual-energy CT to differentiate fiber orientations in composite wing skins. The region also utilizes CT for end-of-life recycling, analyzing the material composition of lithium-ion batteries before they are shredded. Although smaller in volume, the Middle East and Africa’s oil and gas projects are seeking portable CT scanners to inspect welding in hot desert environments, underscoring the technology’s versatility. South America’s mining houses adopt CT to grade ore bodies and reduce waste rock extraction.

Competitive Landscape
The computed tomography CT testing market is moderately fragmented. Nikon Corporation, ZEISS International, and GE HealthCare Technologies anchor the upper tier with broad portfolios, sizable field teams, and R&D budgets exceeding USD 100 million each. Mid-tier vendors such as Lumafield and RX Solutions carve out niches in cloud-based reconstruction and nano-focus scanners. Baker Hughes’ Waygate division leads in the launch of ruggedized pipeline units in 2025, while Shimadzu targets semiconductor lines with high-throughput lab models.
Competitive advantage is migrating from pure hardware resolution to integrated ecosystems of AI-powered analytics, robotics, and data management. ZEISS’s USD 75 million AI program aims for sub-5-minute battery module inspections, illustrating the pivot toward software differentiation. Nikon’s acquisition of Avizo adds visualization algorithms prized by aerospace OEMs for porosity mapping. Start-ups are experimenting with CT-as-a-service, which allows customers to upload slices for cloud analysis, an option attractive to SMEs that are reluctant to fund capital purchases.
Patent filings cluster around spectral imaging, iterative reconstruction, and automated handling. Active participation in ISO committees allows incumbents to shape future certification pathways, creating soft entry barriers. Pricing remains under pressure as Chinese entrants release lower-cost systems, prompting global leaders to bundle service contracts and predictive maintenance to preserve margins across the computed tomography CT testing market.
Computed Tomography (CT) Testing Industry Leaders
Nikon Corporation
ZEISS International
GE HealthCare Technologies Inc.
Baker Hughes Company (Waygate Technologies)
YXLON International GmbH
- *Disclaimer: Major Players sorted in no particular order

Recent Industry Developments
- September 2025: ZEISS International announced a USD 75 million investment in AI-driven defect classification for automotive battery modules, targeting sub-5-minute inspection cycles.
- August 2025: Nikon Corporation acquired Avizo for USD 120 million, enhancing visualization and automated measurement software for aerospace and electronics customers.
- July 2025: Baker Hughes Company introduced the Waygate CT-5000 portable field unit for pipeline girth-weld assessment aligned with API 1163 requirements.
- June 2025: GE HealthCare Technologies partnered with Tesla to install robotic CT lines processing 1,000 battery packs per day at U.S. Gigafactories.


Global Computed Tomography (CT) Testing Market Report Scope
| Portable / Handheld |
| Stationary / Benchtop |
| Automated / Robotic |
| Dimensional Measurement |
| Internal Defect Detection |
| Failure Analysis |
| Reverse Engineering |
| Assembly Verification |
| Research and Development |
| Oil and Gas |
| Power Generation |
| Aerospace |
| Defense |
| Automotive and Transportation |
| Manufacturing and Heavy Engineering |
| Construction and Infrastructure |
| Chemical and Petrochemical |
| Marine and Ship Building |
| Electronics and Semiconductor |
| Mining |
| Medical Devices |
| Others |
| North America | United States | |
| Canada | ||
| Mexico | ||
| South America | Brazil | |
| Argentina | ||
| Rest of South America | ||
| Europe | Germany | |
| United Kingdom | ||
| France | ||
| Italy | ||
| Spain | ||
| Rest of Europe | ||
| Asia-Pacific | China | |
| Japan | ||
| India | ||
| South Korea | ||
| South-East Asia | ||
| Rest of Asia-Pacific | ||
| Middle East and Africa | Middle East | Saudi Arabia |
| United Arab Emirates | ||
| Turkey | ||
| Rest of Middle East | ||
| Africa | South Africa | |
| Nigeria | ||
| Rest of Africa | ||
| By Portability | Portable / Handheld | ||
| Stationary / Benchtop | |||
| Automated / Robotic | |||
| By Application | Dimensional Measurement | ||
| Internal Defect Detection | |||
| Failure Analysis | |||
| Reverse Engineering | |||
| Assembly Verification | |||
| Research and Development | |||
| By End-user Industry | Oil and Gas | ||
| Power Generation | |||
| Aerospace | |||
| Defense | |||
| Automotive and Transportation | |||
| Manufacturing and Heavy Engineering | |||
| Construction and Infrastructure | |||
| Chemical and Petrochemical | |||
| Marine and Ship Building | |||
| Electronics and Semiconductor | |||
| Mining | |||
| Medical Devices | |||
| Others | |||
| By Geography | North America | United States | |
| Canada | |||
| Mexico | |||
| South America | Brazil | ||
| Argentina | |||
| Rest of South America | |||
| Europe | Germany | ||
| United Kingdom | |||
| France | |||
| Italy | |||
| Spain | |||
| Rest of Europe | |||
| Asia-Pacific | China | ||
| Japan | |||
| India | |||
| South Korea | |||
| South-East Asia | |||
| Rest of Asia-Pacific | |||
| Middle East and Africa | Middle East | Saudi Arabia | |
| United Arab Emirates | |||
| Turkey | |||
| Rest of Middle East | |||
| Africa | South Africa | ||
| Nigeria | |||
| Rest of Africa | |||


Key Questions Answered in the Report
What is the projected value of the computed tomography CT testing market by 2030?
It is forecast to reach USD 651.2 million by 2030.
Which region currently leads the adoption of industrial CT systems?
The Asia-Pacific region holds a 35.5% market share and is the fastest-growing region globally.
Which portability segment is growing the quickest?
Automated and robotic systems are projected to expand at an 8.7% CAGR through 2030.
Why are electronics manufacturers investing more in CT?
Miniaturized 3D packaging requires sub-micron inspection, which can only be delivered by CT.
What is the main barrier for small firms considering CT?
High upfront equipment costs and long payback periods compared to alternative NDT methods.
Which industry will post the highest CAGR among end-users?
Electronics and semiconductor production are expected to grow at a rate of 7.1% through 2030.
Page last updated on:


