
Companion Animal Diagnostic Market Size and Share
Market Overview
| Study Period | 2020 - 2031 |
|---|---|
| Market Size (2026) | USD 3.77 Billion |
| Market Size (2031) | USD 6.10 Billion |
| Growth Rate (2026 - 2031) | 10.20 % |
| Fastest Growing Market | Asia-Pacific |
| Largest Market | North America |
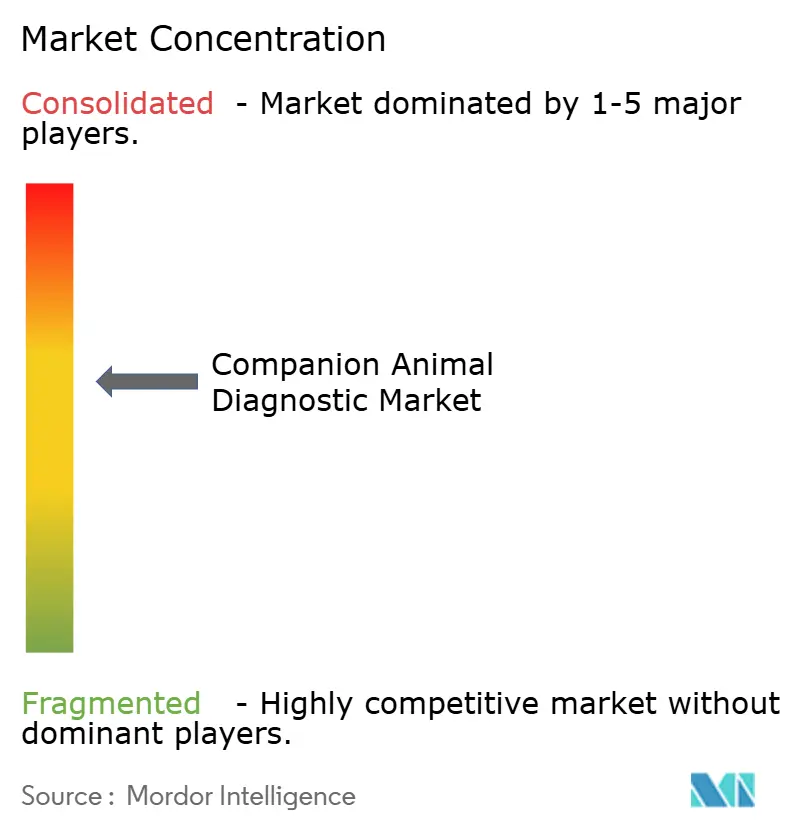
| Market Concentration | Medium |
Major Players *Disclaimer: Major Players sorted in no particular order Image © Mordor Intelligence. Reuse requires attribution under CC BY 4.0. | |
Companion Animal Diagnostic Market Analysis by Mordor Intelligence
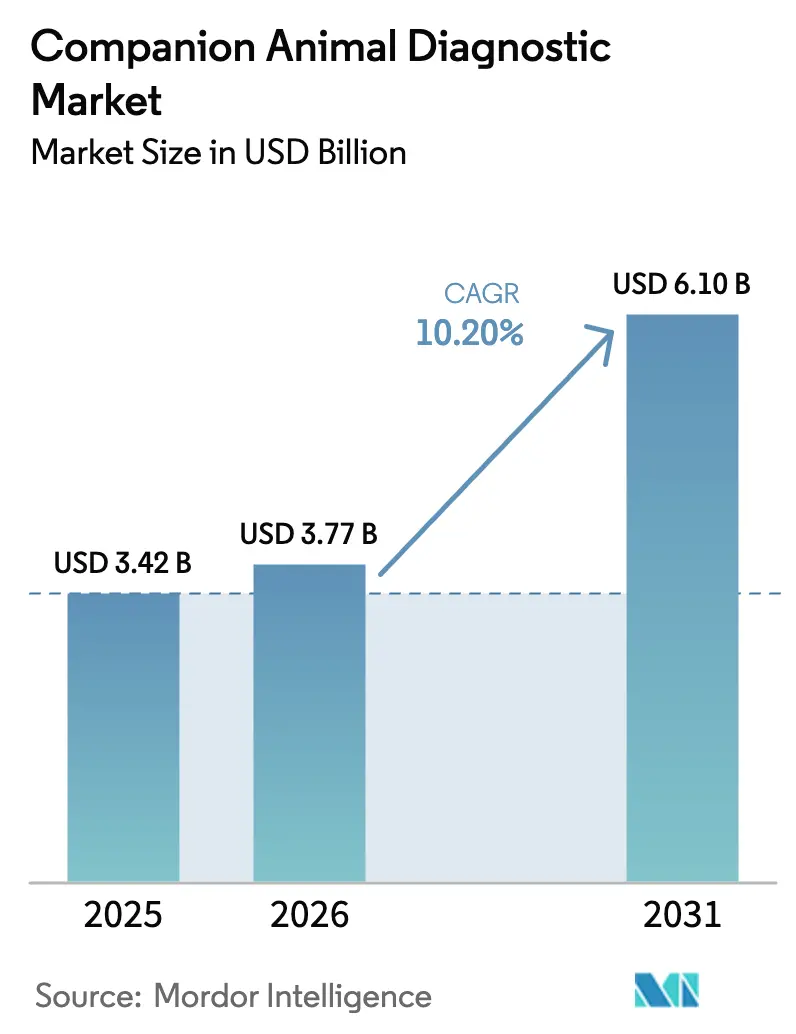
The companion animal diagnostic market size is projected to expand from USD 3.42 billion in 2025 and USD 3.77 billion in 2026 to USD 6.10 billion by 2031, registering a CAGR of 10.20% between 2026 to 2031. Substantial pet insurance uptake in North America, mandatory pathogen identification rules in the European Union, and rapid urban pet ownership in the Asia-Pacific region jointly underpin this expansion. Clinics are upgrading to AI-enabled point-of-care analyzers that shave diagnostic turnaround from two days to under fifteen minutes, strengthening in-house revenue streams. Regulatory mandates such as EU Regulation 2024/1973 have converted bacteriology from elective to compulsory testing, guaranteeing sustained volume growth and accelerating the shift from conventional culture to multiplex molecular panels. Meanwhile, the delayed but steep adoption curve in China, Japan, and India signals fresh white-space for suppliers that can balance advanced capability with lower selling prices. Competitive dynamics favor three vertically integrated leaders that already control instrument placements and reagent ecosystems, yet emerging microfluidic biosensors suggest disruptive potential over the next three years.
Key Report Takeaways
- By animal, dogs led with 41.5% of the companion animal diagnostic market share in 2025, while other companion animals are forecast to expand at an 11.23% CAGR to 2031.
- By application, clinical pathology held 33.4% revenue share in 2025, while parasitology is advancing at an 11.78% CAGR through 2031.
- By technology, immunodiagnostic tests accounted for 42.6% of spending in 2025; molecular diagnostics are projected to rise at an 11.98% CAGR to 2031.
- By end user, diagnostic laboratories commanded 46.5% revenue share in 2025; point-of-care and research settings are growing at a 12.21% CAGR through 2031.
- By Geography, North America held 47.1% revenue share in 2025, and Asia-Pacific is expected to register a CAGR of 11.41% through 2031.
Note: Market size and forecast figures in this report are generated using Mordor Intelligence’s proprietary estimation framework, updated with the latest available data and insights as of January 2026.
Market Trends and Insights
Drivers Impact Analysis of Companion Animal Diagnostic Market*
| Driver | (~) % Impact on CAGR Forecast | Geographic Relevance | Impact Timeline |
|---|---|---|---|
| Rising demand for pet insurance | +1.8% | North America and EU core markets, with Australia penetration doubling from 10% (2020) to 21% (2024) | Medium term (2-4 years) |
| Growth in companion animal population | +2.1% | Global, with highest gains in Asia-Pacific urban centers (China 120M+ pets, Japan 18.4M pets, India 30M dogs) | Long term (≥ 4 years) |
| Increasing number of veterinary practitioners in developed economies | +1.2% | North America (127,536 US vets, 4.6% growth), Western Europe (33,000+ UK vets), Australia | Medium term (2-4 years) |
| AI-enabled point-of-care analytics lowering diagnostic turnaround | +2.3% | North America and EU lead adoption, spill-over to APAC metropolitan areas (Tokyo, Shanghai, Seoul) | Short term (≤ 2 years) |
| Growing adoption of multiplex panels for exotic pets | +0.9% | Global, concentrated in North America and EU specialty clinics with board-certified avian/exotic practitioners | Medium term (2-4 years) |
| Tele-veterinary platforms integrating at-home sample collection | +1.5% | North America pioneering (Labrador, FetchDx), expanding to EU and urban APAC markets | Short term (≤ 2 years) |
| Source: Mordor Intelligence | |||
Rising Demand for Pet Insurance
North America closed 2023 with 5.36 million insured pets, a 6.8% year-on-year rise that still covered just 5.7% of the eligible population [1]. Each percentage-point gain unlocks roughly USD 150 million in incremental test spending because insured owners are more than three times as likely to authorize advanced imaging and molecular panels. Mature European markets continue to expand more slowly, yet Australia doubled penetration to 21% by 2024, illustrating room for late-stage acceleration. Insurers increasingly bundle annual blood and urine panels into wellness policies, smoothing demand across economic cycles. Manufacturers that secure formulary inclusion can ride these prepaid volumes and protect pricing integrity.
Growth in Companion Animal Population
Urban Asia-Pacific now drives household pet acquisition: Japan’s dog-and-cat population reached 18.4 million in 2024, while China surpassed 120 million across tier-1 and tier-2 cities. Demography alone, however, does not ensure revenue; India’s ratio of one veterinarian for every 10,000 pets suppresses clinical test uptake despite a 30 million-dog population. The inflection occurs once middle-class households consistently allocate USD 300–500 per year to preventive care, a threshold now visible in Beijing, Shanghai, and Bengaluru. Global suppliers that pair lower-cost panels with remote-reading apps are best positioned to convert latent demand into billable volume.
Increasing Number of Veterinary Practitioners in Developed Economies
The United States workforce expanded to 127,536 veterinarians in 2024, enabling longer consultation windows and routine annual diagnostics [2]. The United Kingdom logged 33,000 registered veterinarians the same year, while Germany, France, and Spain added 2,800 practitioners. Each additional clinician boosts laboratory utilization by USD 18,000 annually via wellness blood chemistry and fecal antigen screening. Geographic imbalances persist, so mobile diagnostic trucks and telemedicine platforms are emerging to serve rural undersupply, creating secondary equipment markets for compact analyzers.
AI-Enabled Point-of-Care Analytics Lowering Diagnostic Turnaround
Zoetis Vetscan Imagyst now interprets fecal floats, blood smears, urine sediment, and dermatology slides in under five minutes, with anomaly detection rates up to 15% over manual review. IDEXX Vetscan OptiCell automates hematology differentiation at USD 35,000 per unit, a price feasible for mid-size clinics. AI cuts turnaround from 24–48 hours to chair-side decisions, prompting broad in-clinic adoption. Reference laboratories respond by expanding esoteric menus such as next-generation sequencing panels that remain impractical on benchtop platforms.
Restraints Impact Analysis of Companion Animal Diagnostic Market*
| Restraint | (~) % Impact on CAGR Forecast | Geographic Relevance | Impact Timeline |
|---|---|---|---|
| Escalating overall pet-care costs | -1.4% | Global, most acute in North America and EU where veterinary labor inflation exceeds 7% annually | Short term (≤ 2 years) |
| Limited reimbursement outside North America & Europe | -1.1% | Latin America, MEA, Southeast Asia, with penetration below 2% in Brazil, Argentina, Thailand, Vietnam | Long term (≥ 4 years) |
| Shortage of cold-chain logistics for advanced reagents in emerging markets | -0.7% | APAC emerging economies (India, Indonesia, Philippines), MEA, Latin America tropical regions | Medium term (2-4 years) |
| Rising antimicrobial-resistance regulations slowing bacteriology test approvals | -0.6% | EU core (Germany, France, Netherlands) under Regulation 2024/1973, expanding to North America and APAC | Medium term (2-4 years) |
| Source: Mordor Intelligence | |||
Limited Reimbursement Outside North America & Europe
Latin America has fewer than 400,000 insured pets despite an 80 million-animal base, while Southeast Asia has fewer than 250,000 insured pets, leaving molecular assays priced at USD 80-150 beyond reach for most clinics. Cash-pay markets gravitate toward USD 25-40 chemistry panels, limiting diagnostic depth. Vendors must choose between discounted emerging-market SKUs or delayed entry until insurance platforms mature.
Escalating Overall Pet-Care Costs
Average U.S. veterinary spending per dog exceeded USD 1,200 in 2024, pushing uninsured owners to decline optional panels that collectively account for 22% of in-clinic diagnostic revenue. Practices now tier protocols into budget and comprehensive packages, risking under-diagnosis among price-sensitive clients. Suppliers that roll out subscription reagent pricing or lower-cost antigen tests can recapture volume without eroding margins.
*Our forecasts treat driver/restraint impacts as directional, not additive. The impact forecasts reflect baseline growth, mix effects, and variable interactions.
Companion Animal Diagnostic Market Segment Analysis
By Animal:
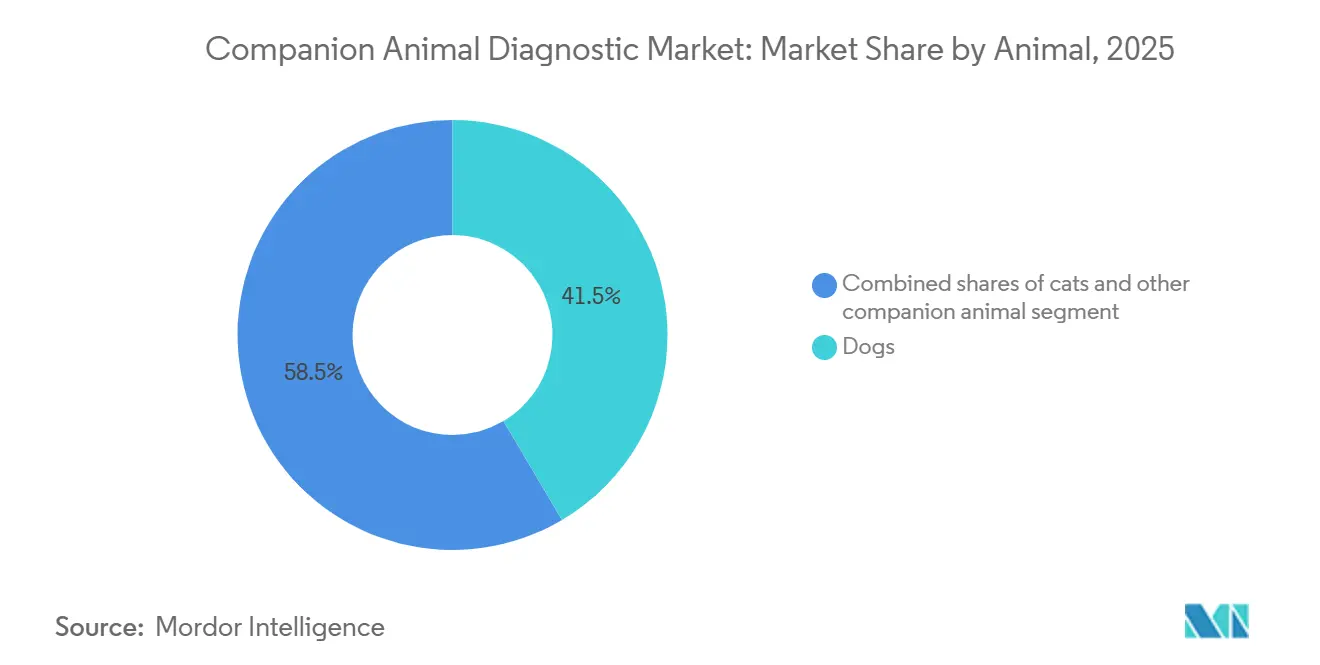
Diagnostic Spending Dominated by Dogs, Surging Growth in ExoticsDogs generated 41.5% of the companion animal diagnostic market revenue in 2025, supported by 65.1 million dog households in the United States and higher per-animal spend on breed-specific screening. Exotic pets, including birds and rabbits, will outpace all categories at an 11.23% CAGR, fueled by new multiplex PCR panels able to detect twelve psittacine pathogens from a single swab.
The segment’s momentum reflects a 14% rise in board-certified avian and exotic practitioners in 2024, creating professional demand for specialized assays. Economies of scope allow one USD 15 multiplex test to replace three separate USD 60 single-pathogen assays, expanding routine screening. This tailwind positions the exotic category as a pivotal contributor to companion animal diagnostic market growth between 2026 and 2031.

By Application:
Parasitology Ascends via Tele-Veterinary ChannelsClinical pathology held 33.4% of application revenue in 2025, anchoring wellness exams and pre-anesthetic workups. Parasitology is projected to lead growth at an 11.78% CAGR, driven by at-home fecal kits mailed to reference labs, a workflow pioneered by Labrador’s USD 79 subscription.
Mail-in convenience appeals to time-constrained pet owners and removes clinic visit barriers, a model that processed 12,000 samples in Q3 2024 alone. Clinics counter by bundling parasite screens into puppy and kitten packages, preserving some in-house volume. Nevertheless, remote fecal testing will inject new recurring revenue into the companion animal diagnostic market while challenging clinic-centric sales channels.
By Technology:
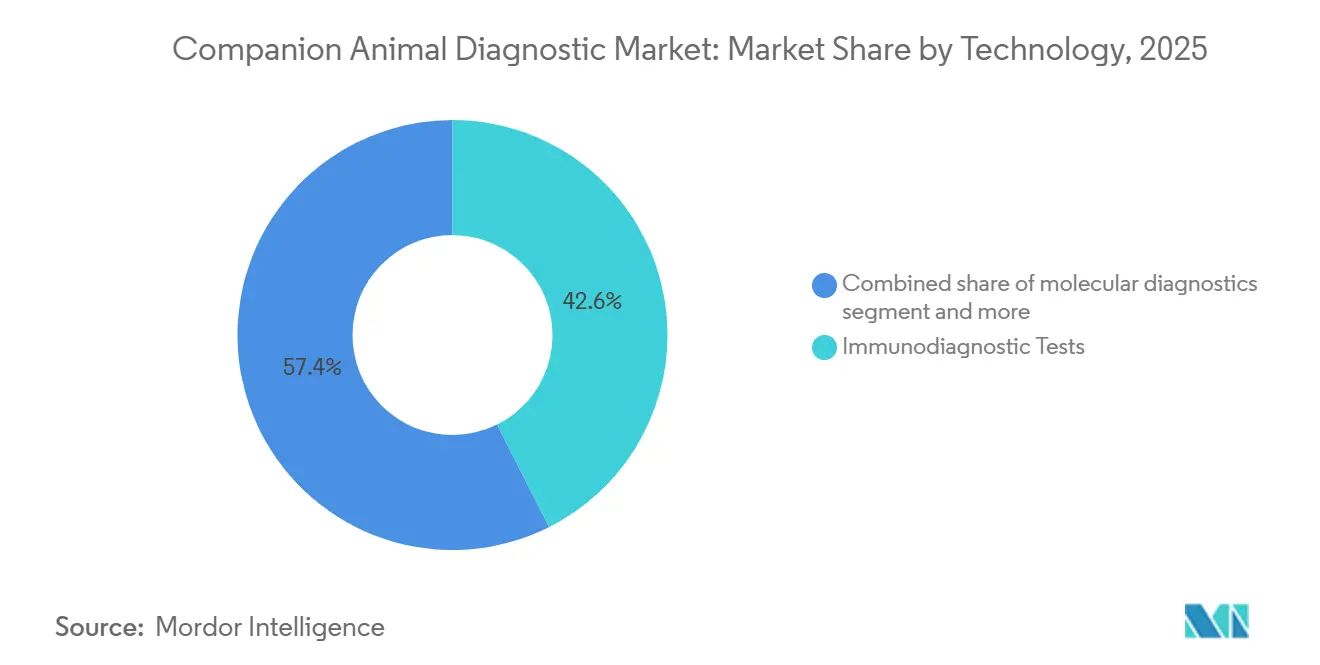
Molecular Assays Deliver Fastest UpsideImmunodiagnostics remained the largest spend bucket at 42.6% in 2025, but molecular diagnostics will drive an 11.98% CAGR to 2031, the fastest among all technologies. RealPCR panels now identify up to eight respiratory pathogens from one swab in six hours, enabling same-day therapy.
Sequencing-based oncology tests from Antech provide actionable mutation data for canine lymphoma at USD 450 per panel. These capabilities shorten empirical treatment and support antimicrobial stewardship mandates, propelling revenue expansion and reinforcing the premium tier of the companion animal diagnostic market.
By End User:
Point-of-Care Capacity Expands FastestDiagnostic laboratories captured 46.5% revenue in 2025, leveraging broad menus and logistics scale. Point-of-care environments will post a 12.21% CAGR to 2031, aided by Heska’s Element POC system that unifies chemistry, hematology, immunoassay, and coagulation for about USD 45,000 per clinic.
Clinics favor real-time answers that influence care plans during client visits, relegating esoteric tests to reference labs. This in-house migration tilts consumable demand toward rapid cartridges, reinforcing recurring revenue streams and intensifying instrument placement battles among incumbent suppliers inside the companion animal diagnostic market.
Geography Analysis
North America Companion Animal Diagnostic Market
North America represented 47.1% of 2025 revenue, buoyed by 5.36 million insured pets and a veterinary workforce exceeding 127,000 practitioners. Average annual spend per dog topped USD 1,200 in 2024, a level that supports early adoption of AI-driven analyzers and multiplex PCR panels. Canada contributes incremental growth, whereas Mexico remains under-penetrated, creating white-space for mid-tier reagent bundles. IDEXX booked 9% organic growth in Q3 2024, largely from North American clinics adding reference instruments.
Europe Companion Animal Diagnostic Market
Europe ranked second by value, propelled by pet insurance penetration above 25% in the United Kingdom and mandatory bacteriology testing under Regulation 2024/1973, a directive expected to lift culture volume by up to 30% within two years [3]. Scandinavia’s 40% penetration sustains premium diagnostics, while Southern and Eastern Europe lag due to lower discretionary income. Reference labs in Germany and France are adopting automated microbiology systems that shrink time-to-result to 24 hours, aligning with stewardship timelines.
APAC Companion Animal Diagnostic Market
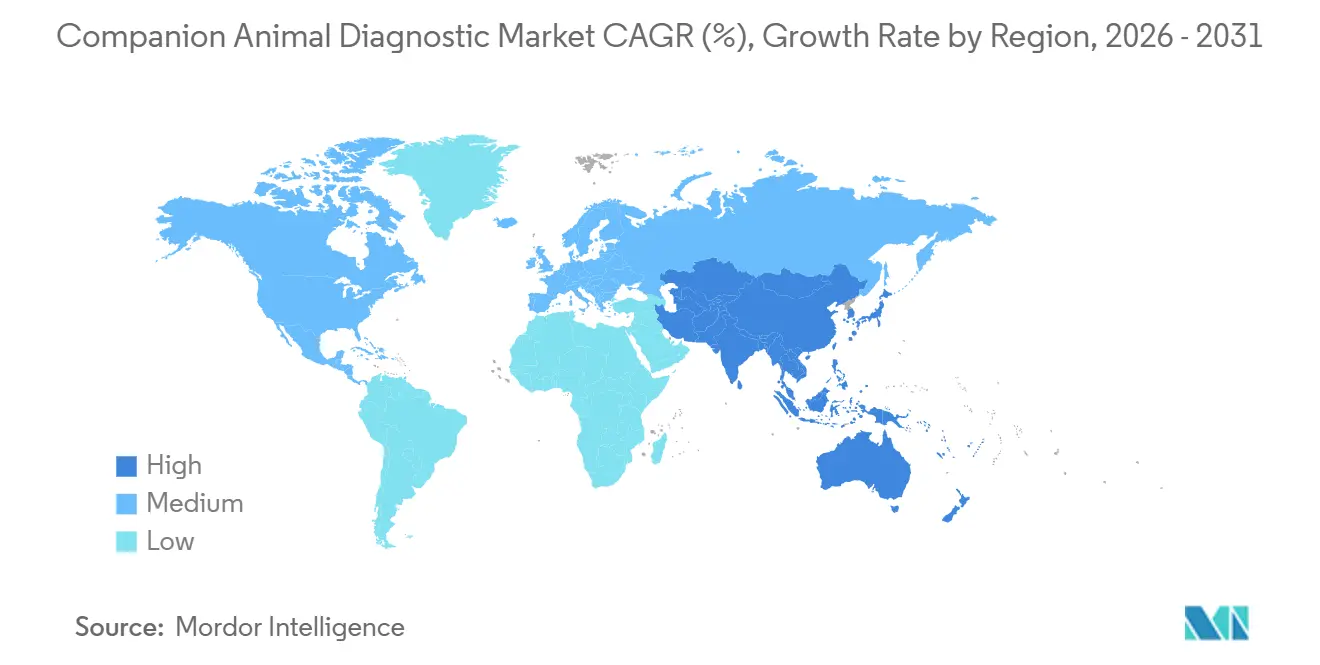
Asia-Pacific is forecast to deliver an 11.41% CAGR through 2031, led by China’s 120 million-plus pet population and Japan’s mature clinic infrastructure. Insurance coverage remains below 1% in China, so suppliers courting the region emphasize lower-cost antigen tests and bundled wellness plans. Australia stands out with penetration doubling to 21% by 2024, enabling rapid analyzer installations. India’s undersupply of veterinarians caps near-term revenue, yet telemedicine platforms are starting to bridge access gaps in tier-one cities.
Regulatory Landscape
Companion animal diagnostics operate under a fragmented oversight model that varies by product type and jurisdiction. In the United States, veterinary diagnostic products tied to infectious agents can fall under USDA APHIS Center for Veterinary Biologics (CVB) oversight, while many veterinary testing devices align to the FD&C Act misbranding and adulteration provisions rather than human-device style premarket pathways. This split drives different compliance expectations for assay validation, labeling, and use in official disease-control contexts.
In Europe, veterinary medicinal products are regulated under Regulation (EU) 2019/6 (EMA/CVMP), but the EU does not have a single harmonized, veterinary-specific medical device framework, so consumer-facing veterinary devices often align to general product safety requirements. Cross-border standardization also comes through international bodies and accreditation: WOAH updates diagnostic standards via its codes and manuals, and in Australia NATA issued an ISO/IEC 17025 Animal Health appendix effective February 2026 that moves antimicrobial susceptibility testing away from CDS toward EUCAST or CLSI methodologies. That shift affects laboratory workflows and method selection for bacteriology testing.
Competitive Landscape
IDEXX, Zoetis, and Neogen Corporation jointly command a majority of companion animal diagnostic market revenue through hardware, consumables, and cloud analytics ecosystems. IDEXX’s razor-and-blade model places subsidized instruments that lock clinics into proprietary reagent purchases; placements grew 11% in 2024. Zoetis leverages pharmaceutical distribution to cross-sell its Vetscan line, producing USD 198 million in Q3 2024 diagnostics revenue. Heska differentiates with its single-footprint Element POC analyzer that trims capital spend for small clinics.
Specialists fill niche gaps. Zoologix addresses exotic species with 12-pathogen PCR panels that lower per-pathogen costs by 75%. Tele-veterinary startups Labrador and QSM Diagnostics enable at-home fecal testing, capturing low-acuity volume that once flowed through brick-and-mortar clinics. BioMérieux and Thermo Fisher supply automated culture and reagent systems to reference labs but lack direct clinic channels, limiting visibility at the point of care.
Patent filings for saliva-based microfluidic chips targeting parvovirus and feline leukemia rose sharply in 2024, highlighting a potential platform shift toward non-invasive diagnostics. Incumbents may need to acquire these innovators or risk ceding share when commercial launches occur within three years.
Companion Animal Diagnostic Industry Leaders
-
Neogen Corporation
-
Zoetis Inc.
-
IDEXX Laboratories Inc.
-
INDICAL BIOSCIENCE GmbH
-
Randox Laboratories Ltd.
- *Disclaimer: Major Players sorted in no particular order
Companion Animal Diagnostic Market Companies Covered in this Report
- Agrolabo
- bioMérieux
- Mars Veterinary Health
- Creative Diagnostics
- FUJIFILM
- GE Healthcare
- Heska
- IDEXX
- IDvet (Innovative Diagnostics)
- Indical Bioscience
- Neogen
- QIAGEN
- Randox Laboratories
- Thermo Fisher Scientific
- Virbac
- VMRD Inc.
- Zoetis
- Zomedica Corp.
Market Opportunities and Future Outlook
Opportunities concentrate where regulatory and clinical workflows are pushing testing from discretionary to routine and from centralized labs toward near-patient decisions. The EU move toward compulsory pathogen identification under Regulation 2024/1973 (as reflected in the report context) increases baseline bacteriology demand and raises the value of platforms that pair rapid identification with standardized antimicrobial susceptibility testing aligned to EUCAST/CLSI, supported by NATA’s February 2026 ISO/IEC 17025 Animal Health appendix requirement in Australia. This is translating into whitespace for suppliers that can provide validated, outbreak-ready sampling and testing procedures and help laboratories transition methods without disrupting turnaround targets.
Technology-led whitespace is also expanding at point of care and across new diagnostic modalities that fit clinic and tele-veterinary workflows. AI-enabled in-clinic interpretation (for example, Zoetis Vetscan Imagyst in the report context) and portable molecular formats (isothermal amplification and emerging CRISPR-based approaches cited in recent literature) reduce reliance on reference lab logistics, which is particularly relevant in emerging markets constrained by cold-chain availability. Oncology and chronic disease screening are moving into routine panels as well, illustrated by IDEXX’s expansion and geographic rollout of its Cancer Dx offering, and by biomarker integration into common chemistry profiles (SDMA), creating room for menu expansion, subscription reagent models, and tighter integration with practice information management systems and remote consultation pathways.
Recent Industry Developments in Companion Animal Diagnostic Market
- July 2026: Zoetis announced an agreement to acquire VitalRADS, a veterinary teleradiology and imaging services provider. The acquisition brings imaging interpretation closer to ZoetisDx workflows and strengthens an integrated diagnostics offering spanning in-clinic testing and remote specialist reads.
- November 2025: Zoetis acquired Veterinary Pathology Group in the UK and Ireland to broaden its diagnostics network. The acquisition expands access to pathology expertise and supports deeper linkage between sample-based testing and clinical decision support in key European markets.
- January 2024: Zoetis expanded Vetscan Imagyst capabilities to support additional AI-assisted interpretations beyond fecal analysis, including slide-based workflows used in routine visits. This widened the addressable in-clinic testing footprint by accelerating time-to-result for common diagnostic workups.
Companion Animal Diagnostic Market Report Scope and Research Methodology
Market Definition and Coverage
For this methodology, the companion animal diagnostics market covers the revenues earned from tests and diagnostic procedures used to detect, monitor, and support treatment decisions for pets, across in-clinic and laboratory settings.
Scope exclusions: This sizing does not count broader veterinary treatment revenues (such as surgery and therapeutics) unless they are directly part of a diagnostic test or imaging service.
Segments Covered in This Report
- By Animal
- Cats
- Dogs
- Other Companion Animals (birds, rabbits, etc.)
- By Application
- Bacteriology
- Parasitology
- Clinical Pathology
- Other Applications
- By Technology
- Immunodiagnostic Tests
- Molecular Diagnostics
- Diagnostic Imaging
- Other Diagnostics (biosensors, microfluidics)
- By End-User
- Veterinary Hospitals & Clinics
- Diagnostic Laboratories
- Others (Point-of-Care/In-house Testing and Research & Academic Institutes)
- Geography
- North America
- United States
- Canada
- Mexico
- Europe
- Germany
- United Kingdom
- France
- Italy
- Spain
- Rest of Europe
- Asia-Pacific
- China
- Japan
- India
- Australia
- South Korea
- Rest of APAC
- Middle East & Africa
- GCC
- South Africa
- Rest of Middle East & Africa
- South America
- Brazil
- Argentina
- Rest of South America
- North America
Data Sources, Market Sizing, and Validation
Desk Research
Desk work was used to set clear boundaries for what counts as companion animal diagnostic revenue, then to anchor model inputs with public indicators. We relied on sources such as USDA APHIS pet and animal health information, CDC zoonotic disease resources, the World Organisation for Animal Health (WOAH) updates, and OECD health and trade statistics where equipment movement is relevant.
To make the model practical, we also reviewed company annual reports and investor presentations for diagnostic and animal health exposure, plus association and veterinary body publications that discuss testing adoption and care patterns. In addition, paid subscriptions focused on company financials and intelligence, news and financials, and patent databases were used to cross-check technology shifts and product pipeline mentions. These examples are not exhaustive, and we used many other public and internal references for data collection, validation, and clarification during the work.
Primary Interviews and Surveys
Primary work was done through expert interviews and structured surveys with veterinary hospitals and clinics, diagnostic laboratories, and channel participants that influence test volumes and pricing. We covered major demand regions (APAC, EMEA, and the Americas) so the assumptions on test mix, in-clinic versus reference lab split, and pricing changes could be challenged and corrected where needed.
Distribution of primary research fieldwork respondents
| Company type | Respondent position | Region |
|---|---|---|
| Top tier: 31% | CXOs: 18% | APAC: 44% |
| Mid tier: 50% | Functional/Unit leaders: 33% | EMEA: 30% |
| Smaller Players: 19% | Managers: 49% | Americas: 26% |
Market-Sizing & Forecasting
Sizing starts with a top-down build where pet population and vet visit activity are translated into an addressable testing pool, which is then split by where the test is performed and what category it falls into. After the demand pool is formed, we apply a realistic test mix across clinical pathology, immunodiagnostics, molecular diagnostics, and diagnostic imaging, then convert volumes into value using average selling price (ASP) bands that reflect in-clinic point-of-care versus reference lab pricing.
To keep the results grounded, we corroborate totals with selective bottom-up checks, including sampled ASP times volume calculations for common test menus, channel checks on instrument placements, and revenue reasonableness checks against disclosed business lines in public filings. Key inputs used in the model include pet ownership trends, incidence of common chronic and infectious conditions that drive testing, clinic throughput and staffing constraints, the share of in-house testing adoption, and country level pricing and currency factors. For forecasting, we run scenario analysis around testing adoption and ASP movement, and we tighten the near-term path using time-series smoothing on observed growth patterns after our assumptions are reviewed with practitioners.
When data is thin in smaller countries, we handle the gaps using proxy indicators like vet clinic density, import patterns for diagnostic equipment, and price parity benchmarks, then adjust the output through interview feedback so it stays realistic.
Data Validation & Update Cycle
Validation is done in multiple steps so the model does not drift away from real-world signals. We compare outputs against independent markers such as regional veterinary service activity, diagnostic equipment shipment direction, and visible changes in testing behavior, then re-check any sharp jumps before final sign-off.
If a major assumption moves, for example a sudden pricing shift or a change in in-clinic testing adoption, we trigger targeted re-contacts and rework the affected inputs. The report is refreshed annually, and interim updates are made when material events occur. An analyst completes a final fresh pass right before delivery so clients receive the latest updated view.
Mordor Intelligence's Companion Animal Diagnostic Market Size Versus Other Published Estimates
Published market values for companion animal diagnostics can look far apart because firms do not always count the same revenue streams, and they also differ on timing choices like base year currency conversion and price updates. Differences can also come from how much weight is given to in-clinic testing versus reference lab work, and whether imaging is treated as a full diagnostic revenue pool or only as equipment and consumables.
A refresh-led gap shows up when ASPs are rolled forward using general inflation rather than test-menu and setting-specific pricing, and when FX is applied using an annual average that does not match the year of the revenue being modeled. With the page updated in January 2026, currency timing and category-level ASP checks were re-validated in the model used by Mordor Intelligence, which reduces overstatement when imaging and molecular testing adoption accelerates unevenly across regions.
Benchmark comparison
| Source | Market Size | Gaps in Research Methodology |
|---|---|---|
| Mordor Intelligence | USD 3.77 B (2026) | |
| Global Consultancy A | USD 6.42 B (2025) | Uses a broader revenue lens that can pull in additional testing settings and adjacent animal categories, and it may apply higher blended ASP progression without a clear split between in-clinic and reference lab price behavior. |
| Industry Publisher B | USD 7.06 B (2025) | Appears to include a wider diagnostic revenue stack with different treatment of imaging and home care, and the 2025 value can reflect different FX timing and a higher assumed test intensity per pet visit. |
The comparison mainly points to scope and pricing mechanics rather than a simple math difference. By keeping test volumes tied to an explicit demand pool and then applying setting-specific ASPs with consistent currency timing, our estimate stays traceable to steps that can be repeated and reviewed.
Key Questions Answered in the Report
What is the current value of the companion animal diagnostics market?
The market is estimated to reach USD 3.77 billion in 2026 and is projected to hit USD 6.10 billion by 2031.
Which region holds the largest share of spending on companion animal tests?
North America led with 47.1% of global revenue in 2025 thanks to high insurance coverage and advanced clinic infrastructure.
Which application segment is growing fastest in diagnostics for pets?
Parasitology is advancing at an 11.78% CAGR through 2031, driven by at-home fecal testing kits and tele-veterinary adoption.
How is AI influencing diagnostic workflows in veterinary practice?
AI-enabled analyzers like Vetscan Imagyst and Vetscan OptiCell cut interpretation times to minutes and allow clinics to shift many tests in-house, boosting point-of-care revenue.