Market Overview
| Study Period | 2020 - 2031 |
|---|---|
| Forecast Data Period | 2026 - 2031 |
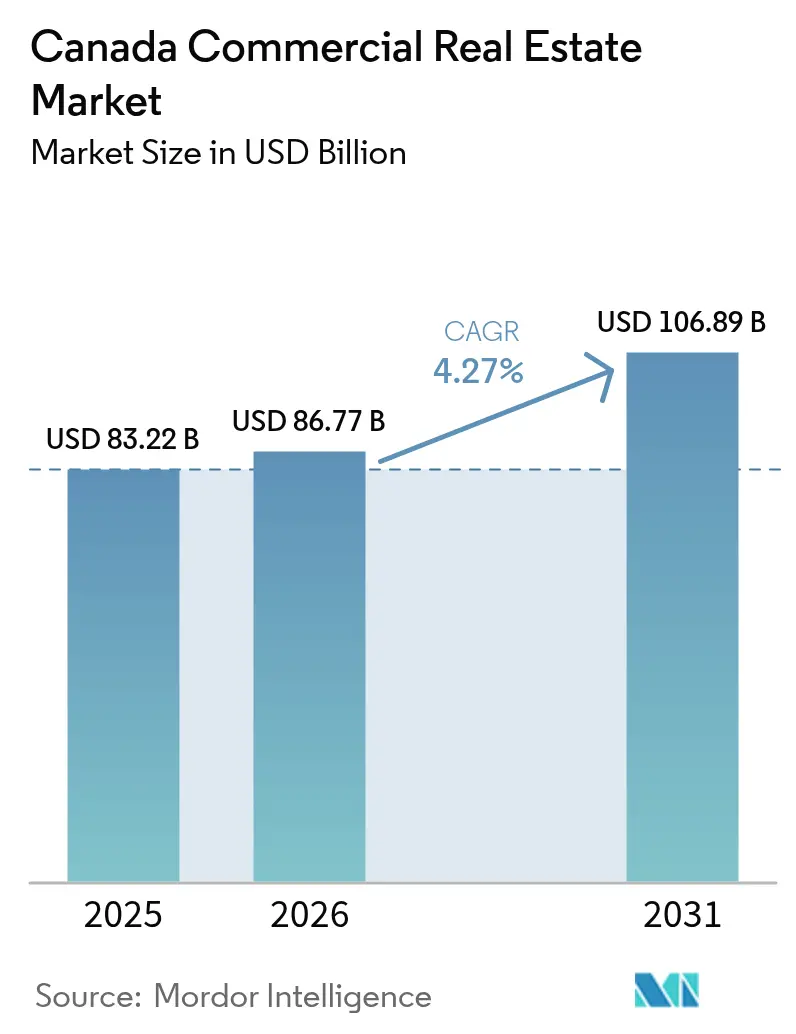
| Base Year Market Size (2025) | USD 83.22 Billion |
| Market Size (2026) | USD 86.77 Billion |
| Market Size (2031) | USD 106.89 Billion |
| Growth Rate (2026 - 2031) | 4.27% CAGR |
| Market Concentration | Medium |
Major Players *Disclaimer: Major Players sorted in no particular order Image © Mordor Intelligence. Reuse requires attribution under CC BY 4.0. | |
Canada Commercial Real Estate Market Analysis by Mordor Intelligence
The Canada commercial real estate market size was valued at USD 83.22 billion in 2025 and estimated to grow from USD 86.77 billion in 2026 to reach USD 106.89 billion by 2031, at a CAGR of 4.27% during the forecast period (2026-2031). Investor sentiment has improved as lower policy rates narrow financing spreads, prompting pension funds and REITs to recycle capital into core assets while off-loading non-strategic properties. Immigration-led population growth, an uptick in near-shoring manufacturing, and persistent e-commerce adoption are widening demand for offices, logistics facilities, and mixed-use developments. Infrastructure spending, such as the USD 356 million CN rail upgrade in Quebec, is reinforcing trade corridors and boosting industrial site absorption. Meanwhile, Quebec’s low-cost hydro power is luring data-center operators, deepening the province’s appeal as a technology services hub.
Key Report Takeaways
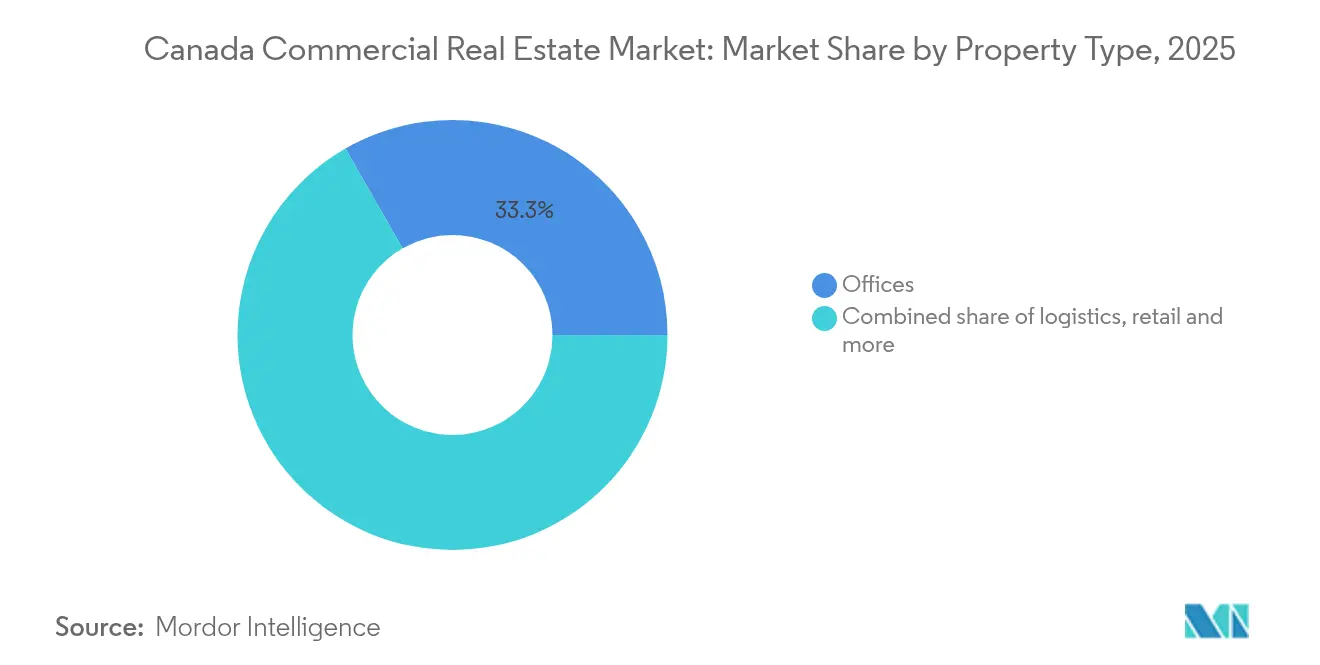
- By property type, offices led with a 33.30% share of the Canada commercial real estate market in 2025; logistics assets are projected to grow at a 4.96% CAGR to 2031.
- By business model, the sales segment held 62.30% of the Canada commercial real estate market share in 2025, while the rental segment records the quickest expansion at 4.85% CAGR through 2031.
- By end-user, corporates and SMEs accounted for 72.45% of the Canada commercial real estate market size in 2025 and are advancing at a 4.72% CAGR.
- By region, Ontario captured 28.90% of the Canada commercial real estate market in 2025; Quebec is the fastest-growing geography with a 4.95% CAGR to 2031.
Note: Market size and forecast figures in this report are generated using Mordor Intelligence’s proprietary estimation framework, updated with the latest available data and insights as of 2026.
Canada Commercial Real Estate Market Trends and Insights
Drivers Impact Analysis*
| Driver | (~) % Impact on CAGR Forecast | Geographic Relevance | Impact Timeline |
|---|---|---|---|
| Federal immigration target of 500 k new residents yearly | +1.2% | National; concentrated in Toronto, Vancouver, Montreal | Long term (≥ 4 years) |
| Near-shoring industrial demand along Ontario–Quebec corridor | +0.8% | Ontario & Quebec, spillover to Atlantic Canada | Medium term (2–4 years) |
| E-commerce surpassing 8% of retail sales | +0.6% | National urban centers | Medium term (2–4 years) |
| REIT capital recycling and pension-fund dry powder | +0.5% | Core markets of Toronto, Vancouver, Montreal | Short term (≤ 2 years) |
| Toronto tech-tenant expansion in Class-A offices | +0.4% | Greater Toronto Area, Ottawa, Waterloo | Short term (≤ 2 years) |
| Data-center migration to Quebec hydro power | +0.3% | Quebec; extension to Manitoba, British Columbia | Long term (≥ 4 years) |
| Source: Mordor Intelligence | |||


Surge in near-shoring-fueled industrial demand along the Ontario–Quebec corridor
Manufacturers moving production closer to North American consumers are absorbing warehouse and flex assets across the Windsor-Quebec City stretch, encouraged by Quebec’s USD 4.05 billion competitiveness plan that counters U.S. trade barriers.[1]“Discours sur le budget 2025-2026,” finances.gouv.qc.cammigration,” canada.ca Industrial leasing remains brisk in automotive and advanced-manufacturing clusters, even though national exports fell 2.8% in Q3 2024. Enhanced CN rail capacity, underpinned by a USD 356 million upgrade, lifts throughput and reduces transit times, strengthening the corridor’s logistics profile. Developers are adding modern, high-clear-height facilities, yet construction pipelines stay disciplined amid cost inflation, preventing oversupply. Medium-term absorption is set to dominate new completions as distribution operators prioritize speed-to-market advantages.
Federal immigration targets adding 500 k residents annually boosting multi-family construction
Policy makers aim to admit 395 000 permanent residents in 2025, tapering to 365 000 by 2027, with 29% of arrivals holding construction trades skills.[2]Statistics Canada, “Building Construction Price Indexes, Q1 2025,” statcan.gc.ca The influx intensifies demand for neighborhood retail, life-cycle office services, and urban logistics nodes in Toronto, Vancouver, and Montreal. Stable household formation supports mixed-use projects near transit, narrowing the housing supply gap by an expected 670 000 units by 2027. Secondary cities such as Halifax and Saskatoon are also attracting newcomers, broadening the geographic footprint of commercial developments. Developers are leveraging modular designs that can pivot between residential and ground-floor commercial use to future-proof projects.
Toronto tech-tenant expansion sustaining Class-A office pre-leasing despite hybrid work
Technology employers continue to prioritise collaborative hubs, evidenced by Kainos tripling Toronto headcount to 300 by 2025. Large pre-lease deals are queued for delivery through 2026 even as the citywide vacancy sits at 19.2%. Tenants prefer amenity-rich towers that support employee wellness and ESG credentials, leading to a bifurcated market in which Grade-A space outperforms commodity offices. Co-working operators are also scaling footprints, absorbing backfill space from occupiers rightsizing portfolios. Short-term incentives, such as turnkey build-outs and rent abatements, remain prevalent but are expected to taper once vacancy plateaus.
E-commerce penetration crossing 8% of retail sales driving last-mile urban logistics
Retailers upgrading omnichannel capabilities are leasing micro-fulfillment centers within 10 km of dense consumer clusters, decreasing delivery times and lowering emissions. The International Transport Forum highlights sidewalk delivery robots as a promising solution for congestion alleviation, nudging zoning authorities to permit smaller logistics footprints in mixed-use areas. Adaptive reuse of older retail boxes into cross-docks is common, especially around Toronto and Vancouver. Developers are factoring in higher power loads and data connectivity to accommodate automation. Medium-term demand for sub-150 k sq ft facilities is forecast to outstrip supply, keeping rents on an upward trajectory.
Restraints Impact Analysis*
| Restraint | (~) % Impact on CAGR Forecast | Geographic Relevance | Impact Timeline |
|---|---|---|---|
| Elevated Bank of Canada policy rate keeping cap rates sticky and valuations volatile | -0.9% | National; most acute in Toronto & Vancouver | Short term (≤ 2 years) |
| Construction-cost inflation averaging 11% CAGR pressuring development margins | -0.7% | Major urban centers nationwide | Medium term (2–4 years) |
| Tightening ESG disclosure requirements raising retrofit capex for legacy assets | -0.6% | National; older Class-B/C assets in Toronto, Montreal, Calgary | Medium term (2–4 years) |
| Suburban office vacancy spikes post-pandemic dampening rental growth outside CBDs | -0.4% | Suburban sub-markets of Toronto, Vancouver, Ottawa | Short term (≤ 2 years) |
| Source: Mordor Intelligence | |||
Elevated Bank of Canada policy rate keeping cap rates sticky and valuations volatile
Although the policy rate eased to 3% in 2025, mortgage spreads continue to shadow bond yields, sustaining a bid-ask gap that muffles transaction velocity. Cap-rate decompression is most visible in secondary office and retail, while prime industrial remains tighter. Smaller sponsors relying on bank credit are retreating, allowing well-capitalized REITs to consolidate positions. Forward hedging costs keep development starts subdued until financing markets stabilise further. Short-term, price discovery hinges on additional rate cuts and clarity around U.S. tariff policies.
Construction-cost inflation averaging 11% CAGR pressuring development margins
Statistics Canada recorded a 3.5% year-over-year cost rise for non-residential builds in Q1 2025, with local spikes in London and Regina. [3]Government of Canada, “Government of Canada Reduces IMinistère des Finances du Québec, Material volatility, notably for steel and aluminum, complicates tender pricing and squeezes fixed-price contracts. Developers of affordable housing and mixed-use projects struggle to pass costs to tenants, forcing redesigns or phased delivery. Prefabrication and bulk-buy procurement are mitigating some pressures but require scale that smaller builders lack. Supply-chain hiccups in mechanical equipment elongate project timelines, adding carry costs and contingency premiums.
*Our forecasts treat driver/restraint impacts as directional, not additive. The impact forecasts reflect baseline growth, mix effects, and variable interactions.
Segment Analysis
By Property Type: Offices anchor activity while logistics accelerates
Offices accounted for 33.30% of the Canada commercial real estate market in 2025, reinforcing their role as the sector’s primary revenue driver. Vacancy peaked at 18.4% nationwide yet stabilized as tenants traded up to modern space, compressing obsolescence risk in newer towers. Investment flowed into experiential upgrades—wellness centers, flexible collaboration zones, and renewable-powered HVAC—to retain knowledge-sector occupiers. The flight-to-quality dynamic, coupled with limited new-build starts, underpins rental resilience in Class-A assets across Toronto, Vancouver, and Montreal. Meanwhile, provincial incentives for office-to-residential conversion removed 870 000 sq ft from stock in Q1 2024, tightening prime supply and supporting rent growth in downtown nodes.
Logistics is the fastest-growing category, expanding at a 4.96% CAGR through 2031 as retailers target same-day fulfilment standards. Multi-level urban warehouses and cold-chain facilities attract institutional capital keen to capture steady cash flows. Developers emphasize power redundancy, dock-door ratios, and turnaround lanes compatible with electric delivery fleets. Despite elevated land prices near Toronto’s Pearson Airport, demand consistently outruns supply, maintaining rent premiums and low structural vacancy. Investors employing cross-docking retrofits and mezzanine build-outs are boosting returns without large green-field risk. Collectively, offices and logistics together represent more than half of the Canada commercial real estate market size, signalling balanced exposure between legacy and growth-oriented assets.


By Business Model: Sales turnover dominates, but rentals lead growth
Sales transactions constituted 62.30% of the Canada commercial real estate market in 2025, reflecting capital-recycling strategies among REITs and pension funds. Mega-deals, such as Artis REIT’s USD 729.7 million divestment program, illustrate active portfolio rebalancing that supports liquidity in core markets. Foreign investors, notably from Singapore and Germany, are net buyers of stabilized retail and industrial assets, leveraging favorable currency differentials. Title transfers have clustered around Toronto and Vancouver, where data transparency accelerates underwriting. Nonetheless, bid-ask alignment remains fragile when debt pricing is volatile.
The rental model, growing at 4.85% CAGR, is becoming central to institutional strategies prioritizing income durability during economic uncertainty. CAPREIT’s 98.1% occupancy and USD 117.3 million same-property NOI in 2024 spotlight rental resilience s25.q4cdn.com. Asset managers are deploying smart-building systems to optimize landlord-controlled utilities, lifting net operating income without elevating face rents. ESG compliance frameworks also unlock green financing advantages, lowering interest costs on refinances. As debt markets stabilise, analysts expect rental portfolios to command valuation premiums relative to trading-oriented platforms, cementing their share of the Canada commercial real estate market size over the forecast horizon.
By End-User: Corporates and SMEs shape demand patterns
Corporates and SMEs commanded 72.45% of the Canada commercial real estate market in 2025 and are forecast to expand at a 4.72% CAGR, buoyed by technology-sector hiring and on-shoring manufacturing. Employers seek high-density, transit-rich office precincts to access talent and foster collaboration. The segment’s growth also fuels requirements for regional distribution hubs that support omnichannel retail strategies. SMEs in life sciences, fintech, and creative industries gravitate toward flexible leases within innovation districts, creating opportunities for landlords offering plug-and-play space.
Demand from individuals and households centers on neighborhood-scale retail and mixed-use assets that integrate grocery anchors with community services. Government and institutional users, while smaller, supply steady revenue streams through long-duration leases, particularly in defense, education, and healthcare facilities. Corporates’ shift toward hybrid work has increased interest in adaptable floor plates and wellness-certified air filtration systems, pushing landlords to retrofit stock quickly. Immigration-driven labor growth adds further depth to occupier pipelines, ensuring that corporates and SMEs remain the dominant influencers of Canada commercial real estate market share over the medium term.

Geography Analysis
Ontario held 28.90% of the Canada commercial real estate market in 2025, anchored by the Greater Toronto Area’s dense agglomeration of financial, technology, and life-science tenants. Electricity demand in the province is projected to climb 60% by 2050, underpinning infrastructure investment that boosts commercial construction. The Ministry of Economic Development earmarked USD 1.85 billion for 2025-2026 to court advanced-manufacturing projects, while the Transit-Oriented Communities initiative incentivizes mixed-use nodes around new subway stations. Vulnerability to U.S. trade policy persists, as three-quarters of provincial exports cross the American border, but near-shoring trends partly offset that risk by encouraging local production.
Quebec, the fastest-growing province at a 4.95% CAGR, leverages USD 4.05 billion in economic programs and abundant hydro power to court data-center and aerospace investors. Investissement Québec logged USD 6.5 billion in foreign direct investment across 82 projects in 2024-2025, signalling diversified demand beyond traditional manufacturing. CN’s USD 356 million rail upgrade and the REM light-rail project propel logistics capabilities and catalyze USD 9 billion in contiguous real estate development. Broader export strategies targeting Europe and Asia reduce dependence on U.S. markets, softening cyclical shocks.
British Columbia and Alberta offer counter-cyclical positioning, with Calgary’s recovery anchored by energy diversification and professional-services growth. The Canada Infrastructure Bank pipeline exceeding USD 25 billion in public-private projects across Western provinces enlarges the industrial and office footprints of second-tier cities. Atlantic Canada benefits from spillover logistics demand and a growing near-shoring footprint in food processing and clean-tech components. Across regions, specialization—whether in clean energy, AI infrastructure, or advanced manufacturing—dictates capital allocation strategies, widening the canvas for investors pursuing balanced exposure within the Canada commercial real estate market.
Competitive Landscape
Market competition is moderate, with nationally diversified REITs and pension-backed managers holding substantial portfolios while specialist developers carve out high-growth niches. RioCan, Brookfield Properties, and Oxford Properties rely on scale to access low-cost debt and seize core urban redevelopment plots. Colliers’ pending purchase of Triovest forms a services powerhouse overseeing more than 95 million sq ft, adding integrated asset-management capacity and expanding brokerage presence in secondary markets. The consolidation wave enhances bargaining power with lenders and contractors, but it narrows supplier diversity for smaller landlords.
Strategic activity centers on capital recycling: Artis REIT cut leverage to 40.2% after unloading USD 729.7 million of assets, redeploying funds into high-growth Vancouver industrial projects. PROREIT’s USD 72.4 million Winnipeg acquisition lifts its industrial weighting to 88% of gross leasable area, demonstrating a pivot toward defensive cash-flow assets. Pension funds such as CDPQ pursue data-center and life-science platforms that align with long-duration liabilities and ESG mandates. Each move underscores a trend toward sharpening portfolio focus, reducing exposure to vulnerable suburban offices.
Technology adoption further differentiates leading landlords. ESG reporting suites, tenant-engagement apps, and predictive maintenance platforms are now standard across top portfolios. Brookfield leverages AI-based energy analytics to trim operating costs, while Oxford deploys smart-building sensors to optimize air quality and occupant comfort. Smaller entrants mitigate scale disadvantages by targeting underserved niches—cold storage near Atlantic ports or mass-timber office buildings appealing to green-economy tenants. The resulting competitive dynamic rewards both capital muscle and specialized operating expertise within the Canada commercial real estate market.
Canada Commercial Real Estate Industry Leaders
Brookfield Property Partners L.P.
Cadillac Fairview Corporation Ltd.
Oxford Properties Group
Allied Properties REIT
Dream Office REIT
- *Disclaimer: Major Players sorted in no particular order

Recent Industry Developments
- June 2025: CDPQ posted a 9.4% return for 2024, increasing net assets to USD 354.8 billion despite challenges in U.S. office holdings.
- May 2025: CN announced a USD 356 million infrastructure program in Quebec, bolstering rail capacity and digital systems to streamline freight flows.
- April 2025: Colliers disclosed plans to purchase Triovest, creating a platform managing more than 95 million sq ft and USD 15 billion in projects.
- March 2025: Quebec unveiled a USD 4.05 billion stimulus package to cushion firms from U.S. protectionism and expand infrastructure spending over three years.


Research Methodology Framework and Report Scope
Market Definitions and Key Coverage
Our study defines the Canadian commercial real estate market as income-producing built assets, offices, retail centers, logistics or other industrial facilities, hospitality properties, and mixed-use complexes that are bought, sold, leased, or delivered for business purposes, and it is expressed in constant 2025 US dollars. According to Mordor Intelligence, transactions are counted at closing value, and projects that reach practical completion within the base year are included to mirror Statistics Canada investment statistics.
Scope Exclusion: Purely residential dwellings, raw land banking, civic infrastructure, and property-management service fees are outside this scope.
Segmentation Overview
- By Property Type
- Offices
- Retail
- Logistics
- Others (industrial real estate, hospitality real estate, etc.)
- By Business Model
- Sales
- Rental
- By End-user
- Individuals / Households
- Corporates & SMEs
- Others
- By Region (Province)
- Ontario
- Quebec
- British Columbia
- Alberta
- Rest of Canada
Detailed Research Methodology and Data Validation
Primary Research
We strengthened desk findings through interviews and structured surveys with broker principals, pension-fund asset managers, construction contractors, and municipal planners across Ontario, Quebec, Alberta, and British Columbia. Their real-time views on cap-rate movement, fit-out costs, and tenant demand patterns refined model inputs and flagged regional outliers that raw data alone could miss.
Desk Research
Mordor analysts began with Statistics Canada building-permit files, Bank of Canada policy releases, Canadian Real Estate Association MLS(R) summaries, and provincial land-registry transaction logs, which together ground volume, pricing, and pipeline signals. Trade bodies such as REALPAC, NAIOP Canada, and the Urban Land Institute supplied granular absorption, vacancy, and cap-rate benchmarks, while peer-reviewed work in the Journal of Property Investment & Finance helped us test discount-rate assumptions. Company disclosures, REIT filings, investor presentations, and news archives from Dow Jones Factiva and D&B Hoovers added issuer-level insight. These sources illustrate the wider pool consulted, and many additional outlets were reviewed to confirm figures and clarify anomalies.
Market-Sizing & Forecasting
The 2025 baseline is built with a top-down reconstruction of national investment volume, disaggregated by property type using penetration shares verified in expert calls, and then cross-checked against sampled deal sheets and average sale prices. Key variables, including the Bank of Canada overnight rate, quarterly construction-cost index, e-commerce share of retail sales, net immigration targets, and downtown office vacancy, feed a multivariate regression that extends forecasts to 2030. Scenario analysis adjusts for sudden monetary or cost shifts before totals are finalized.
Data Validation & Update Cycle
Outputs undergo three layers of review: provincial consistency checks, variance tests against independent indicators such as CMHC housing-start spillovers, and final sign-off by a senior analyst. Reports refresh annually, with interim updates triggered by material legislative or macroeconomic events, and every client delivery receives a fresh data sweep.
Why Mordor's Canada Commercial Real Estate Baseline Earns Unrivaled Trust
Published estimates often differ because firms choose dissimilar asset baskets, price series, and update rhythms. By anchoring its model to verifiable registry data and vetting assumptions in live market conversations, Mordor Intelligence provides a dependable midpoint that decision-makers can easily trace.
Benchmark comparison
| Market Size | Anonymized source | Primary gap driver |
|---|---|---|
| USD 83.22 B | Mordor Intelligence | |
| USD 82.94 B | Global Consultancy A | Includes multifamily rentals and student housing, inflating volume |
| USD 77.09 B | Regional Consultancy B | Excludes logistics assets under 50,000 sq ft and uses outdated exchange rates |
Once scope and currency differences are normalized, competing figures converge toward our baseline, underscoring that Mordor's transparent variables and yearly refresh cadence deliver the balanced, reproducible benchmark investors require.


Key Questions Answered in the Report
What is the current size of the Canada commercial real estate market and how fast is it growing?
The market is valued at USD 86.77 billion in 2026 and is forecast to expand at a 4.27% CAGR to reach USD 106.89 billion by 2031.
Which property type holds the largest market share today?
Offices lead the landscape with a 33.30% share of the 2025 Canada commercial real estate market, underpinned by a flight-to-quality toward amenity-rich, Class-A buildings.
What segment is expected to grow the quickest through 2031?
Logistics properties are projected to post the fastest growth, advancing at a 4.96% CAGR as e-commerce and near-shoring boost demand for urban distribution space.
Which province is the biggest contributor, and which is expanding the fastest?
Ontario tops the chart with 28.90% of market revenue in 2025, while Quebec is the pace-setter with a 4.95% CAGR driven by clean-energy advantages and near-shoring investments.
How are rising immigration targets influencing commercial real estate demand?
Annual inflows of nearly 500 000 new residents reinforce demand for mixed-use developments, neighborhood retail, and supporting logistics hubs, especially in Toronto, Vancouver, and Montreal.
What are the primary risks clouding near-term investment decisions?
Elevated debt costs and construction-price inflation—running at 3.5% year-over-year in Q1 2025—are squeezing development margins and delaying transactions until financing markets stabilize.
Page last updated on:


