
Colorectal Cancer Diagnostics And Therapeutics Market Size and Share
Market Overview
| Study Period | 2020 - 2031 |
|---|---|
| Market Size (2026) | USD 31.35 Billion |
| Market Size (2031) | USD 39.79 Billion |
| Growth Rate (2026 - 2031) | 4.89 % |
| Fastest Growing Market | Asia Pacific |
| Largest Market | North America |
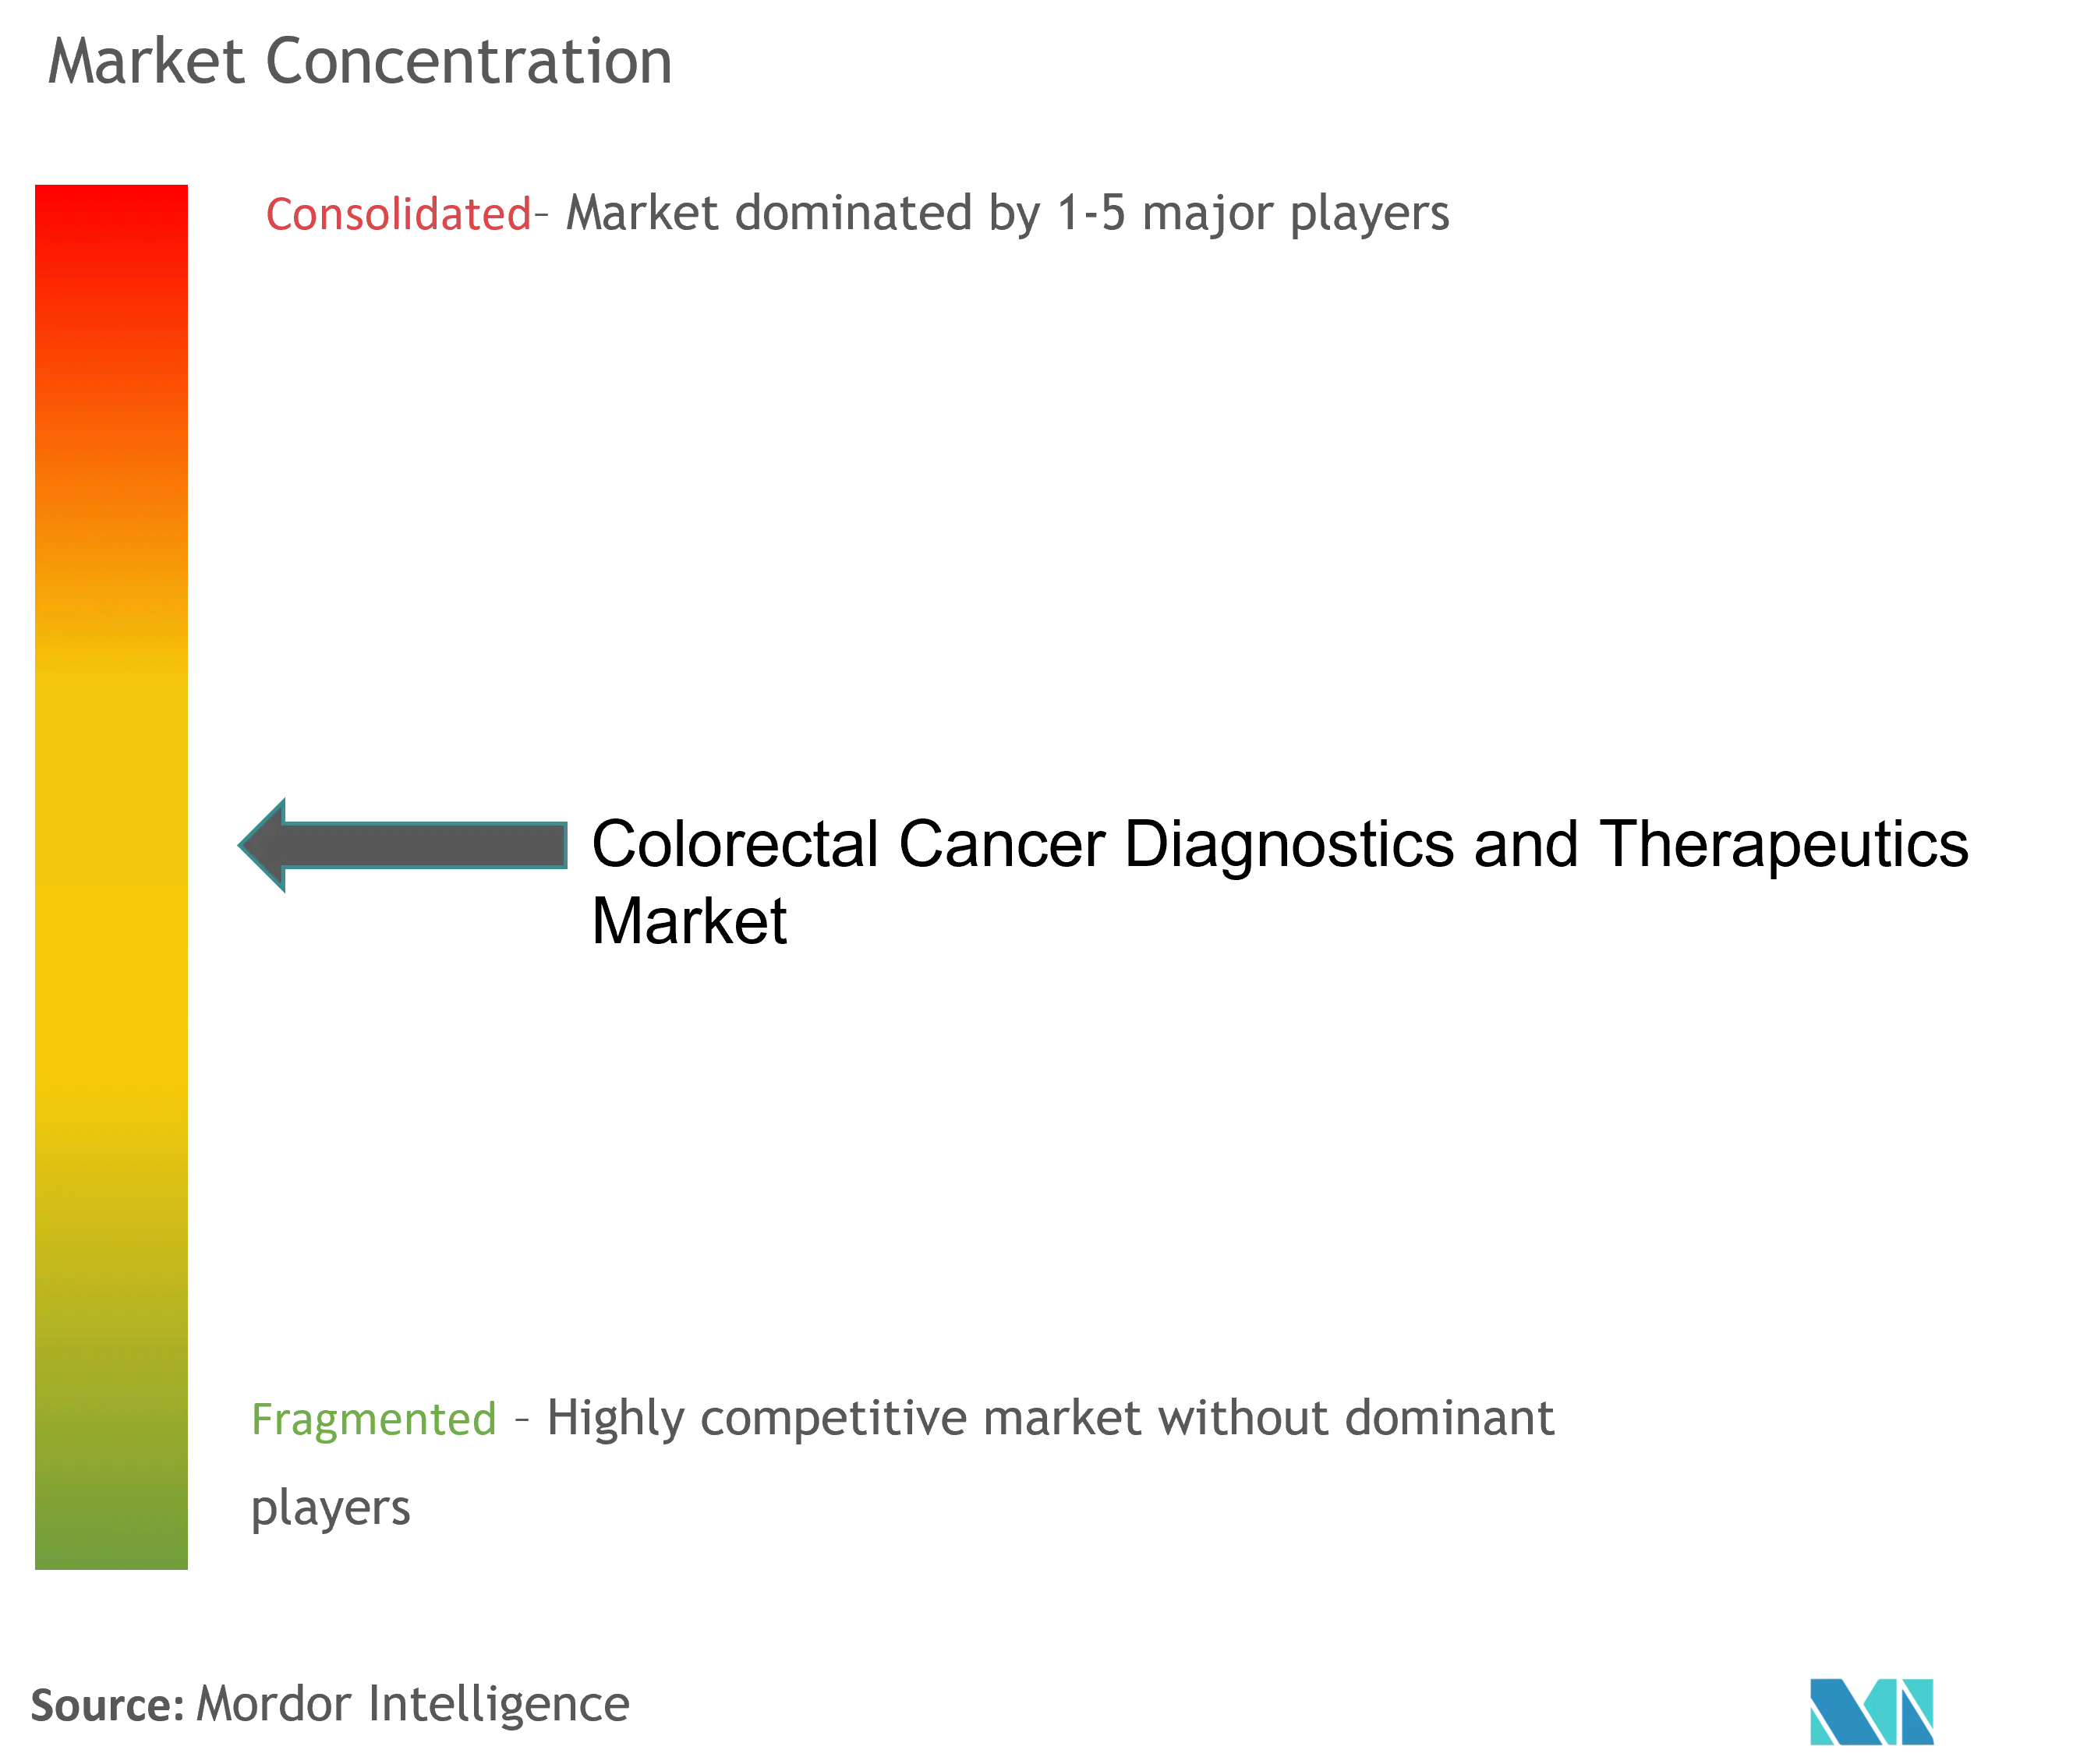
| Market Concentration | Medium |
Major Players *Disclaimer: Major Players sorted in no particular order Image © Mordor Intelligence. Reuse requires attribution under CC BY 4.0. | |
Colorectal Cancer Diagnostics And Therapeutics Market Analysis by Mordor Intelligence
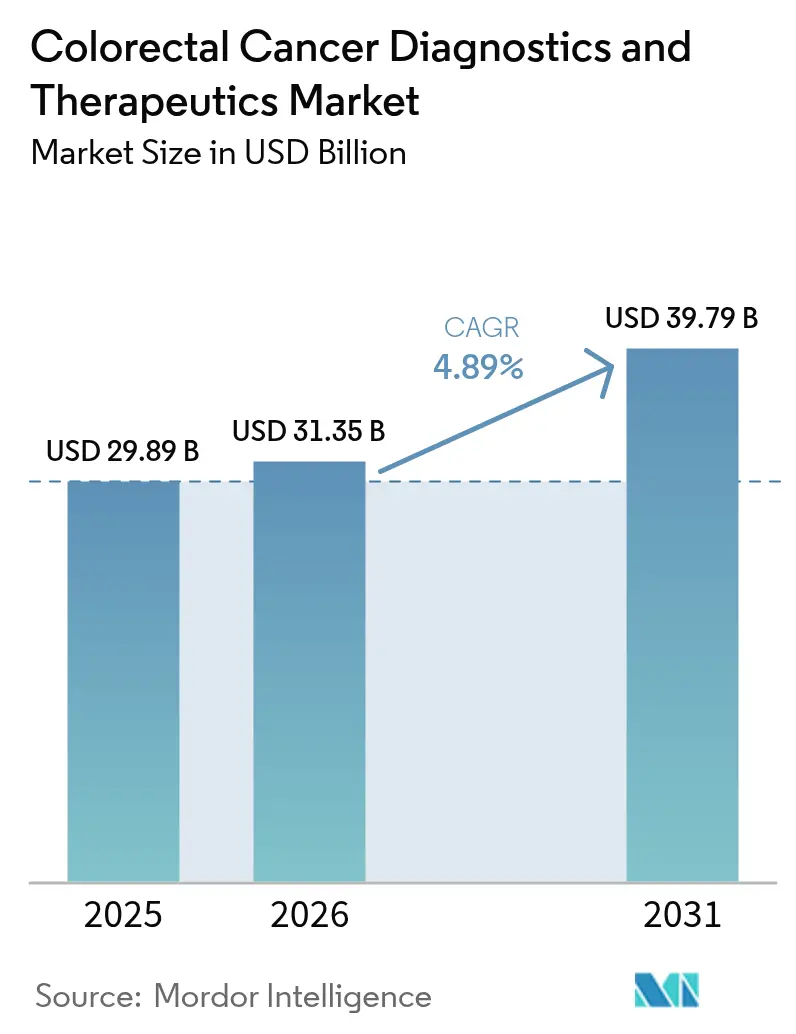
The colorectal cancer diagnostics and therapeutics market size was valued at USD 29.89 billion in 2025 and estimated to grow from USD 31.35 billion in 2026 to reach USD 39.79 billion by 2031, at a CAGR of 4.89% during the forecast period (2026-2031). The current expansion is paced by precision medicine, AI-enabled screening, and the steady roll-out of immunotherapy options that raise survival outcomes while sustaining premium pricing. Non-invasive tests—stool DNA, blood-based assays, and AI-assisted colonoscopy—bring previously unscreened populations into clinical pathways, while dual-checkpoint blockade reshapes first-line therapy for biomarker-defined patients. Reimbursement alignment in the United States and policy convergence in Europe accelerate uptake, and Asia Pacific leapfrogs legacy bottlenecks through government-funded technology programs. Cost pressures and capacity constraints persist, yet the colorectal cancer diagnostics and therapeutics market continues to monetize innovation faster than screening volumes plateau in mature economies.
Key Report Takeaways
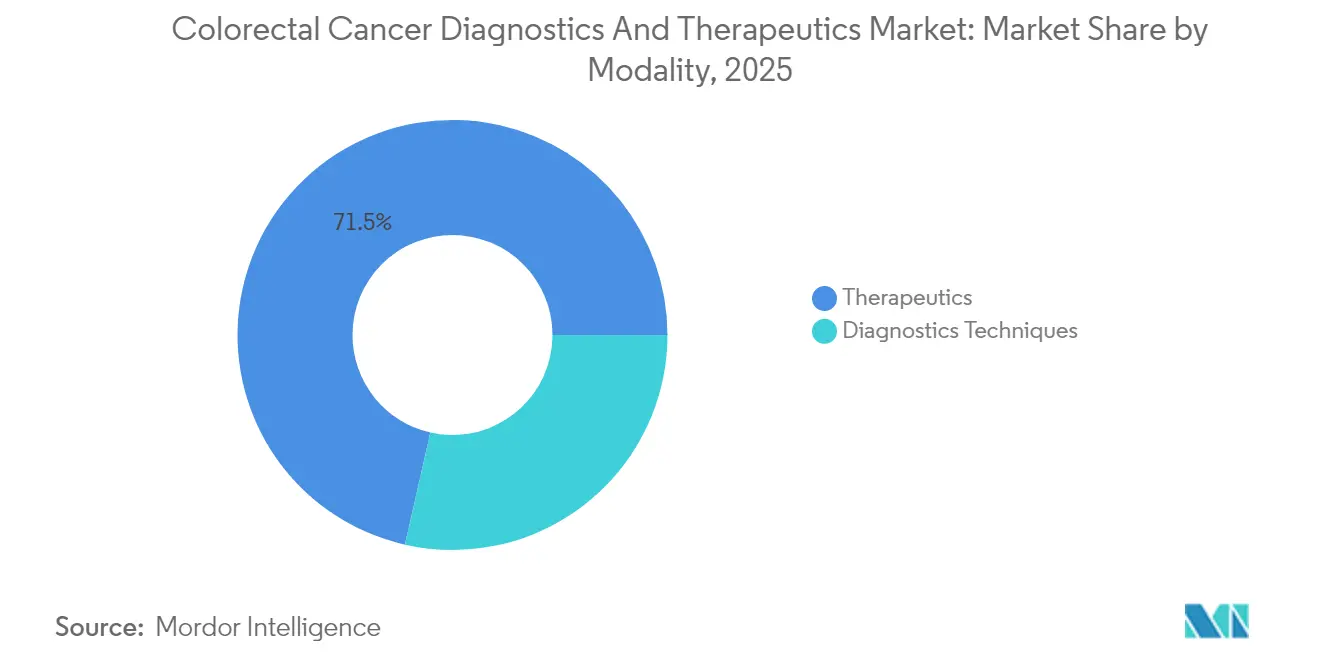
- By modality, diagnostics techniques held 28.55% of colorectal cancer diagnostics and therapeutics market share in 2025, while therapeutics are on track to post the fastest 13.33% CAGR through 2031.
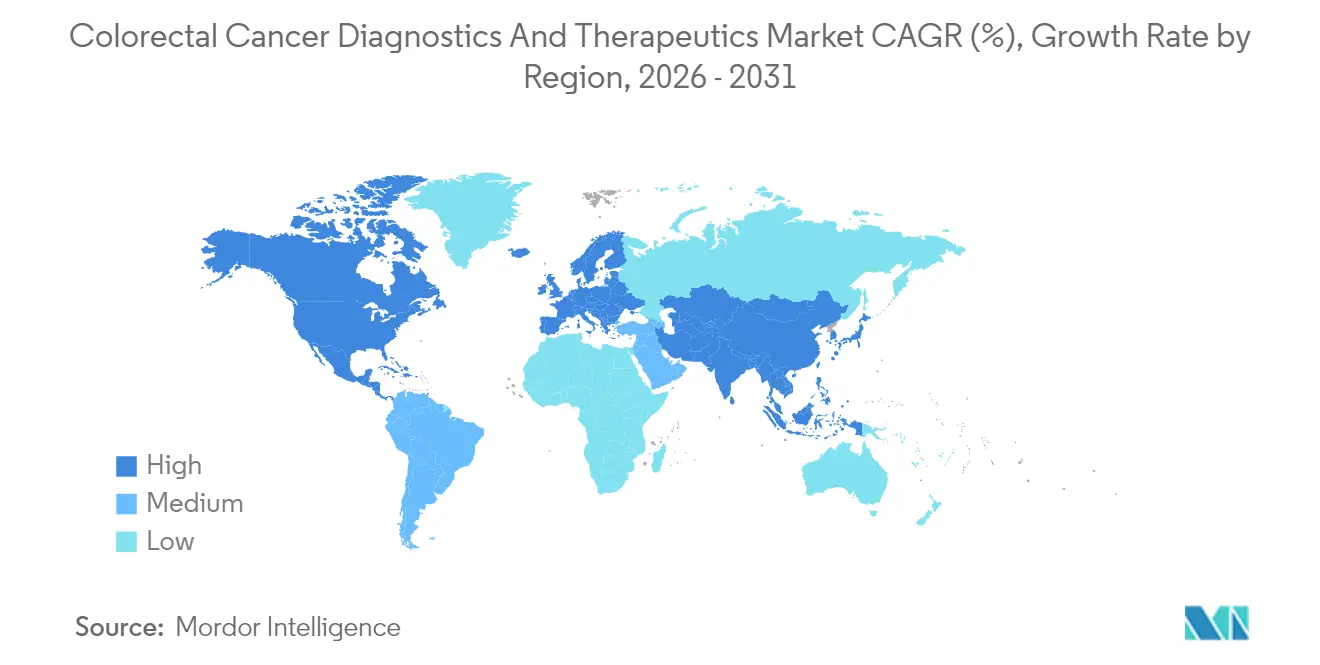
- By geography, North America led with 34.00% revenue share in 2025, whereas Asia Pacific is projected to grow at a 7.62% CAGR through 2031.
Note: Market size and forecast figures in this report are generated using Mordor Intelligence’s proprietary estimation framework, updated with the latest available data and insights as of 2026.
Market Trends and Insights
Drivers Impact Analysis of Colorectal Cancer Diagnostics And Therapeutics Market*
| Driver | (~) % Impact on CAGR Forecast | Geographic Relevance | Impact Timeline |
|---|---|---|---|
| Rising Incidence and Prevalence Of Colorectal Cancer | +1.20% | Global, with highest impact in APAC and MEA | Long term (≥ 4 years) |
| Rapid Adoption Of Next-Generation Stool-DNA And Blood-Based Screening Tests | +0.80% | North America & EU, expanding to APAC | Medium term (2-4 years) |
| Technological Leaps In Targeted Therapies & Immunotherapy Pipelines | +1.10% | Global, led by North America and Europe | Medium term (2-4 years) |
| Expansion Of Guideline-Based Screening To 45-Year-Olds In Key Markets | +0.60% | North America, Europe, select APAC countries | Short term (≤ 2 years) |
| Molecular Residual-Disease (MRD) Tests Reshaping Adjuvant-Therapy Decisions | +0.40% | North America, Europe, premium APAC markets | Long term (≥ 4 years) |
| Value-Based Reimbursement That Rewards Early Detection | +0.30% | North America, select European markets | Medium term (2-4 years) |
| Source: Mordor Intelligence | |||
Rising Incidence of Colorectal Cancer
Early-onset incidence climbed from 5.43 to 6.13 per 100,000 between 1990 and 2021, and modeling signals continued acceleration through 2030.[1] High-income settings see lifestyle convergence that elevates risk at younger ages, while Asia Pacific records incidence rates of 7.51 per 100,000 for males and 6.22 for females. Longer survivorship boosts lifetime screening and follow-up demand, anchoring sustained revenue visibility in the colorectal cancer diagnostics and therapeutics market.
Rapid Adoption of Next-Generation Stool-DNA and Blood-Based Screening Tests
FDA approvals for Shield (83.1% sensitivity), Cologuard Plus (93.9%), and ColoSense (94.4%) in 2024 expanded the non-invasive testing toolkit.[2] These modalities address the 40% of eligible adults who have historically skipped colonoscopy, potentially adding 15–20 million U.S. lives to the annual screening pool. Investor confidence solidified with Geneoscopy’s USD 105 million Series C round in January 2025.
Technological Leaps in Targeted Therapies and Immunotherapy Pipelines
KRAS G12C inhibitor combinations cleared in 2024–2025, unlocked options for 40% of mutation-positive tumors, while dual-checkpoint blockade (Opdivo + Yervoy) delivered median progression-free survival not yet reached versus 39.3 months for monotherapy in MSI-H disease.[3] Companion diagnostics are now embedded in prescribing workflows, elevating demand for biomarker assays within the colorectal cancer diagnostics and therapeutics market.
Expansion of Guideline-Based Screening to 45-Year-Olds in Key Markets
Medicare’s 2025 adoption and private-payer alignment opened screening eligibility to 19 million additional Americans, improving cost-per-QALY ratios across risk cohorts. The Netherlands and Denmark mirrored the policy, underscoring trans-Atlantic momentum for earlier detection.
Restraints Impact Analysis of Colorectal Cancer Diagnostics And Therapeutics Market*
| Restraint | (~) % Impact on CAGR Forecast | Geographic Relevance | Impact Timeline |
|---|---|---|---|
| High Drug Cost & Treatment-Related Toxicities | -0.70% | Global, most severe in emerging markets | Medium term (2-4 years) |
| Sub-Optimal Screening Adherence In Low-Resource Settings | -0.50% | APAC, MEA, Latin America | Long term (≥ 4 years) |
| Limited Immunotherapy Efficacy In MSS Tumors Causing High Trial Attrition | -0.40% | Global, particularly North America and Europe | Medium term (2-4 years) |
| Data-Integration & Privacy Hurdles For AI-Driven Diagnostics Platforms | -0.30% | North America, Europe, select APAC markets | Short term (≤ 2 years) |
| Source: Mordor Intelligence | |||
High Drug Cost and Treatment-Related Toxicities
Targeted therapy regimens average USD 150,000–200,000 per year, a burden that curtails uptake where out-of-pocket spending exceeds 60% of total healthcare costs. Combination immunotherapy requires intensive safety monitoring as grade 3/4 adverse events can reach 81%, stretching oncology budgets and care infrastructure in the colorectal cancer diagnostics and therapeutics industry.
Sub-Optimal Screening Adherence in Low-Resource Settings
Screening rates range from 75% in Denmark to 6.3% in countries lacking organized programs. In Saudi Arabia, 62% of eligible individuals have never been screened, mainly due to colonoscopy anxiety and limited geographic access. These gaps translate into late-stage presentations that raise mortality and dampen growth prospects for the colorectal cancer diagnostics and therapeutics market.
*Our forecasts treat driver/restraint impacts as directional, not additive. The impact forecasts reflect baseline growth, mix effects, and variable interactions.
Colorectal Cancer Diagnostics And Therapeutics Market Segment Analysis
By Modality:
Therapeutics Drive Growth Despite Diagnostics DominanceTherapeutics generated strong tailwinds, posting a 13.33% CAGR that outpaced screening activity. Opdivo + Yervoy secured first-line status for MSI-H/dMMR disease and reset revenue expectations at premium price points. KRAS, EGFR, and HER2 targets widen addressable pools, boosting the colorectal cancer diagnostics and therapeutics market size for personalized regimens. Diagnostics retained 28.55% of colorectal cancer diagnostics and therapeutics market share in 2025, underwritten by multitarget stool DNA, blood biomarkers, and AI colonoscopy that make screening more convenient. Medtronic’s GI Genius raised adenoma detection by 14.4% and secured a three-year VA contract for nearly 100 additional units. Shield and ColoSense advanced blood and RNA-based testing, yet payers still calibrate coverage for their higher per-test costs.
Diagnostics monetization pivots from volume to diversification. Exact Sciences rolled out Cologuard Plus with 93.9% sensitivity, reducing false positives and reinforcing its leadership. Blood-based assays grow fast among younger cohorts who prefer needle sticks to invasive scopes, an alignment that improves adherence. Molecular residual-disease tests extend value across the treatment continuum by flagging minimal disease after surgery, further enlarging colorectal cancer diagnostics and therapeutics market size opportunities through follow-up testing.

Geography Analysis
North America Colorectal Cancer Diagnostics and Therapeutics Market
North America’s leadership is anchored in reimbursement breadth and innovation velocity. Medicare coverage for CT colonography in 2025 removes a procedural cost hurdle, complementing blood and stool tests already reimbursed under preventive codes. Sixty percent of colorectal cancer drug trials run in U.S. and Canadian centers, accelerating FDA clearances that ripple worldwide. VA deployment of 100 GI Genius units underscores institutional migration to AI diagnostics. Regulatory pathways such as Breakthrough Device and Priority Review condense timelines, yet rising scrutiny on therapy cost inflates time-to-profit hurdles for recent launches.
APAC Colorectal Cancer Diagnostics and Therapeutics Market
Asia Pacific outruns all regions at 7.62% CAGR. Government programs extend screening to rural China and subsidize AI colonoscopy in Japan, helping technology leapfrog traditional bottlenecks. Incidence rates of 7.51 per 100,000 for males and 6.22 for females press policymakers to act. Manufacturing clusters reduce equipment costs while medical tourism funnels regional patients to technology hubs in Thailand and India, amplifying demand inside the colorectal cancer diagnostics and therapeutics market.
EMEA Colorectal Cancer Diagnostics and Therapeutics Market
Europe’s trajectory is stable, fueled by well-established national programs. Utilization still varies: 75% in Denmark yet under 10% in lower-income members. EMA centralized approvals elongate pipeline timelines compared with the FDA; however, once clearance is granted, reimbursement coverage through universal systems leads to rapid penetration. Middle East & Africa promise future upside, especially in GCC states where oil revenues finance cancer centers equipped with AI imaging and immunotherapies.
Regulatory Landscape
Regulatory oversight for colorectal cancer diagnostics and therapeutics cuts across drug, device, and drug-device combination frameworks, with classification tied to Primary Mode of Action (PMOA) to determine the lead review center (CDER/CBER/CDRH) and the corresponding premarket pathway. In the United States, drug-device combination products must meet combination-product cGMP requirements under 21 CFR Part 4, which creates dual compliance across pharmaceutical GMP and device quality controls. It also tightens expectations around design controls, complaint handling, and postmarket reporting for integrated offerings.
Recent regulatory actions have increased compliance specificity for combination products and oncology combinations. In June 2025, the FDA published draft guidance clarifying Unique Device Identifier (UDI) expectations for combination products, which affects labeling and traceability for device constituent parts used alongside therapeutics and companion diagnostics. In February 2026, the FDA moved device quality compliance toward ISO 13485:2016 alignment through implementation of the Quality Management System Regulation (QMSR), impacting manufacturers of AI-enabled endoscopy systems, pathology viewers, and companion-diagnostic platforms that connect to colorectal cancer treatment pathways. In Europe, combination oversight is supported by EMA and EU-level coordination initiatives, including the European Commission relaunching the COMBINE Project 1 pilot phase in June 2026 to facilitate coordinated assessment for combined clinical trials across Member States.
Competitive Landscape
Competitive intensity is moderate. Exact Sciences, Guardant Health, and Bristol Myers Squibb collectively represented more than 42% of the 2024 revenue within the colorectal cancer diagnostics and therapeutics market size. Exact Sciences grew Q1 2025 revenue to USD 707 million with 14% Cologuard volume growth. Guardant Health’s Shield blood test challenges stool DNA incumbency, targeting non-compliant patients with an 83.1% sensitivity profile.
On the therapy side, Bristol Myers Squibb extended its immuno-oncology franchise with dual-checkpoint blockade that reduces progression risk by 79% over chemotherapy. Johnson & Johnson’s RYBREVANT program addresses EGFR-driven disease and posted a 49% overall response in RAS/BRAF wild-type tumors. Medtronic leverages AI differentiation, with GI Genius cutting missed polyp rates by 50% in clinical practice and winning VA expansion awards.
Emerging entrants focus on molecular residual disease, multiomics, and digital pathology. Tagomics secured GBP 860,000 Innovate UK funding to validate an epigenetic panel, while PathPresenter earned FDA 510(k) clearance for a cloud viewer that streamlines pathology workflows. M&A remains active as Merck completed Prometheus Biosciences to strengthen precision-medicine pipelines in colorectal indications. The field favors firms that integrate diagnostics and therapeutics under single commercialization umbrellas.
Colorectal Cancer Diagnostics And Therapeutics Industry Leaders
-
Epigenomics AG
-
Abbott Laboratories
-
F. Hoffmann-La Roche AG
-
Novigenix SA
-
Amgen Inc
- *Disclaimer: Major Players sorted in no particular order
Colorectal Cancer Diagnostics And Therapeutics Market Companies Covered in this Report
- Abbott Laboratories
- Amgen
- Roche
- Exact Sciences Corp.
- Quest Diagnostics
- Labcorp Holdings Inc.
- Siemens Healthineers
- Guardant Health
- Medtronic plc (GI Genius)
- Merck
- Bristol-Myers Squibb
- Sanofi
- Bayer
- Pfizer
- Johnson & Johnson
- BGI Genomics Co. Ltd.
- Epigenomics
- VolitionRx Ltd.
- Clinical Genomics Technologies
- EDP Biotech Corp.
- Novigenix
- Taiho Pharmaceutical Co.
- Regeneron Pharmaceuticals
- Eli Lilly and Company
- Onyx/Biotechne (example mCRC assets)
Read Analysis of Colorectal Cancer Diagnostics And Therapeutics Companies
Market Opportunities and Future Outlook
Precision-oncology workflows that link therapy selection to biomarker identification keep creating commercial whitespace across reflex testing, companion diagnostics, and lab-to-clinic data integration. A specific 2026 catalyst is the expansion of the BRAF V600E treatment and testing ecosystem: Pfizer received FDA full approval in February 2026 for the BRAFTOVI (encorafenib) combination regimen for BRAF V600E-mutant metastatic colorectal cancer, and in January 2026 the FDA approved Guardant360 CDx as a companion diagnostic for that regimen. Together, these actions support demand for standardized, rapid molecular profiling in newly diagnosed metastatic patients and encourage investment in scalable testing capacity across ctDNA, tissue NGS, and automated IHC/MMR pathways.
Screening and earlier interception are the second major opportunity area, especially where non-invasive testing can improve adherence for populations that avoid colonoscopy. Company activity in 2026 reflects this shift, including Freenome reporting in July 2026 that its updated SimpleScreen CRC blood-based screening test met primary and secondary endpoints in a pivotal clinical validation study, aligning with a broader move toward blood-based screening alongside established stool-based DNA testing. At the same time, emerging MRD/ctDNA-guided treatment strategies carry both promise and execution risk: results reported in 2026 from the ALTAIR study within the CIRCULATE-Japan platform indicated no significant disease-free survival improvement with post-adjuvant intervention using trifluridine/tipiracil in ctDNA-positive patients. The outcome highlights how differentiation in MRD offerings depends on clearer actionability, therapy linkage, and evidence generation beyond monitoring alone.
Recent Industry Developments in Colorectal Cancer Diagnostics And Therapeutics Market
- June 2026: Roche reported that the VENTANA MMR RxDx Panel received EU IVDR approval for label expansions supporting identification of mismatch repair status across multiple cancers, including metastatic colorectal cancer. The update strengthens access to standardized MMR testing in Europe and supports broader companion-diagnostic deployment tied to immunotherapy decision pathways.
- March 2026: Abbott completed the acquisition of Exact Sciences, adding major colorectal cancer screening and oncology testing assets including the Cologuard franchise and related molecular diagnostics. The combination consolidates scale across non-invasive screening, MRD-adjacent offerings, and commercial infrastructure, increasing competitive pressure on standalone diagnostics players.
- April 2024: The FDA expanded the non-invasive screening toolkit with additional approvals referenced in its colorectal cancer screening test listings, including newer blood-based and stool-based options such as Shield and next-generation stool DNA tests. The broader menu of authorized tests supports payer and provider pathway diversification beyond colonoscopy and increases the addressable pool among historically non-compliant screening populations.
Colorectal Cancer Diagnostics And Therapeutics Market Report Scope and Research Methodology
Market Definition and Coverage
This market captures revenue linked to diagnosing colorectal cancer and treating it, including commonly used testing approaches and drug based therapy use across major care settings.
Scope exclusions: We exclude general hospital services and broad oncology supportive care costs that are not directly tied to a colorectal cancer diagnostic test or a defined therapeutic regimen.
Segments Covered in This Report
- By Modality
- Diagnostics Techniques
- Stool-Based Tests
- Fecal Immunochemical Test (FIT)
- guaiac-FOBT
- Multi-target Stool-DNA (mt-sDNA)
- Blood-Based Biomarker Tests
- ctDNA assays
- Epigenetic methylation panels
- Endoscopy-Based Imaging
- Colonoscopy
- AI-assisted Colonoscopy
- Flexible Sigmoidoscopy
- Radiology & Molecular Endoscopy
- Histopathology / Digital Pathology
- Stool-Based Tests
- Therapeutics
- Chemotherapy
- Fluoropyrimidines (5-FU, Capecitabine)
- Oxaliplatin-based regimens (FOLFOX)
- Irinotecan-based regimens (FOLFIRI)
- Targeted Therapy
- Anti-EGFR (Cetuximab, Panitumumab)
- Anti-VEGF (Bevacizumab, Aflibercept)
- BRAF / HER2 / KRAS G12C inhibitors
- Immunotherapy
- PD-1 / PD-L1 inhibitors
- CTLA-4 combos
- CAR-T / Oncolytic Viruses
- Other Therapeutics (Radioembolization, Vaccines)
- Chemotherapy
- Diagnostics Techniques
- Geography
- North America
- United States
- Canada
- Mexico
- Europe
- Germany
- United Kingdom
- France
- Italy
- Spain
- Rest of Europe
- Asia Pacific
- China
- Japan
- India
- South Korea
- Australia
- Rest of Asia Pacific
- Middle East & Africa
- GCC
- South Africa
- Rest of Middle East & Africa
- South America
- Brazil
- Argentina
- Rest of South America
- North America
Data Sources, Market Sizing, and Validation
Desk Research
Desk work starts by mapping the care pathway so the same patient is not counted twice across screening, diagnosis confirmation, and treatment. We used public sources such as WHO and IARC cancer statistics, CDC screening guidance and surveillance tables, NIH and NCI publications, peer-reviewed oncology journals, and treatment guideline summaries from large clinical bodies, which helps us anchor incidence, screening uptake, and therapy patterns.
On the commercial side, company filings, investor presentations, and reputable press were reviewed to understand product mix direction, geography exposure, and price movement narratives. We also used paid subscriptions for company financials and intelligence, patent databases, and an import and export shipment level database, mainly to cross-check product presence and timing, not to replace the core model logic. These desk research sources are illustrative only, and many other public datasets and documents were also reviewed for data collection, validation, and clarification.
Primary Interviews and Surveys
Primary work was used to pressure test model assumptions around diagnostic sequencing, adoption of non-invasive tests, and treatment duration patterns across patient lines of therapy. We spoke with a mix of clinical stakeholders, laboratory and diagnostic channel participants, and commercial leaders to confirm utilization and pricing behavior, and to understand how guideline and reimbursement changes show up in day-to-day purchasing decisions across regions.
Distribution of primary research fieldwork respondents
| Company type | Respondent position | Region |
|---|---|---|
| Top tier: 33% | CXOs: 19% | APAC: 50% |
| Mid tier: 48% | Functional/Unit leaders: 28% | EMEA: 31% |
| Smaller Players: 19% | Managers: 53% | Americas: 19% |
Market-Sizing & Forecasting
Sizing begins with a top-down demand pool build that links colorectal cancer incidence, the eligible screened population, and treated patient counts to the expected mix of testing and therapy use. After that structure is set, we check outputs with selective bottom-up approximations such as sampled test and drug ASPs multiplied by volume signals, then adjust where the two views do not align.
Key inputs that shape the model include screening participation rates by age band, colonoscopy capacity and procedure volumes, share of stool-based and biomarker-based testing, stage distribution at diagnosis, line of therapy mix (for example, chemo versus immunotherapy or targeted therapy), and duration of treatment by regimen. Where country level data is thin, we handle gaps by using region level clinical practice patterns and reimbursement signals from interviews, followed by conservative normalization so outlier countries do not distort the total.
For forecasting, we rely on scenario analysis supported by expert views on how guideline shifts, new biomarker adoption, and pricing pressure typically play out over the next few years. This approach also keeps the forecast traceable, since each change in market value can be traced to a small set of measurable drivers.
Data Validation & Update Cycle
Outputs are triangulated against independent signals such as procedure volumes, screening program reach, and the implied treated patient pool so the numbers stay realistic by region. Variance checks are run for unusual jumps in price, mix, or utilization, and assumptions are reviewed in more than one analyst pass before sign off.
When a major policy update, reimbursement change, or meaningful therapy shift is observed, respondents are re-contacted and the driver set is refreshed to prevent stale inputs from carrying forward. Reports are refreshed annually, and before delivery there is a final update sweep so clients receive the most current view available.
Mordor Intelligence's Colorectal Cancer Diagnostics and Therapeutics Market Size Measured Against Other Published Estimates
Published market values for colorectal cancer diagnostics and therapeutics can differ even when the topic label looks the same, because teams often build the demand pool differently and apply different timing, pricing, and treatment mix assumptions.
The largest gaps usually come from what is counted inside diagnostics versus general oncology testing, whether therapy value includes supportive care and surgery spending, and how fast the model assumes newer biomarker guided treatment expands. Currency conversion timing and the refresh cadence also matter, since a single year shift in procedure volumes or therapy mix can move the total by a noticeable amount.
Benchmark comparison
| Source | Market Size | Gaps in Research Methodology |
|---|---|---|
| Mordor Intelligence | USD 31.35 B (2026) | |
| Industry Publisher A | USD 28.61 B (2025) | Uses an earlier base year and a longer horizon, and it typically blends surgery and radiation with drug therapy value, which can shift totals depending on what is treated as therapeutics revenue. |
| Healthcare Analyst Group B | USD 35.15 B (2025) | Applies a faster growth path and a broader therapy basket, and it can also carry forward higher implied prices without matching them back to procedure and treated patient constraints. |
The spread in the table is mainly explained by therapy basket breadth and the year chosen for the starting point, which then affects how pricing and uptake are rolled forward. By tying test volumes and treated patient checks to the model before pricing is expanded, the estimate stays closer to repeatable care pathway logic, which is how the total is kept consistent in Mordor Intelligence.
Key Questions Answered in the Report
How large is the colorectal cancer diagnostics and therapeutics market in 2026?
The market is valued at USD 31.35 billion in 2026 and is set to reach USD 39.79 billion by 2031 at a 4.89% CAGR.
Which segment is growing fastest?
Therapeutics lead growth with a 13.33% CAGR through 2031, propelled by immunotherapy and targeted small-molecule approvals.
What share does North America hold?
North America accounts for 34.00% of global revenue, a position supported by broad reimbursement and high innovation density.
Why is Asia Pacific expanding quickly?
Government-funded screening programs, AI-enabled colonoscopy adoption, and cost-efficient manufacturing drive a 7.62% CAGR in Asia Pacific.
What are the main cost challenges?
Targeted therapy courses average USD 150,000–200,000 annually and carry high toxicity management costs that strain emerging-market budgets.