Clinical Workflow Solutions Market Size and Share
Market Overview
| Study Period | 2020 - 2031 |
|---|---|
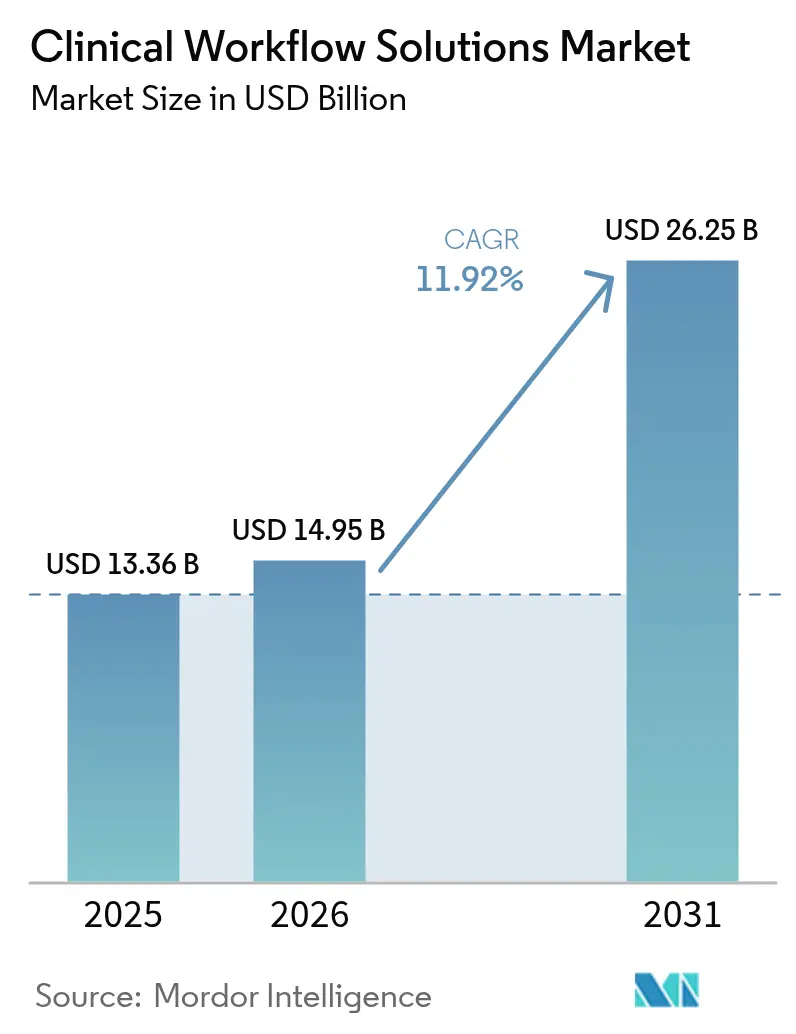
| Market Size (2026) | USD 14.95 Billion |
| Market Size (2031) | USD 26.25 Billion |
| Growth Rate (2026 - 2031) | 11.92% CAGR |
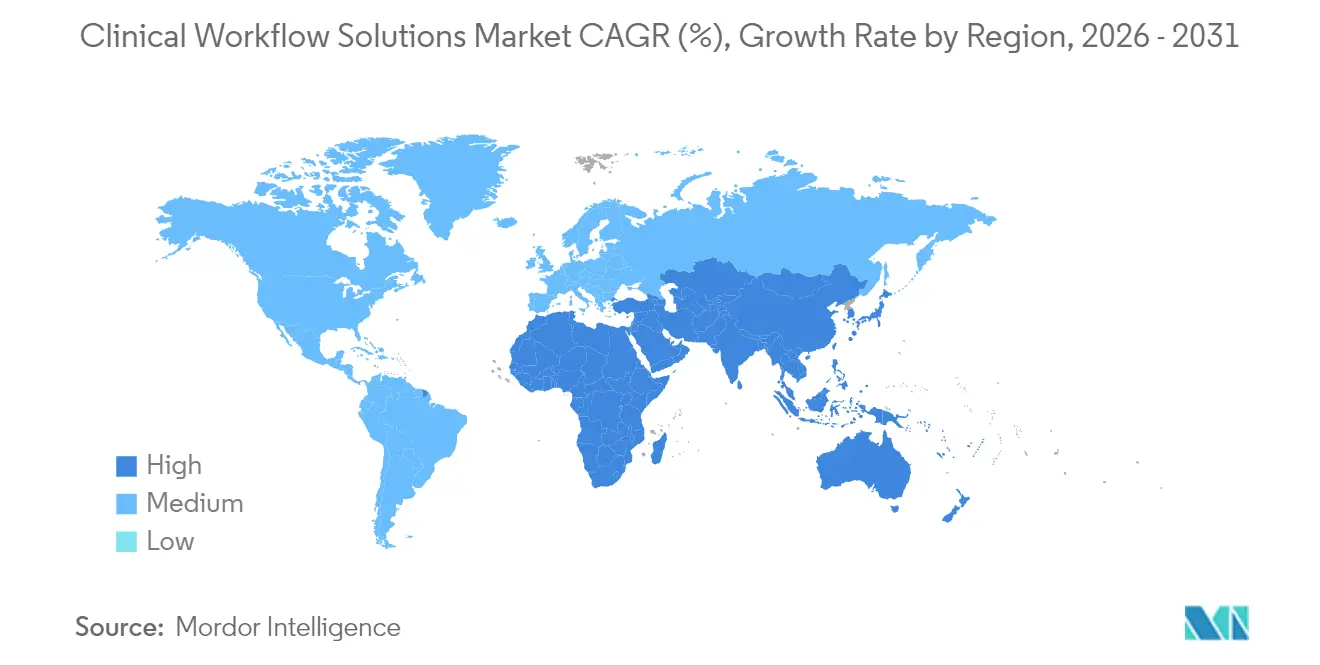
| Fastest Growing Market | Asia-Pacific |
| Largest Market | North America |
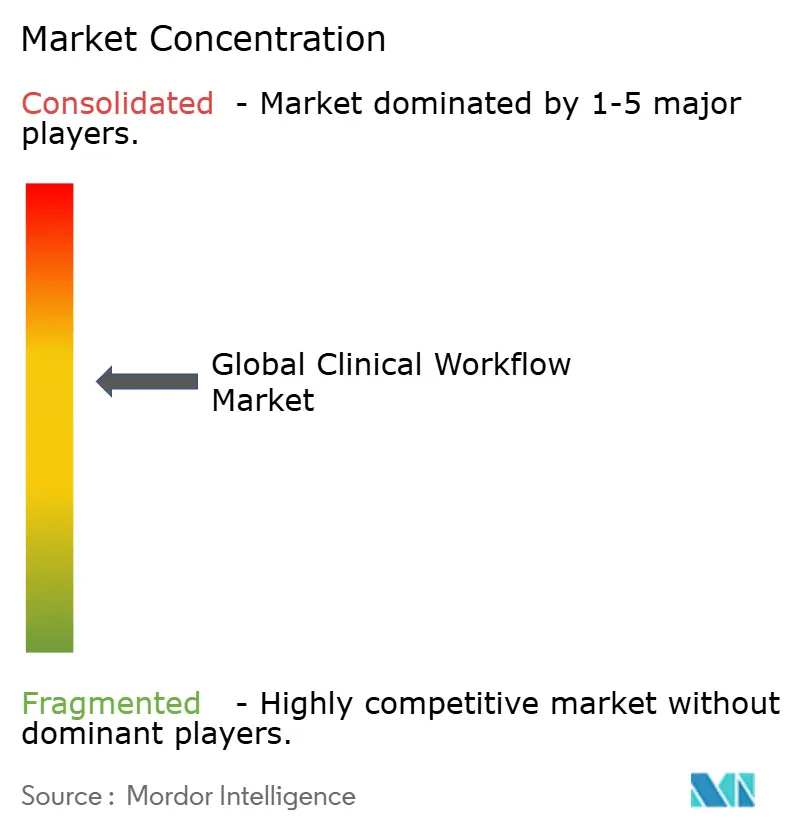
| Market Concentration | Medium |
Major Players *Disclaimer: Major Players sorted in no particular order Image © Mordor Intelligence. Reuse requires attribution under CC BY 4.0. | |
Clinical Workflow Solutions Market Analysis by Mordor Intelligence
The clinical workflow solutions market size was valued at USD 13.36 billion in 2025 and estimated to grow from USD 14.95 billion in 2026 to reach USD 26.25 billion by 2031, at a CAGR of 11.92% during the forecast period (2026-2031). Rising operating costs, tighter staffing pools and the march toward value-based reimbursement are encouraging providers to automate repetitive tasks and connect data silos. Cloud-friendly platforms and mandated interoperability standards are reshaping buying priorities, nudging hospitals to shift budgets from maintaining legacy code toward subscription-style services that promise continual upgrades. Large vendors are broadening portfolios through acquisitions and partnerships, while younger specialists are capturing attention with niche tools that solve workflow pain points for specific departments. Regional spending patterns hint that North America will keep its lead for now. Yet, the faster investment pace in Asia-Pacific suggests the competitive gap could narrow before the end of the forecast window.
Key Report Takeaways
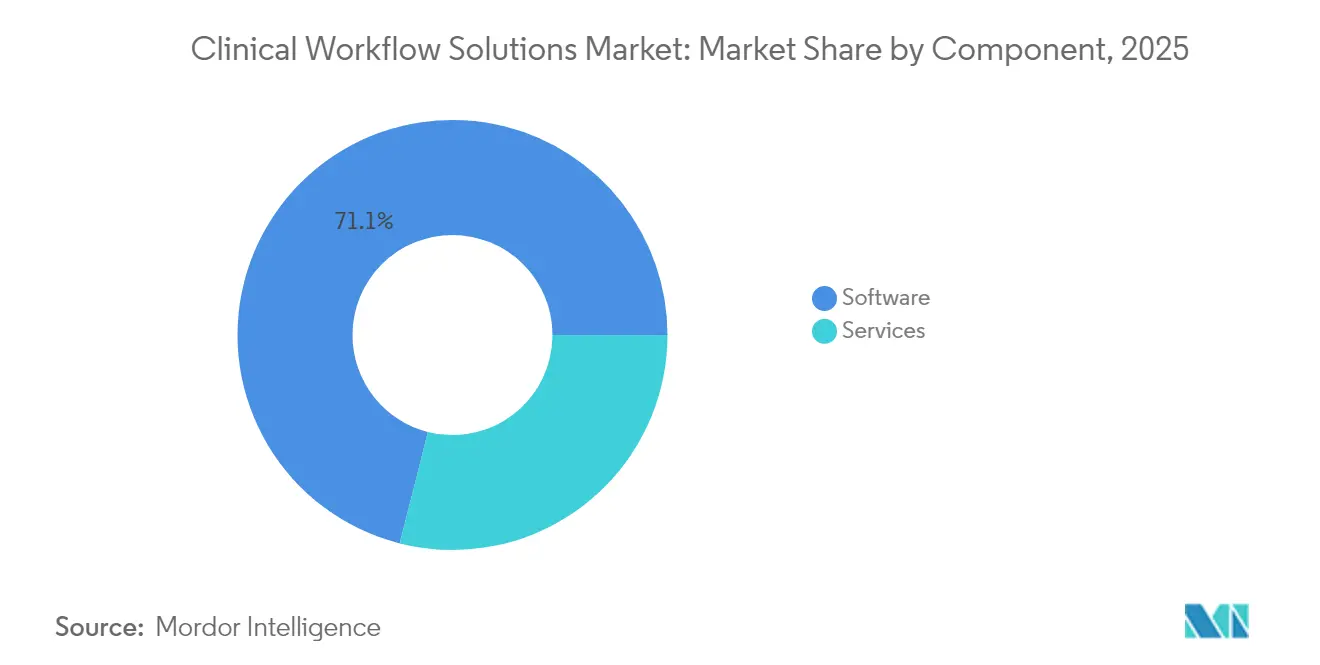
- By component, software commanded 71.05% of 2025 revenue, while services are projected to expand at a 14.18% CAGR to 2031.
- By product type, data integration solutions contributed 30.10% of the market size in 2025; care collaboration solutions are expected to advance at a 14.75% CAGR over the forecast period.
- By delivery mode, on-premise deployments represented 62.25% of 2025 sales, yet cloud-based offerings are forecast to rise at a 15.10% CAGR through 2031.
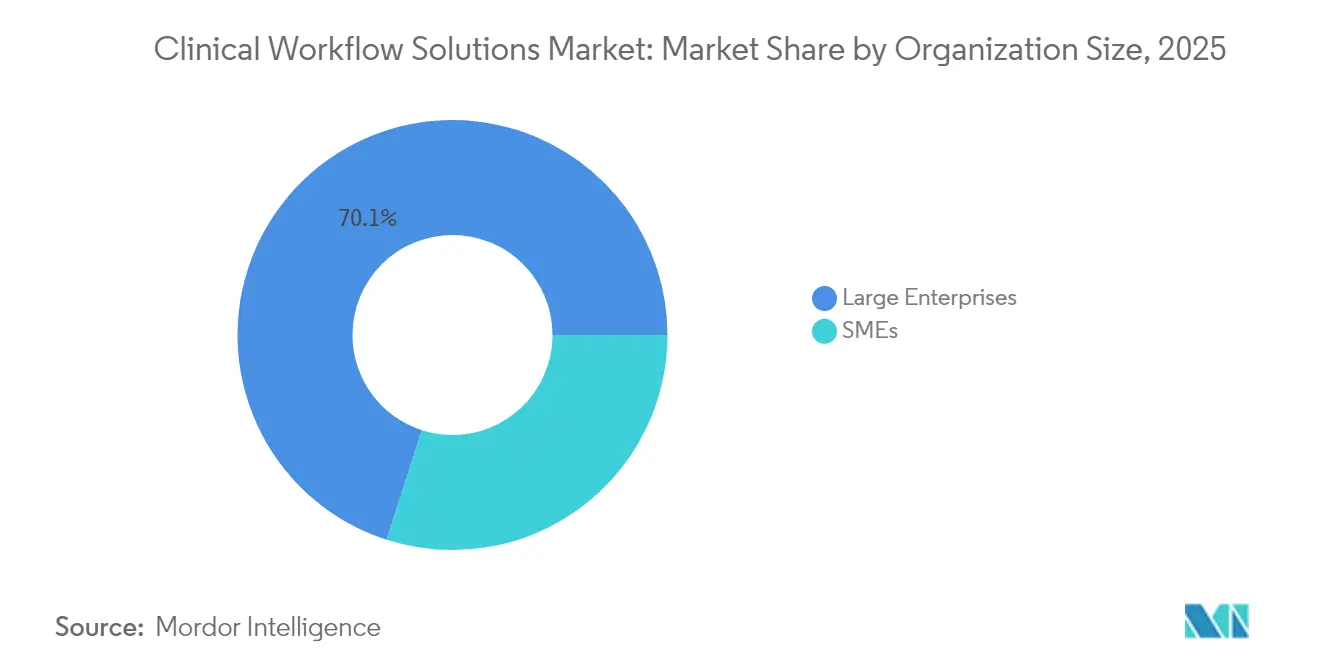
- By organization size, large enterprises accounted for 70.05% of revenue in 2025, whereas small and mid-sized organizations are poised for a 13.62% CAGR.
- By end-user, hospitals made up 67.90 % of the 2025 market, while other care settings are on course for a 13.45 % CAGR to 2031.
- By geography, North America held a 43.60% revenue share in 2025, whereas Asia-Pacific is set to grow the fastest at a 13.12% CAGR through 2031.
Note: Market size and forecast figures in this report are generated using Mordor Intelligence’s proprietary estimation framework, updated with the latest available data and insights as of 2026.
Global Clinical Workflow Solutions Market Trends and Insights
Drivers Impact Analysis*
| Driver | (~) % Impact on CAGR Forecast | Geographic Relevance | Impact Timeline |
|---|---|---|---|
| Mandated Global Interoperability Standards (HL7 FHIR, ISO/IEEE) Accelerating Adoption | +2.1% | Global, with early adoption in North America and Europe | Medium term (2-4 years) |
| Escalating Worldwide Healthcare Workforce Shortages Prompting Automation | +1.8% | Global, most acute in North America and Europe | Short term (≤ 2 years) |
| Shift to Value-Based Care Requiring End-to-End Workflow Visibility | +1.5% | North America, with gradual adoption in Europe and Asia-Pacific | Medium term (2-4 years) |
| Proliferation of Connected Medical Devices Generating Real-Time Data Streams | +1.3% | Global, with the highest impact in developed healthcare markets | Medium term (2-4 years) |
| Rapid Uptake of Cloud-Native Hospital Information Systems Enabling SaaS Deployment | +1.2% | North America and Europe, with growing adoption in Asia-Pacific | Medium term (2-4 years) |
| Pandemic-Driven Demand for Remote Clinical Collaboration & Command Centers | +1.0% | Global | Short term (≤ 2 years) |
| Source: Mordor Intelligence | |||
Mandated Global Interoperability Standards Accelerating Adoption
Health-level Seven Fast Healthcare Interoperability Resources (HL7 FHIR) moved from pilot phase to production reality in a growing share of health systems, catalyzing broader acceptance of standards-based application-programming interfaces (APIs). Peer-reviewed research[1]Wesley Barker, “A National Survey of Digital Health Company Experiences With Electronic Health Record Application Programming Interfaces,” Journal of the American Medical Informatics Association, jamia.oup.com shows that most digital health firms already rely on a mix of standards-based and proprietary APIs to ensure business continuity during transitions. A direct consequence is that integration budgets, previously set aside for custom interfaces, are now being redirected toward new analytical features, indicating an implicit cost shift within project portfolios. An additional inference is that vendors able to demonstrate pre-certified FHIR interfaces can shorten sales cycles by addressing one of the most common procurement hurdles.
Escalating Worldwide Healthcare Workforce Shortages Prompting Automation
A projected shortfall of millions of nurses and allied professionals by 2026 has elevated automation from optional to mission-critical status in the clinical workflow solutions market. Industry associations note a rapid uptick in AI tools aimed at documentation, staffing, and predictive rostering, with reported adoption in medical groups more than doubling year on year. This surge signals that frontline staff increasingly influence purchasing committees, as burnout metrics become board-level key performance indicators. A corollary inference is that software addressing human-factor pain points, rather than purely administrative ones, will enjoy enduring demand because it aligns directly with workforce-retention goals.
Shift to Value-Based Care Requiring End-to-End Workflow Visibility
As payers tie reimbursement to outcomes, providers need continuous performance feedback that links clinical interventions with financial metrics. Integrated workflow platforms are emerging[2]HealthIT.gov, “FHIR Ecosystem,” Office of the National Coordinator for Health Information Technology, healthit.gov as the backbone for this visibility, enabling real-time quality dashboards and automated measure calculations. Government resources underscore the necessity of unified data access for closing information gaps across care teams. From this, one may infer that hospitals lacking such visibility risk revenue leakage as value-based contracts expand, making investment in comprehensive workflow suites a defensive tactic.
Proliferation of Connected Medical Devices Generating Real-Time Data Streams
The rapid adoption of bedside monitors, infusion pumps, and wearable devices have led to the production of terabytes of patient data daily. Clinical workflow solutions capable of ingesting and filtering these streams provide actionable alerts while suppressing noise, thereby reducing alarm fatigue—a clinically documented safety hazard. Device vendors partnering with software platforms can position their hardware as part of an integrated solution, which implies that ecosystem alliances will become competitive differentiators rather than technical conveniences.
Restraints Impact Analysis*
| Restraint | (~) % Impact on CAGR Forecast | Geographic Relevance | Impact Timeline |
|---|---|---|---|
| High Integration & Training Costs | -1.7% | Global, with higher impact in emerging markets | Short term (≤ 2 years) |
| Limited Digital Literacy Among Clinical Staff Impeding Transformation | -1.4% | Global, with higher impact in emerging markets | Short term (≤ 2 years) |
| Fragmented Legacy IT Ecosystems Hindering Seamless Interoperability | -1.3% | Global, most significant in established healthcare markets | Medium term (2-4 years) |
| Data-Privacy & Cyber-Security Concerns Hampering Cloud Adoption | -1.1% | Global, with stricter regulations in Europe and North America | Medium term (2-4 years) |
| Source: Mordor Intelligence | |||
High Integration & Training Costs
Despite evident benefits, the cost and complexity of integrating new platforms into fragmented legacy environments remain leading barriers to adoption. Training budgets often lag behind technology spend, leading to inconsistent utilization and muted return on investment (ROI). The pattern implies that vendors offering embedded change-management services can command a premium because they help customers realize value faster.
Fragmented Legacy IT Ecosystems Hindering Seamless Interoperability
Many hospitals still rely on a patchwork of aging computer systems, and this maze slows down any attempt to streamline clinical workflows. Roughly two out of three facilities juggle at least three separate electronic record platforms, and just keeping those older tools running can swallow nearly half of an IT budget. Each program speaks its own data language and often lacks modern APIs, so sharing information is like trying to fit puzzle pieces from different boxes together. Leaders must decide between a costly full replacement or adding middleware that acts as a translator, all while staff who have grown comfortable with familiar screens worry about upheaval. The most practical route has proven to be a phased upgrade: install an integration layer that cleans and combines data behind the scenes, then retire outdated components one at a time. This measured path keeps daily care humming while nudging the organization toward truly connected, interoperable systems.
*Our forecasts treat driver/restraint impacts as directional, not additive. The impact forecasts reflect baseline growth, mix effects, and variable interactions.
Segment Analysis
By Component: Software Demand Promoting Market Growth
The software segment accounted for the most significant clinical workflow solutions market size at 71.05% in 2025, underpinning digitization initiatives across hospitals. Four consecutive years of capital budgets favoring platform upgrades indicate that software remains the entry point for modernizing processes. Nonetheless, services are forecast to post a 14.18% CAGR from 2026 to 2031, outpacing software expansion as providers seek implementation expertise and continuous optimization. An inference is that knowledge transfer, not code alone, now drives sustainable performance gains, encouraging vendors to embed consultancy teams into subscription contracts.
The services upswing is particularly visible among mid-sized hospitals, where IT resources are limited and external guidance accelerates go-live timelines. As pay-for-performance penalties grow, leadership is willing to fund advisory support to reduce the risk of regulatory non-compliance. Consequently, merger activity among service specialists and platform vendors is likely to intensify, suggesting that integrated offerings will appeal to buyers seeking a single accountability point.


By Product Type: Data Integration Driving Incremental Category Growth
Data integration solutions held 30.10% of the clinical workflow solutions market in 2025, reflecting their role as the connective tissue for disparate electronic health record (EHR) modules. However, care collaboration tools are projected to expand at a 14.75% CAGR through 2031, pointing to a shift toward team-centric delivery models. The pandemic accelerated demand for secure messaging, shared task lists, and cross-site communication; this behavioral change has persisted even as emergency conditions eased. The observation implies that collaboration platforms have crossed the threshold from convenience to clinical necessity.
Advances in AI are further boosting collaboration utilities, providing predictive suggestions about which specialist to engage and when. Vendors embedding such intelligence report higher renewal rates, indicating that clinical users value context-aware recommendations over static messaging functions. The inference here is that differentiation will increasingly reside in decision-support depth rather than interface polish alone.
By Delivery Mode: Adoption of Cloud Promoting Growth
On-premise deployments retained 62.25% of the clinical workflow solutions market share in 2025, mainly due to historical concerns about data sovereignty. Yet cloud-based offerings are forecast to register a 15.10% CAGR to 2031 as CXOs accept that reputable hyperscalers often surpass internal data-centre security postures. Migration patterns reveal an incremental approach: non-mission-critical workloads such as imaging archives move first, followed by live clinical applications once governance frameworks mature. This suggests hybrid models will dominate the mid-term rather than an abrupt “lift-and-shift” strategy.
Cloud scalability carries financial benefits—operating expenses replace capital outlays—yet it also changes vendor–provider dynamics by shifting more operational risk to suppliers. Contract clauses now scrutinize latency and recovery-time objectives in relation to clinical impact, implying that service-level metrics will evolve beyond technical benchmarks to include patient-safety indicators.
By Organization Size: Large Enterprises Supporting Category Growth
Large enterprises controlled 70.05% of market revenue in 2025, leveraging scale to integrate extensive solution suites. Even so, small and medium-sized enterprises (SMEs) are expected to close the gap by growing at 13.62% CAGR through 2031, thanks to modular cloud subscriptions and pay-as-you-grow pricing. This leveling field means that feature sets once reserved for tertiary hospitals are now accessible to community clinics via web browsers. A logical inference is that vendors ignoring SME requirements risk ceding brand loyalty that could later scale upward.
Successful SME adoption often correlates with intuitive user interfaces that minimize training hours. Feedback loops show that practices with fewer than 50 clinicians prioritize rapid onboarding over extensive configuration options. Consequently, micro-vertical products tailored to specialties such as orthopedics or dermatology will likely flourish within this cohort.
By End-User: Hospitals Promoting Market Growth
Hospitals represented 67.90% of the clinical workflow solutions market share in 2025, propelled by complex inpatient processes and high patient volumes. Nevertheless, ambulatory centers and home-health agencies are projected to outpace hospitals at 13.45% CAGR, reflecting care migration beyond hospital walls. Demographic patterns, particularly ageing populations, imply sustained demand for workflow tools that bridge acute and chronic settings. This observation suggests that interoperability functionality must encompass not only hospital EHRs but also smaller-scale record systems standard in post-acute environments.
The long-term care segment clearly illustrates the opportunity: centralized dashboards track vital signs remotely, alerting caregivers and hospital partners when thresholds are breached. Such early warnings prevent avoidable readmissions, a financial incentive under value-based payment models. Vendors capable of customizing alert logic for chronic-care protocols will be positioned to capture this expanding niche.
Geography Analysis
North America produced 43.60% of global revenue in 2025, buoyed by mature IT infrastructure, substantial per-capita healthcare spending, and regulatory incentives that reward technology use in quality reporting. Large health systems partnered with technology giants to pilot advanced AI tools; for instance, Sutter Health’s multi-year collaboration aims to inject AI-driven insights into imaging workflows. One inference is that early adopter networks serve as reference sites, accelerating procurement decisions among peers wary of being left behind.
Asia-Pacific is forecast as the fastest-growing territory with a 13.12% CAGR between 2026 and 2031, underpinned by public funding for digital hospitals in China, India, and Indonesia. A recent memorandum between Siloam Hospitals and Philips to advance AI diagnostics exemplifies regional appetite for leapfrog solutions that circumvent legacy constraints. Given that many facilities are still in the first or second EHR generation, vendors can embed modern standards from inception, potentially reducing long-term integration debt—an implicit cost advantage relative to Western counterparts.
Europe maintains solid penetration, with General Data Protection Regulation (GDPR) shaping privacy-by-design architectures. Although national markets differ, leading institutions in Germany and the United Kingdom experiment with AI-enabled scheduling and ambient documentation. The inference is that stringent data rules push vendors to refine consent management modules, which can later be repurposed as value-adds in less regulated markets. Emerging regions in the Middle East, Africa, and South America are earlier in the adoption curve but exhibit high interest in telehealth and cloud solutions, suggesting they may skip the on-premise phases entirely.

Competitive Landscape
The clinical workflow solutions industry displays moderate concentration, anchored by diversified conglomerates such as GE HealthCare, Philips, and Oracle. Recent alliances with hyperscale cloud providers illustrate a pivot to platform partnerships that marry clinical expertise with infrastructure scalability. GE HealthCare’s work with Amazon Web Services to build foundation models for radiology highlights how AI is moving from departmental pilots to systemic architecture.
White-space entrants are carving niches in ambient clinical documentation, real-time communication, and specialty-specific pathways. Because these firms often integrate via open APIs, larger players face a strategic choice: acquire innovators or risk ecosystem fragmentation. An implicit inference is that valuation multiples for interoperability-ready startups will remain elevated relative to generic software peers, given their scarcity and immediate revenue synergies.
Competitive differentiation increasingly hinges on outcome-based contracts that tie subscription fees to measurable improvements in documentation time or readmission rates. A second inference is that legal teams are rewriting master-service agreements to include performance guarantees linked to quality metrics, reflecting a maturing buyer market that demands proof of value.
Clinical Workflow Solutions Industry Leaders
Ascom Holding AG
Baxter International
Cisco Systems Inc.
GE HealthCare Technologies Inc.
Veradigm Inc
- *Disclaimer: Major Players sorted in no particular order

Recent Industry Developments
- February 2025: Ambience Healthcare joined the athenahealth Marketplace, integrating AI-assisted documentation and coding into existing practice management environments. The move broadens Ambience’s installed base while granting athenahealth users immediate productivity gains.
- January 2025: McKesson’s Practice Insights obtained status as a Qualified Clinical Data Registry, reinforcing McKesson’s position in outcomes reporting and provider performance benchmarking.
- November 2024: GE HealthCare and RadNet partnered to embed SmartMammo AI into next-generation mammography systems, promising enhanced diagnostic speed and workflow efficiency in breast-imaging suites.
- October 2024: GE HealthCare unveiled CareIntellect for Oncology, a cloud-native application that amalgamates multi-modal data and summarizes clinician notes using generative AI, enabling quicker therapy decisions.


Research Methodology Framework and Report Scope
Market Definitions and Key Coverage
Our study defines the clinical workflow solutions market as software and service suites that sit on top of electronic health-record or imaging environments to integrate patient data, trigger real-time communication, automate task routing, and deliver enterprise analytics across care settings. According to Mordor Intelligence, revenue is captured only from new license sales, subscription fees, and associated implementation or managed service contracts delivered to hospitals, long-term care facilities, and ambulatory centers worldwide.
Scope exclusion: stand-alone billing or scheduling tools that operate without direct linkage to clinical decision support or patient documentation are left outside the model.
Segmentation Overview
- By Component
- Software
- Services
- By Product Type
- Data-Integration Solutions
- Real-Time Communication Solutions
- Workflow-Automation Solutions
- Care-Collaboration Solutions
- Enterprise Reporting & Analytics Solutions
- By Delivery Mode
- On-Premise
- Cloud-Based
- Hybrid
- By Organization Size
- Large Enterprises
- SMEs
- By End-User
- Hospitals
- Long-Term Care Facilities
- Other End-Users
- By Geography (Value)
- North America
- United States
- Canada
- Mexico
- Europe
- Germany
- United Kingdom
- France
- Italy
- Spain
- Rest of Europe
- Asia-Pacific
- China
- India
- Japan
- Australia
- South Korea
- Rest of Asia-Pacific
- Middle East & Africa
- GCC
- South Africa
- Rest of Middle East & Africa
- South America
- Brazil
- Argentina
- Rest of South America
- North America
Detailed Research Methodology and Data Validation
Primary Research
Mordor analysts interview hospital CIOs, nursing informaticists, regional health-IT integrators, and workflow-solution product managers across North America, Europe, Asia-Pacific, and the Gulf. These conversations test adoption thresholds, average selling prices, and upgrade cycles, allowing us to refine desk-based assumptions and close material data gaps before final triangulation.
Desk Research
We start by mapping the universe of care-delivery points through sources such as the WHO Global Health Observatory, OECD Health Statistics, and the American Hospital Association, which give us base counts of hospitals, beds, and encounters. Usage intensity and license penetration ratios are inferred from publicly available datasets published by HIMSS Analytics, the European eHealth Network, and peer-reviewed papers in _JAMIA_. Company filings, 10-Ks, and investor decks reveal typical contract values and deployment footprints, while news archives on Dow Jones Factiva and deal trackers on D&B Hoovers help trace vendor wins. Secondary inputs are rounded out with trade-association white papers and select customs data for hardware-bundled solutions. This list is illustrative, not exhaustive; many additional open and paid sources were consulted during validation.
Market-Sizing & Forecasting
A top-down model converts country-level hospital counts into potential license pools, adjusted for specialty mix and digital-maturity tiers. Sampled ASP × volume roll-ups from supplier checks provide a bottom-up reasonableness test. Key variables, including inpatient admissions, interoperability mandates (HL7 FHIR milestones), nurse-to-bed ratios, cloud migration rates, and capital-budget outlooks, feed a multivariate regression that projects revenues to 2030. Where bottom-up estimates stray beyond a five-percent band, weighted averages are recalibrated before the forecast is frozen.
Data Validation & Update Cycle
Outputs move through anomaly scans, peer review, and supervisory sign-off. The model refreshes each year, with interim edits triggered by regulatory shifts, mega-mergers, or material vendor revenue disclosures, ensuring clients receive the latest view at download.
Why Mordor's Clinical Workflow Solutions Baseline Commands Reliability
Published market values often diverge because different firms pick dissimilar product baskets, price books, and refresh cadences.
Key gap drivers here include inclusion of peripheral admin modules, reliance on aging pre-COVID baselines, currency conversion at invoice rather than constant dollars, and unverified ASP benchmarks that inflate totals.
Benchmark comparison
| Market Size | Anonymized source | Primary gap driver |
|---|---|---|
| USD 13.36 bn (2025) | Mordor Intelligence | - |
| USD 13.61 bn (2025) | Regional Consultancy A | Treats standalone nurse-call hardware as part of software revenue |
| USD 18.10 bn (2025) | Global Consultancy B | Applies uniform 20 % ASP uplift without region-level checks |
| USD 19.96 bn (2024) | Research Firm C | Uses 2020 hospital counts, no adjustment for facility closures |
Taken together, the comparison shows that Mordor's disciplined scope selection, verified ASP inputs, and yearly refresh cadence deliver a balanced, transparent baseline that decision-makers can trace back to clear variables and repeatable steps.


Key Questions Answered in the Report
What is the projected clinical workflow solutions market size by 2031?
The market is expected to reach USD 26.25 billion by 2031, based on current growth trajectories.
Why are clinical workflow important for healthcare providers?
They reduce administrative burdens, improve care coordination, and enable data-driven decisions, all of which help providers deliver safer and more efficient patient care.
Which segment is growing fastest within the clinical workflow industry?
Care collaboration solutions are anticipated to grow the quickest, driven by the expansion of team-based and distributed care models.
How do interoperability standards like FHIR impact the market?
Standards allow seamless data exchange, lower integration costs, and accelerate new-solution roll-outs, thereby boosting adoption rates.
Are cloud-based solutions overtaking on-premise deployments?
Cloud adoption is accelerating due to lower upfront costs and superior scalability, yet hybrid models remain common as providers balance control and flexibility.
What role does AI play in clinical workflow optimization?
AI automates repetitive tasks, augments decision-making, and predicts resource needs, thereby improving clinician productivity and patient outcomes.
Page last updated on:


