Clinical Data Analytics Market Size and Share
Market Overview
| Study Period | 2020 - 2031 |
|---|---|
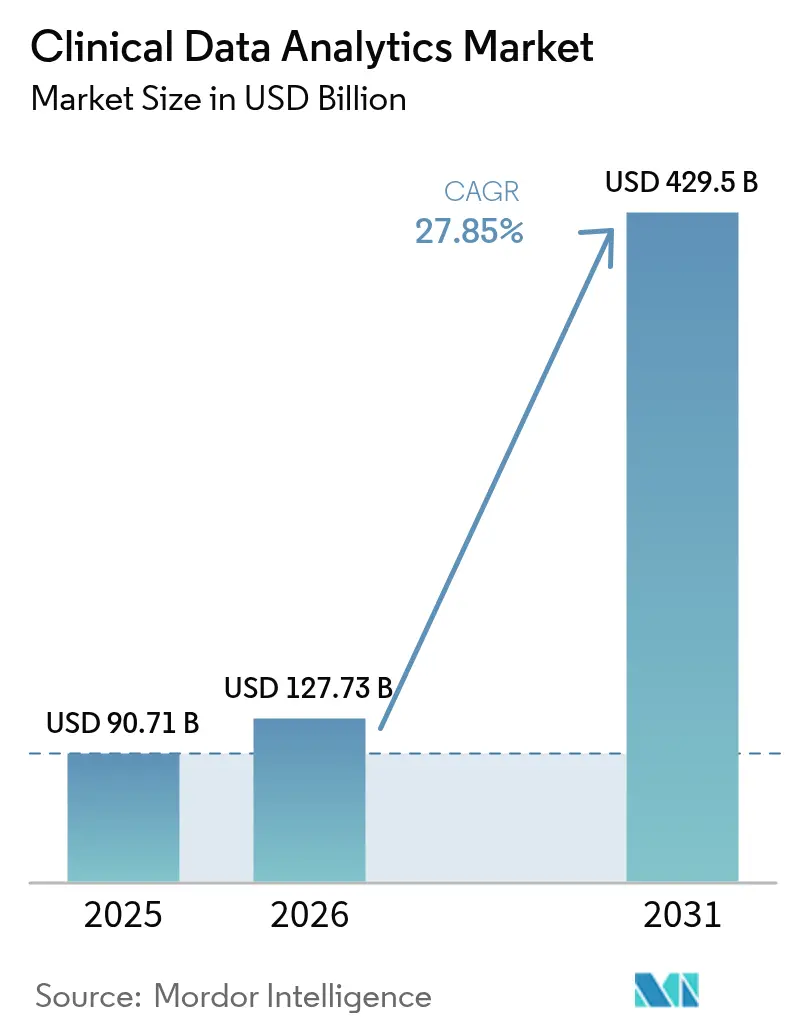
| Market Size (2026) | USD 127.73 Billion |
| Market Size (2031) | USD 429.5 Billion |
| Growth Rate (2026 - 2031) | 27.85% CAGR |
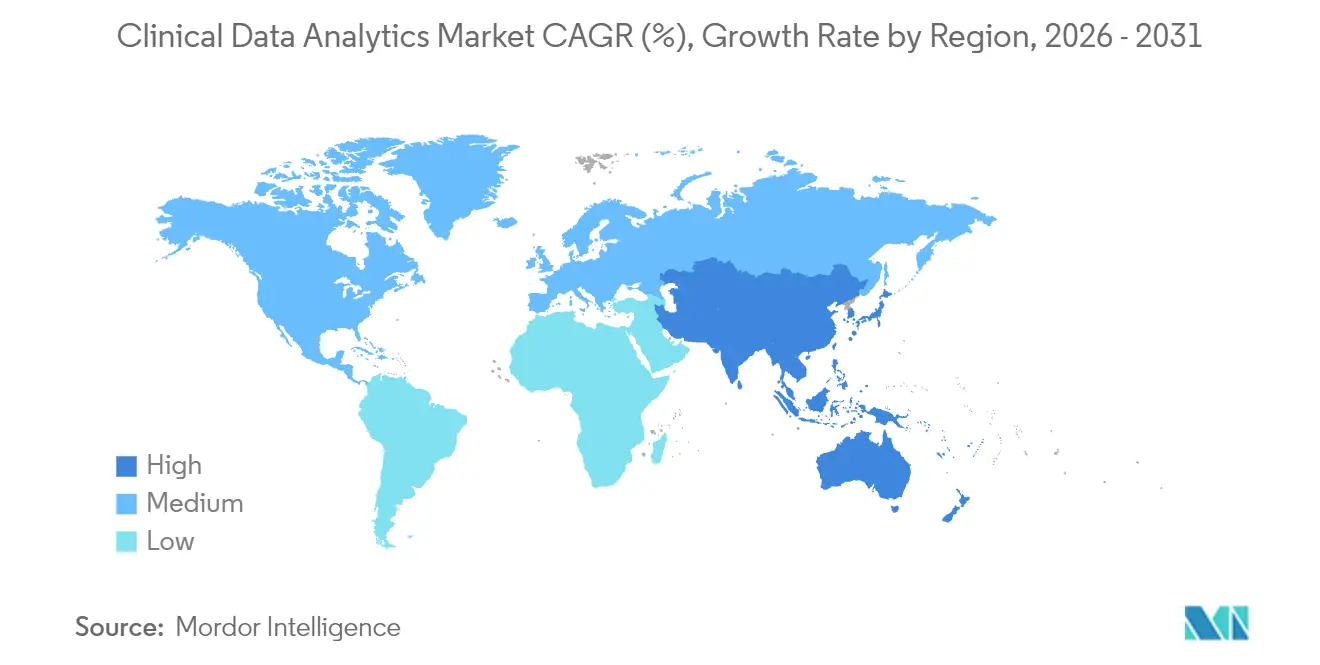
| Fastest Growing Market | Asia Pacific |
| Largest Market | North America |
| Market Concentration | Medium |
Major Players *Disclaimer: Major Players sorted in no particular order Image © Mordor Intelligence. Reuse requires attribution under CC BY 4.0. | |
Clinical Data Analytics Market Analysis by Mordor Intelligence
The clinical data analytics market size is projected to be USD 90.71 billion in 2025, USD 125.73 billion in 2026, and reach USD 429.5 billion by 2031, growing at a CAGR of 27.85% from 2026 to 2031. Mounting pressure to link reimbursement with quality outcomes is pushing hospitals and insurers to pivot from retrospective reporting toward predictive and prescriptive intelligence. Regulators have cleared hundreds of AI-enabled devices, while pay-for-performance contracts now place 30% of traditional Medicare payments at risk, accelerating real-time analytics adoption. Dominance of cloud-based deployment shows early success, yet hybrid models are scaling quickly because health systems need local control over identifiers while retaining elastic compute for model training. Providers remain the largest buyers, but payers are the fastest-growing customers as claims, clinical, and social determinants feed converge to manage the total cost of care.
Key Report Takeaways
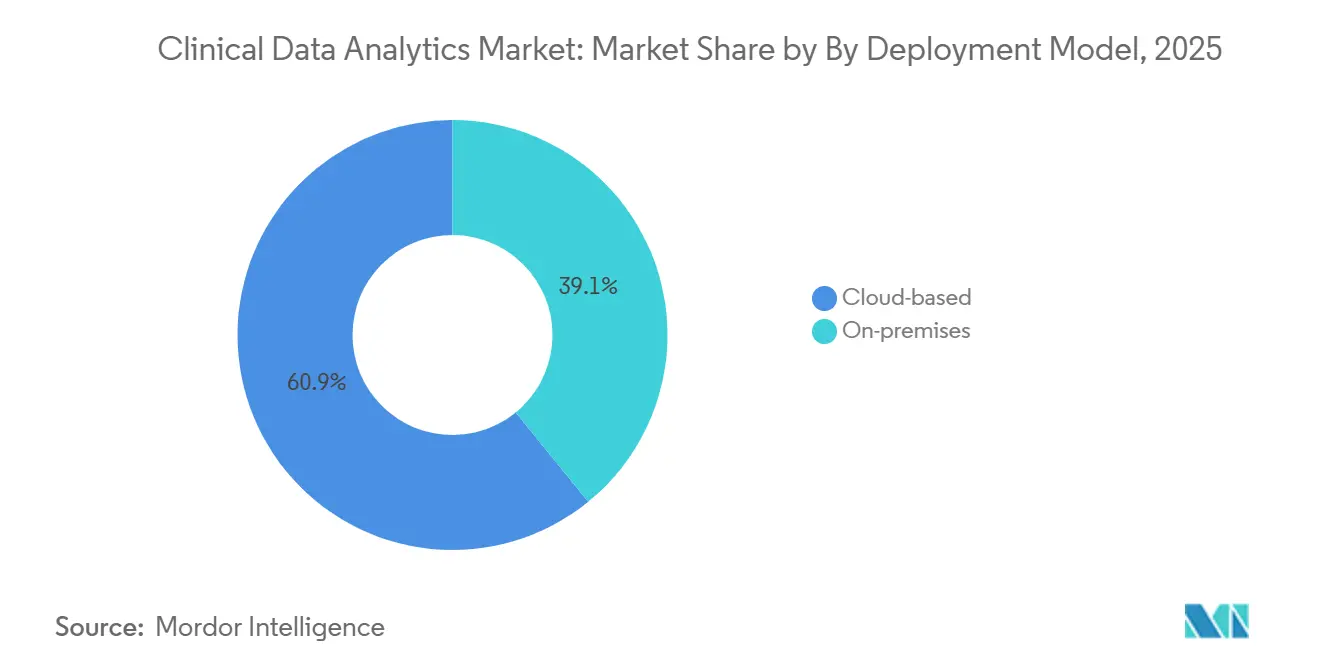
- By deployment model, cloud-based solutions led with 61.29% revenue share in 2025, whereas hybrid architectures are forecast to expand at a 27.52% CAGR through 2031.
- By component, software captured 67.91% of the clinical data analytics market share in 2025, and services are projected to grow at 27.11% CAGR over 2026-2031.
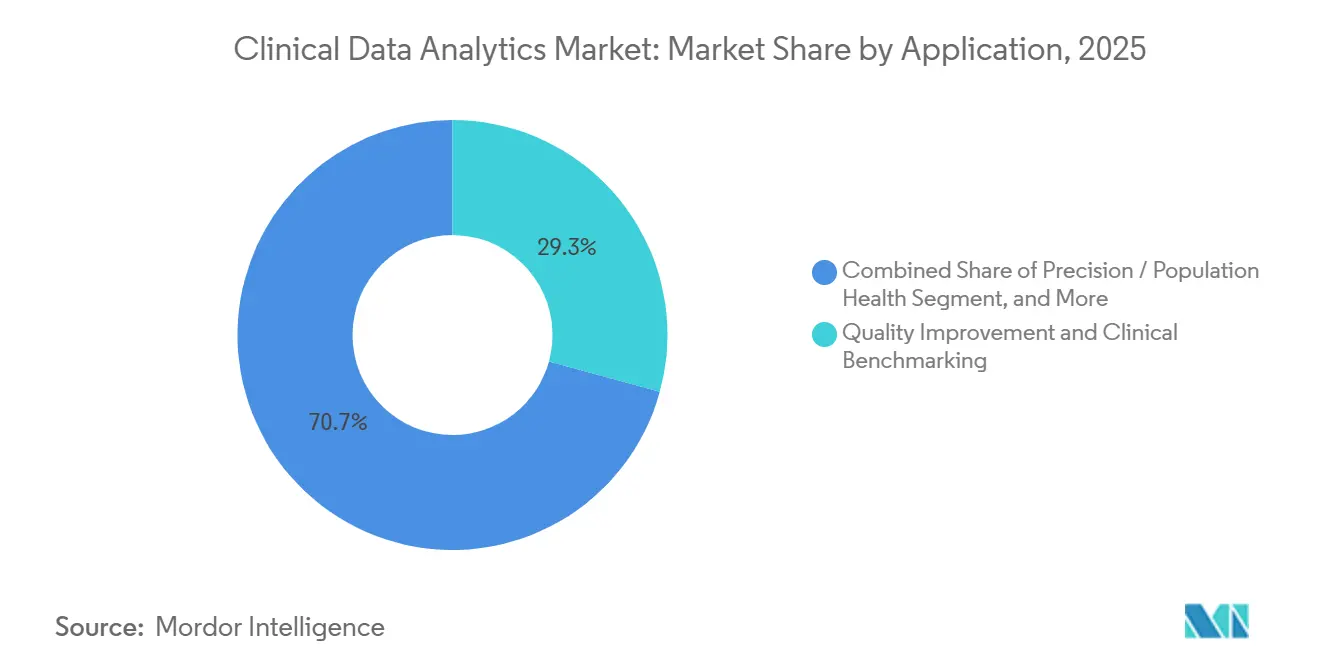
- By application, quality improvement and clinical benchmarking commanded 29.26% share of the clinical data analytics market size in 2025, while precision and population health analytics are advancing at a 27.29% CAGR to 2031.
- By end-user vertical, providers held 54.11% of 2025 spending, yet payers record the highest projected growth at 26.95% CAGR through 2031.
- By geography, North America contributed 60.37% of global revenue in 2025; Asia-Pacific is the fastest region, set to register a 26.71% CAGR during 2026-2031.
Note: Market size and forecast figures in this report are generated using Mordor Intelligence’s proprietary estimation framework, updated with the latest available data and insights as of 2026.
Global Clinical Data Analytics Market Trends and Insights
Driver Impact Analysis*
| Driver | (~) % Impact on CAGR Forecast | Geographic Relevance | Impact Timeline |
|---|---|---|---|
| Rising Adoption of AI-Driven Predictive Models | +6.50% | Global, with early concentration in North America and Western Europe | Medium term (2-4 years) |
| Regulatory Push for Real-World Evidence in Drug Approval | +5.20% | North America and Europe, expanding to Asia-Pacific | Long term (≥ 4 years) |
| Shift to Value-Based Care Reimbursement Models | +4.80% | North America, pilot programs in Europe and Australia | Medium term (2-4 years) |
| Expansion of Cloud-Native Health IT Infrastructure | +4.30% | Global, led by North America, Asia-Pacific, and Middle East | Short term (≤ 2 years) |
| Rise of Synthetic Data Accelerators for Model Validation | +2.90% | North America and Europe, with regulatory acceptance in select Asia-Pacific markets | Long term (≥ 4 years) |
| Edge Analytics Adoption for Near-Patient Decision Support | +2.10% | Global, with early adoption in ambulatory and remote-care settings | Medium term (2-4 years) |
| Source: Mordor Intelligence | |||
Rising Adoption of AI-Driven Predictive Models
Machine-learning tools now identify sepsis six hours sooner than legacy rules, cutting intensive-care mortality by 18% in multi-site trials.[1]JAMA Network, “Early Prediction of Sepsis Using Machine Learning,” JAMA Network, jamanetwork.com The U.S. Food and Drug Administration’s 2024 guidance on predetermined change-control plans lets vendors retrain approved models without refiling, shortening iteration cycles.[2]U.S. Food and Drug Administration, “Artificial Intelligence and Machine Learning in Software as a Medical Device,” FDA, fda.gov Payers embed risk scores into prior-authorization checks, with UnitedHealth Group reporting a 12% drop in unnecessary imaging after rolling out AI-driven utilization management.[3]UnitedHealth Group, “2024 Annual Report (Form 10-K),” UNITEDHEALTH GROUP, unitedhealthgroup.com Hospitals translate these insights into automatic care-plan templates that surface next-best actions inside electronic medical records, turning analytics from passive dashboards into active workflow engines. As accuracy improves, buyers place greater trust in prescriptive recommendations that directly influence discharge timing, bed allocation, and staffing.
Regulatory Push for Real-World Evidence in Drug Approval
In 2024 the FDA cleared three oncology label expansions that relied primarily on electronic health records and claims data rather than traditional randomized trials. The European Medicines Agency’s Data Analysis and Real-World Interrogation Network supplies standardized queries across member-state registries, slashing sponsor time to data lock.[4]European Medicines Agency, “Data Analysis and Real-World Interrogation Network,” EMA, ema.europa.eu Japan’s Pharmaceuticals and Medical Devices Agency published a real-world evidence roadmap in 2024 that aligns local submissions with U.S. and EU expectations. These frameworks elevate observational analytics from a post-market surveillance role to a core element of drug development, sparking demand for platforms capable of causal inference, propensity matching, and longitudinal linkage. As regulators validate these designs, life-science companies reallocate budgets from expensive controlled trials to scalable analytics partnerships.
Shift to Value-Based Care Reimbursement Models
Medicare’s Shared Savings Program paid USD 2.1 billion in bonuses to 483 accountable care organizations that met quality and cost targets in 2025. Commercial payers echo the trend; Anthem disclosed that 40% of its 2024 medical spend flowed through value-based contracts. Success depends on algorithms that flag rising-risk patients days before adverse events, allowing care managers to intervene. Provider groups that lack timely insights face downside penalties when spending overshoots benchmarks, making analytics procurement an urgent board-level priority. The continual shift of financial risk from insurers to clinicians cements the clinical data analytics market as a strategic investment rather than an IT expense.
Expansion of Cloud-Native Health IT Infrastructure
Amazon Web Services reported 35% healthcare revenue growth for 2024, propelled by data lake deployments that fuse imaging, genomics, and EHR feeds. Google Cloud’s Healthcare Data Engine added Gemini-powered search, letting clinicians query unstructured notes with plain language. Microsoft Azure processed over 1 billion Fast Healthcare Interoperability Resources transactions in 2024, underscoring demand for managed interoperability. While pure-public-cloud adoption remains strong, latency requirements in emergency departments spur hybrid topologies that cache high-value datasets on-premises. The resulting architectural flexibility accelerates proof-of-concept timelines and broadens addressable use cases in the clinical data analytics market.
Restraints Impact Analysis*
| Restraint | (~) % Impact on CAGR Forecast | Geographic Relevance | Impact Timeline |
|---|---|---|---|
| Data-Quality Variability Across Source Systems | -3.80% | Global, acute in fragmented markets with multiple EHR vendors | Short term (≤ 2 years) |
| High Cost of Integrating Legacy EHRs | -3.20% | North America and Europe, where installed base is oldest | Medium term (2-4 years) |
| Ethical and Legal Concerns Around Secondary Data Use | -2.40% | Europe under GDPR, expanding to Asia-Pacific and North America | Long term (≥ 4 years) |
| Algorithmic Transparency Mandates Delaying Deployments | -1.90% | Europe and North America, with emerging frameworks in Asia-Pacific | Medium term (2-4 years) |
| Source: Mordor Intelligence | |||
Data-Quality Variability Across Source Systems
Forty percent of U.S. hospitals still operate pre-2015 systems lacking modern application programming interfaces, according to the Office of the National Coordinator for Health Information Technology’s 2024 report. Missing medication histories and inconsistent problem-list coding cut predictive sensitivity by 22% when models move across sites. Middleware can translate HL7 v2 messages into FHIR resources, but licensing, maintenance, and support fees erode return on investment for smaller hospitals. As a result, vendors differentiate on data-governance toolkits that profile, harmonize, and monitor incoming feeds. Until source standards mature, organizations ration analytics deployments to departments with the cleanest data, tempering near-term growth.
High Cost of Integrating Legacy EHRs
A full EHR replacement costs USD 50-200 million and can stall for up to three years, locking hospitals into aging stacks that cannot support real-time streaming. Separate licensing fees for premium analytics modules further deter community hospitals from upgrading. Oracle’s 2024 review of Cerner customers found that 60% ran on database versions more than five years old, limiting compatibility with cloud data pipelines. Third-party integration engines add subscription overhead, and each interface must be re-certifying every time a source system update. These cumulative expenses slow migration and trim the addressable pool of buyers for advanced platforms.
*Our forecasts treat driver/restraint impacts as directional, not additive. The impact forecasts reflect baseline growth, mix effects, and variable interactions.
Segment Analysis
By Deployment Model: Hybrid Architectures Reconcile Sovereignty and Scale
Hybrid deployments are forecast to expand at 27.52% CAGR over 2026-2031, outpacing cloud and on-premises choices. Cloud-based offerings still led the clinical data analytics market share at 61.29% in 2025, driven by rapid spin-up of sandboxes for natural-language processing and cohort discovery. Public regulators in Germany require pseudonymized patient identifiers to stay in country, pushing multi-national health systems toward architectures that keep identity layers local while shipping tokenized features to the cloud. AWS Outposts, Microsoft Azure Stack, and Google Distributed Cloud let developers deploy uniform code in hospital data centers and public zones, reducing refactoring. Federated learning also gains traction, training algorithms locally and sharing only model weights, which aligns with the GDPR data-minimization principle.
Hybrid growth reshapes vendor go-to-market. Hyperscalers now bundle hardware appliances to shorten procurement cycles, while integrators sell subscription-based monitoring for edge nodes that host time-critical services like stroke triage. Budget committees favour staged adoption: batch analytics migrate first, high-frequency predictive alerts follow once latency metrics are proven. As sovereign-cloud policies proliferate in the Middle East and Asia, hybrid flexibility becomes a default technical requirement rather than a niche exception, further enlarging the clinical data analytics market.


By Component: Services Surge as Integration Complexity Escalates
Software licenses accounted for 67.91% revenue in 2025, but consulting, data-engineering, and managed-services contracts are projected to grow 27.11% annually through 2031 as buyers confront skills gaps. Accenture recorded 18% healthcare consulting growth in 2024 by staffing long-duration cloud-migration projects. Deloitte’s 2024 CIO survey shows 68% of health systems increasing outside spending on machine learning and interoperability expertise. As software moves from perpetual to subscription pricing, license amortization flattens, and services carry more project revenue. Vendors now package outcome-based contracts where payment hinges on reduction in sepsis mortality or readmission rates, realigning incentives with client goals.
Managed services offer hospitals predictable operating expense models that bypass capital budgeting cycles. Providers hand over patching, model retraining, and audit preparation, freeing clinical staff to focus on interpreting insights rather than coding data pipelines. This shift multiplies touchpoints between vendor and client, heightening stickiness and expanding total lifetime value within the clinical data analytics market.
By Application: Precision and Population Health Redefine Risk Stratification
Quality improvement and benchmarking retained 29.26% of 2025 spending, yet precision and population analytics show the fastest ascent at a 27.29% CAGR. The National Institutes of Health’s All of Us program, spanning 500,000 participants, supplies multi-omic data that feeds pharmacogenomic algorithms. Cigna attributes a 14% reduction in bleeding events to genotype-based warfarin dosing, proving commercial viability of precision pathways. Population health engines aggregate claims and lab feeds to risk-stratify diabetics for retinopathy screening reminders, illustrating how analytics now blend preventive and precision care into a unified continuum.
Comparative-effectiveness modules use these same pipelines to build treatment pathways that can be auto-embedded into order sets, closing the loop between insight and action. As insurers align reimbursement triggers to social-determinant factors, demand rises for tools that ingest housing, nutrition, and transportation datasets alongside clinical metrics. The clinical data analytics market consequently evolves from retrospective scorecards into forward-looking orchestration hubs that coordinate personalized interventions.

By End-User Vertical: Payers Accelerate Analytics to Manage Medical Loss Ratios
Providers generated 54.11% of 2025 revenue, but payers are slated to grow 26.95% per year through 2031 as they ingest near-real-time clinical data feeds. Optum processed 200 billion healthcare transactions in 2024, flagging duplicate imaging orders and steering members to lower-cost sites of care. Humana’s emergency-department risk model cut avoidable visits by 9%, a direct medical loss ratio win. With downside caps limiting administrative spend, payers treat analytics as a lever to curtail utilization rather than deny service, which carries reputational risk.
Concurrently, providers integrate claims feeds to gauge leakage and referral patterns, tightening network alignment. The result is a two-way data exchange where each party’s analytics output becomes the other’s input, deepening interdependence. As payer-provider convergences such as CVS-Aetna and Elevance’s care delivery acquisitions mature, shared platforms emerge, broadening the clinical data analytics market size for cross-enterprise solutions.
Geography Analysis
North America delivered 60.37% of 2025 global revenue, underwritten by USD 4.5 trillion in annual United States health outlays and regulatory rules that penalize information blocking. Ontario Health documented an 11% drop in readmissions among heart-failure patients after launching predictive models, validating scalability outside the United States. Mexico’s social-security institute centralized 70 million records into a cloud data warehouse, cutting duplicate tests and boosting the clinical data analytics market footprint in Latin America.
Asia-Pacific is forecast to expand at a 26.71% CAGR, the fastest worldwide. India enrolled 500 million citizens in its national digital-health ID registry, creating a longitudinal backbone for statewide population analytics. China mandated Level 4 interoperability standards for all public hospitals by 2025, accelerating data availability for research. Japan earmarked JPY 50 billion (USD 340 million) to subsidize rural EHR upgrades, addressing urban-rural disparities. South Korea publicly posts quality rankings for 3,800 hospitals, harnessing analytics to nudge patient choice.
Europe balances innovation with privacy. The proposed European Health Data Space seeks to harmonize secondary data use while preserving GDPR safeguards. Germany’s financial incentives sparked a jump to 30% adoption of electronic patient records in 2024. The United Kingdom allocated GBP 480 million (USD 610 million) to modernize a federated data platform spanning 42 integrated care systems. Middle East governments funnel oil-diversification funds into sovereign clouds; Saudi Arabia partnered with Oracle to deploy a national EHR serving 30 million residents. Brazil’s Rede Nacional de Dados em Saúde stitches federal and state registries to track outbreaks, extending the clinical data analytics market to public-health surveillance.

Competitive Landscape
The clinical data analytics market remains moderately concentrated. Oracle integrated Cerner’s transaction engine with autonomous databases and machine-learning tools, offering an end-to-end stack that reduces middleware costs. Epic Systems embeds proprietary predictive modules inside its EHR, making competitive displacement difficult. Hyperscalers counter by selling FHIR-native storage, natural-language processing, and turnkey analytics accelerators, letting developers bypass direct negotiations with entrenched EHR vendors.
White-space opportunities lie in longitudinal linkage across inpatient, ambulatory, and home-monitoring data. Evidation Health aggregates consumer-wearable signals to extend phenotype resolution for pharmaceutical cohort discovery. TriNetX connects de-identified records from dozens of countries, delivering rapid feasibility analytics for global trials. Health Catalyst emphasizes governance workflows, positioning data stewardship as a differentiator in a market plagued by quality variability.
Privacy-enhancing computation is an emerging moat. Patent filings in homomorphic encryption and secure multi-party analytics have tripled since 2023, reflecting demand for cross-border collaboration without raw data movement. Vendors achieving HITRUST, ISO 27001 and SOC 2 Type II certifications accelerate procurement in hospital compliance committees. Altogether, the interplay among legacy EHR giants, cloud platforms, and niche data-networks fuels dynamic competition and supports sustained expansion of the clinical data analytics market.
Clinical Data Analytics Industry Leaders
IBM Corporation
Oracle Corporation
Inspirata Inc.
Allscripts Healthcare, LLC
SAS Institute, Inc.
- *Disclaimer: Major Players sorted in no particular order


Recent Industry Developments
- April 2025: HEALWELL AI finalized its acquisition of Orion Health, creating a global leader in FHIR-based interoperability solutions.
- April 2025: Transcarent completed its USD 621 million merger with Accolade, integrating generative-AI WayFinding into personalized healthcare offerings.
- March 2025: Datavant launched its Clinical Insights Platform to streamline real-world evidence generation for trial optimization.
- December 2024: eClinical Solutions integrated its platform with Snowflake, boosting cloud-based analytics for pharmaceutical trials
- November 2024: Oracle signaled its intent to acquire additional EMR data vendors to bolster its analytics portfolio.


Global Clinical Data Analytics Market Report Scope
The Clinical Data Analytics Market Report is Segmented by Deployment Model (Cloud-Based, On-Premise), Component (Software, Services), Application (Quality Improvement and Clinical Benchmarking, Clinical Decision Support, Regulatory Reporting and Compliance, Comparative Effectiveness Analytics, Precision/Population Health), End-User Vertical (Providers, Payers), and Geography (North America, Europe, Asia-Pacific, Middle East and Africa, South America). The Market Forecasts are Provided in Terms of Value (USD).
| Cloud-Based |
| On-Premise |
| Software |
| Services |
| Quality Improvement and Clinical Benchmarking |
| Clinical Decision Support |
| Regulatory Reporting and Compliance |
| Comparative Effectiveness Analytics |
| Precision / Population Health |
| Providers |
| Payers |
| North America | United States | |
| Canada | ||
| Mexico | ||
| Europe | Germany | |
| United Kingdom | ||
| France | ||
| Russia | ||
| Rest of Europe | ||
| Asia-Pacific | China | |
| Japan | ||
| India | ||
| South Korea | ||
| Australia | ||
| Rest of Asia-Pacific | ||
| Middle East and Africa | Middle East | Saudi Arabia |
| United Arab Emirates | ||
| Rest of Middle East | ||
| Africa | South Africa | |
| Egypt | ||
| Rest of Africa | ||
| South America | Brazil | |
| Argentina | ||
| Rest of South America | ||
| By Deployment Model | Cloud-Based | ||
| On-Premise | |||
| By Component | Software | ||
| Services | |||
| By Application | Quality Improvement and Clinical Benchmarking | ||
| Clinical Decision Support | |||
| Regulatory Reporting and Compliance | |||
| Comparative Effectiveness Analytics | |||
| Precision / Population Health | |||
| By End-User Vertical | Providers | ||
| Payers | |||
| By Geography | North America | United States | |
| Canada | |||
| Mexico | |||
| Europe | Germany | ||
| United Kingdom | |||
| France | |||
| Russia | |||
| Rest of Europe | |||
| Asia-Pacific | China | ||
| Japan | |||
| India | |||
| South Korea | |||
| Australia | |||
| Rest of Asia-Pacific | |||
| Middle East and Africa | Middle East | Saudi Arabia | |
| United Arab Emirates | |||
| Rest of Middle East | |||
| Africa | South Africa | ||
| Egypt | |||
| Rest of Africa | |||
| South America | Brazil | ||
| Argentina | |||
| Rest of South America | |||


Key Questions Answered in the Report
What is the projected value of the clinical data analytics market by 2031?
It is forecast to reach USD 429.5 billion by 2031.
How fast will hybrid deployment grow in clinical analytics platforms?
Hybrid architectures are expected to expand at a 27.52% CAGR through 2031.
Which application area is growing the quickest?
Precision and population health analytics lead with a 27.29% CAGR over 2026-2031.
Why are payers investing heavily in analytics?
Insurers use predictive models to manage medical loss ratios, detect fraud, and design value-based contracts, driving a 26.95% CAGR in spending.
Which region offers the highest growth opportunity?
Asia-Pacific, propelled by national digital-health mandates, is set to grow at a 26.71% CAGR between 2026 and 2031.
What factor most restrains short-term market expansion?
Data-quality variability across disparate EHR systems reduces algorithm accuracy and slows deployments.
Page last updated on:


