
Market Overview
| Study Period | 2020 - 2031 |
|---|---|
| Forecast Data Period | 2026 - 2031 |
| Historical Data Period | 2020 - 2024 |
| Growth Rate | 1.02 % |
| Market Concentration | Low |
Major Players *Disclaimer: Major Players sorted in no particular order Image © Mordor Intelligence. Reuse requires attribution under CC BY 4.0. | |
North America Calcium Carbonate Market Analysis by Mordor Intelligence
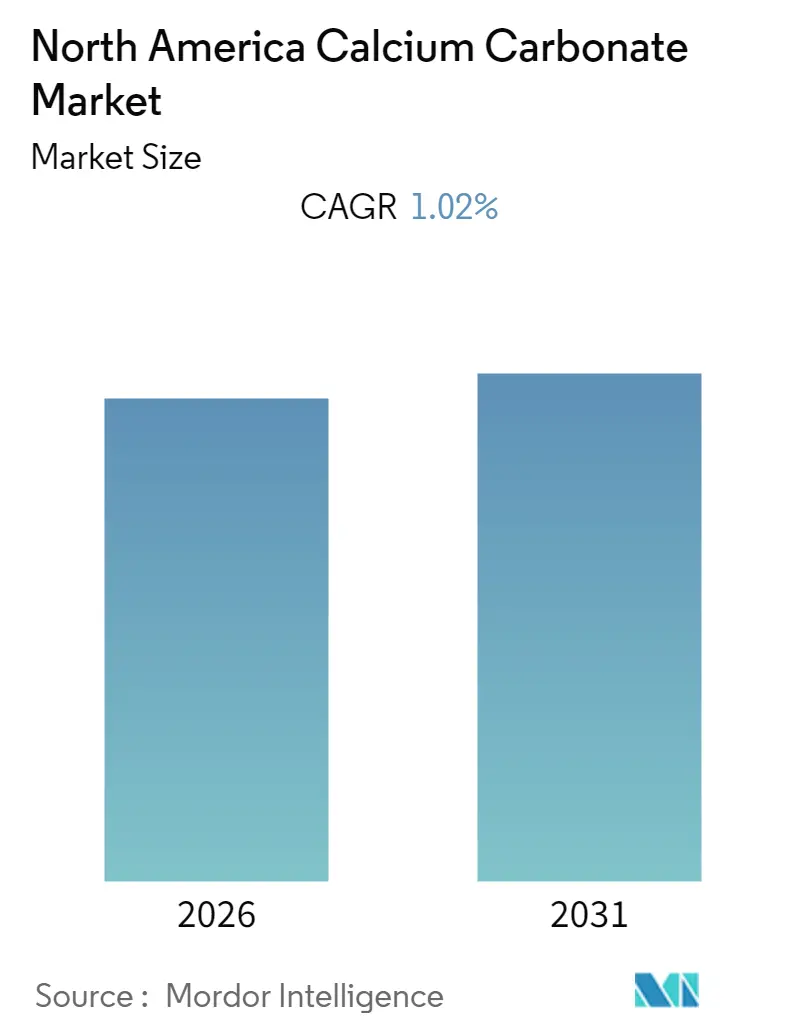
The North America Calcium Carbonate Market size is expected to register a CAGR of 1.02% during the forecast period (2026-2031).
- The major factor driving the growth of the market is the increasing demand for paints and coatings from the construction industry.
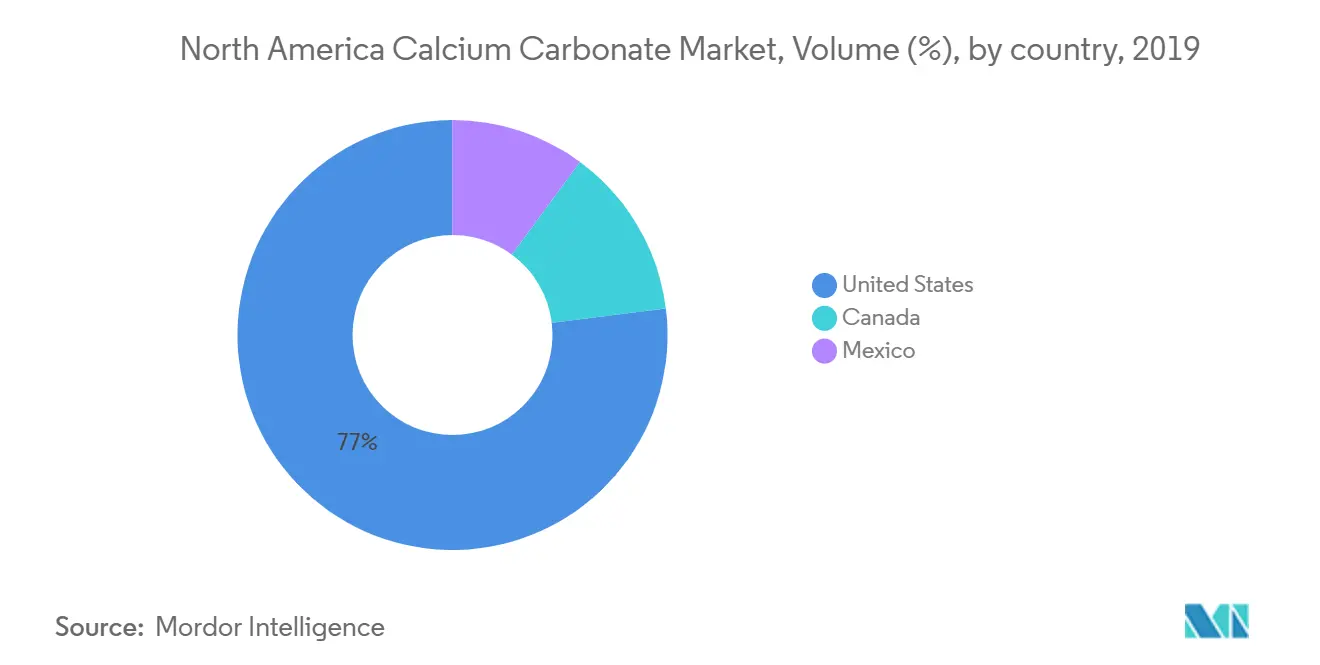
- The declining rate of paper production in North America is expected to hinder the growth of the market studied. Moreover, the health hazards associated with the usage of calcium carbonate are also expected to hinder the growth of the North America calcium carbonate market.
Note: Market size and forecast figures in this report are generated using Mordor Intelligence’s proprietary estimation framework, updated with the latest available data and insights as of 2026.
North America Calcium Carbonate Market Trends and Insights
Increasing Demand from Paints and Coatings Industry
- In paints and coatings, calcium carbonate (CaCO3) functions as the main extender. The fineness and particle-size distribution impacts the opacity of coatings. Moreover, CaCO3 offers interesting features, like high brightness, low oil absorption, dispersibility, weather resistance, low abrasiveness, low electrolyte content, pH stabilizing effect, and improved anti-corrosion and rheological properties.
- Ultrafine CaCO3 used in paints and coatings has a spatial steric effect. The addition of ultra fine CaCO3 to paint can cause the relatively dense lithopone to stay in suspension and not sink to the bottom. It can increase the whiteness and luster of the paint film without reducing covering ability. These performance-enhancing qualities have ensured the large-scale acceptance of ultrafine calcium carbonate by the paint industry.
- It can prevent settling in latex paints and can reduce the amount of dispersant needed. It is used even more extensively in the aqueous paint industry. Typically, 20%-60% of ultra-fine CaCO3 is used in aqueous paints.
- The construction industry in the United States witnessed a rapid growth in the past few years, as a result of increased private sector expenditure on residential construction. This increasing trend is expected to continue, depending on the funding for larger projects, such as the Hudson Yards in New York City, among various others.
- This growth in the construction industry is expected to contribute to the demand for paints and coatings. This factor, in turn, is expected to boost the demand for calcium carbonate.


United States to Dominate the Market
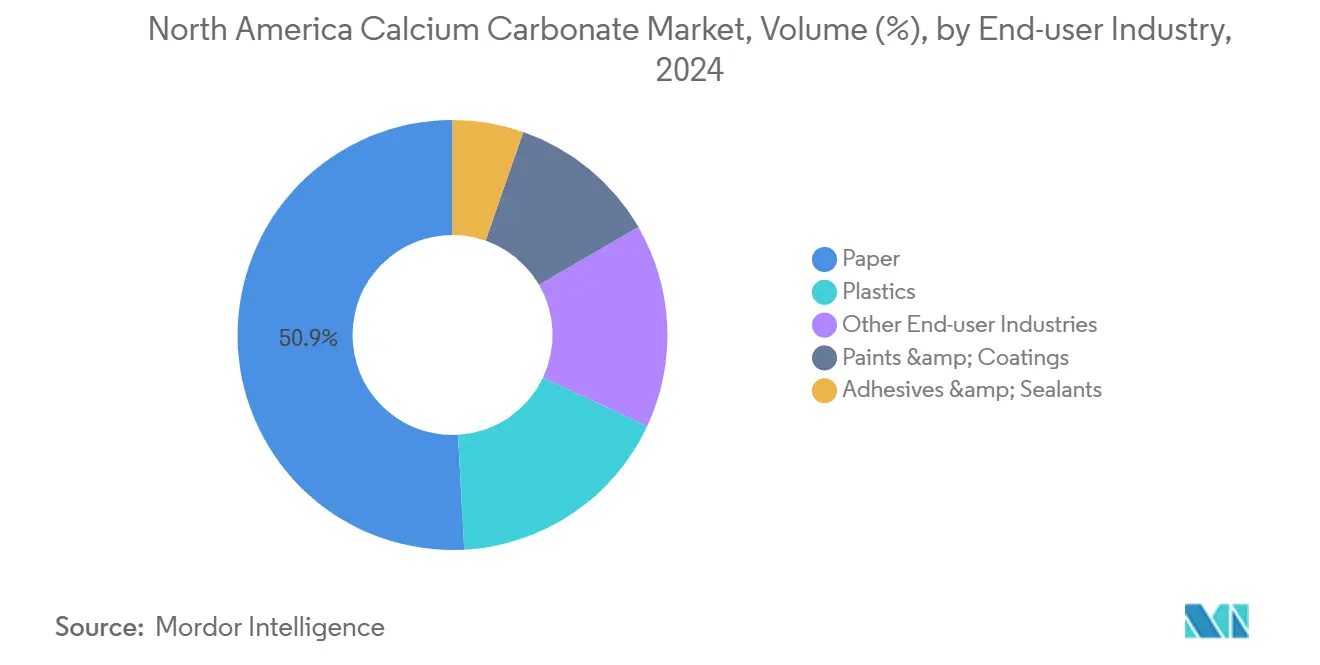
- The United States is expected to be the largest market for calcium carbonate during the forecast period.
- The United States is the second-largest producer of paper, globally, with China being the largest producer. The largest pulp and paper mill is in Memphis, Tennessee, and it is owned by International Paper.
- The country also exports large amounts of pulp and paper-related products to various countries, globally. However, the recent trends are hindering the growth in the demand for calcium carbonate in paper applications.
- The demand for adhesives and sealants, as well as paints and coatings, is hugely boosted by the burgeoning construction and transportation industries in the country. This unveils key opportunities for the growth of the calcium carbonate market.
- The healthcare sector is one of the most advanced sectors in the country. The increasing geriatric population and the growing requirement for medical facilities for the treatment of chronic diseases have been supporting the growth of the healthcare sector. These factors are also expected to boost the demand for calcium carbonate in the country.
- Owing to the growing end-user industries, the market for calcium carbonate in the country is estimated to witness a moderate growth during the forecast period.
Value Chain Analysis
The North America calcium carbonate value chain begins with quarrying high-calcium limestone, marble, or chalk, followed by crushing and grinding to produce ground calcium carbonate (GCC) or by chemical processing to make precipitated calcium carbonate (PCC). Key inputs and enablers include quarry permits and overburden handling, electricity and specialized milling/classification equipment for ultra-fine grades, and, for PCC routes, thermal energy (often natural gas) plus process control systems. Many downstream applications also rely on additives for surface treatment and coating to improve dispersion in plastics, paints, and sealants.
Production and supply models vary by end use. Producers include vertically integrated global suppliers such as Omya, Imerys, and Minerals Technologies Inc., along with regional processors. For large continuous consumers, including paper-related sites, companies often use satellite or co-located PCC/GCC supply arrangements, while commodity GCC supply tends to prioritize proximity to bulk users. Distribution depends on bulk logistics, including pneumatic conveying and bulk trucking or rail to mill and compounding clusters, which makes freight and terminal access a central cost driver. On the upstream side, new quarry development can face multi-year state environmental review processes, constraining greenfield capacity additions in some corridors due to permitting timelines.
Competitive Landscape
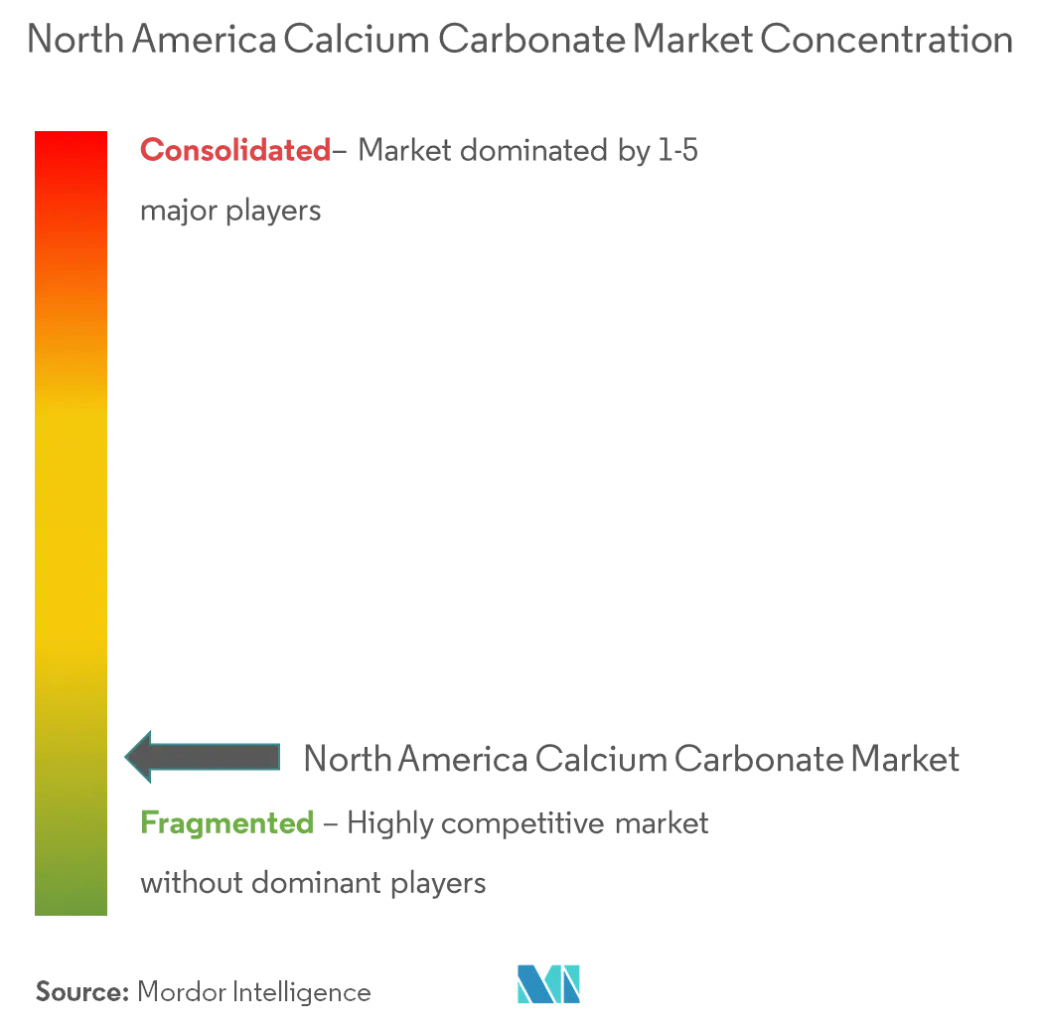
The North American calcium carbonate market is fragmented in nature, with only some of the top players accounting for a significant share of the market. The major companies include Omya AG, Imerys, Minerals Technologies Inc., Mississippi Lime Company, and JM Huber Corporation, among others.
North America Calcium Carbonate Industry Leaders
Omya AG
Imerys
Minerals Technologies Inc.
Mississippi Lime Company
J.M. Huber Corporation
- *Disclaimer: Major Players sorted in no particular order

Market Opportunities and Future Outlook
North America opportunity themes center on (1) higher-value specialty and surface-treated calcium carbonate for plastics, coatings, and sealants and (2) supply security for high-purity feedstock as producers consolidate and modernize industrial minerals operations. Consolidation around limestone and lime assets provides a visible anchor for this theme, including Martin Marietta Materials announcing a definitive agreement in June 2026 to acquire Lhoist North America for USD 13.5 billion. The announced transaction highlights the strategic value of high-quality carbonate reserves and integrated logistics in the region.
Producers are also funding plant projects and upgrades that can broaden available grades and improve operating efficiency for industrial mineral products. For example, United States Lime and Minerals reported progress in April 2026 on a new project at its Texas facility, with a targeted start-up in summer 2026, indicating continued investment in carbonate-related operations. For calcium carbonate suppliers, this context supports room for tailored grades that target particle-size control, brightness, and coated functionality, as well as service models that reduce customer handling costs through bulk delivery systems and on-site or satellite production where feasible, particularly for customers seeking consistency, traceability, and lower total delivered cost.
Recent Industry Developments
- June 2026: Imerys completed the acquisition of Great Lakes Minerals, a US-based processor of specialty minerals serving refractory and abrasives end markets. The deal strengthens Imerys North American footprint in specialty mineral processing and broadens its reach into industrial customers that specify consistent mineral performance and supply continuity.
- September 2025: Imerys formed a specialty distribution partnership with LBB Specialties, naming LBBS as the preferred distributor for the ImerCare product line across North America (including the United States, Canada, and Puerto Rico). The agreement expands route-to-market coverage for specialty mineral grades used in personal care and related formulations, improving availability and technical support for customers.
- September 2024: Minerals Technologies Inc. announced investments to expand capacity and upgrade plants in Dyersburg, Tennessee, and Brantford, Ontario, tied to manufacturing needs for its SIVO pet care business. The upgrades add regional production capability and can influence sourcing strategies for mineral-based inputs by increasing localized supply and reducing lead times.


Research Methodology Framework and Report Scope
Market Definition and Coverage
This market covers the value of calcium carbonate sold across North America for industrial use, including ground and precipitated forms, measured at the point where material is sold into downstream manufacturing and processing.
Scope exclusions: It excludes internal transfers within a single company, equipment used to process minerals, and downstream products where calcium carbonate is only an incidental ingredient.
Segmentation Overview
- Type
- Ground Calcium Carbonate
- Precipitated Calcium Carbonate
- End-user Industry
- Paper
- Plastic
- Adhesives and Sealants
- Paints and Coatings
- Other End-user Industries
- Geography
- United States
- Canada
- Mexico
Data Sources, Market Sizing, and Validation
Desk Research
Desk work starts by mapping the demand pool for calcium carbonate in North America and then linking it to measurable signals. We review public sources such as the USGS minerals statistics, US Census Bureau manufacturing datasets, USITC trade statistics, and Statistics Canada tables, which helps us frame volumes, trade flows, and end market direction.
On top of that, we pull context from company annual reports and investor presentations, technical papers in peer reviewed materials and coatings journals, and updates from industry associations that cover paper, plastics, and construction materials. For cross checks, we also use paid subscriptions for company financials and intelligence, patent databases, and shipment level import export datasets when country splits need to be validated. This list is not exhaustive, and other public sources were used for data collection, validation, and clarification during the study.
Primary Interviews and Surveys
Primary inputs are used to confirm how calcium carbonate demand is behaving by end use and to close gaps that desk sources do not explain well, including shifts between GCC and PCC and the effect of grade requirements. We speak with a mix of producers, distributors, and large end users across the United States, Canada, and Mexico, and then we tune the assumptions based on consistent answers across roles and geographies.
Distribution of primary research fieldwork respondents
| Company type | Respondent position |
|---|---|
| Top tier: 39% | CXOs: 14% |
| Mid tier: 47% | Functional/Unit leaders: 31% |
| Smaller Players: 14% | Managers: 55% |
Market-Sizing & Forecasting
Sizing is built from a top-down model where manufacturing output and trade data are used to reconstruct regional consumption, which is then allocated into major end uses using observed production patterns and industry usage ratios. Once the total is shaped, selective bottom-up checks are applied using sampled supplier revenues, channel feedback on average selling prices, and volume ranges by country, and then the totals are adjusted only when multiple checks point in the same direction.
A few practical inputs used in the model include North America paper and board output, plastics compounding and polymer consumption trends, construction activity indicators tied to coatings and sealants demand, import export movement of calcium carbonate and related mineral fillers, and typical price movements by grade and form where available. When a variable is not available for a smaller country or niche use, we bridge it using proxy indicators that track the end use, and we confirm the direction using interview feedback.
For forecasting, scenario analysis is used because the market depends on a handful of end markets that can move differently during cycles. Growth paths for paper, plastics, and coatings are projected first, and then calcium carbonate intensity per end use is refreshed based on expected substitution, filler loading trends, and compliance driven formulation changes.
Data Validation & Update Cycle
Validation is done through a set of cross checks that look for variance across independent signals, before the final numbers are locked. We compare the model output against country level trade direction, manufacturing momentum, and pricing reality checks, and any outliers are traced back to the assumption that created them.
A second analyst review is completed to confirm that conversions, country splits, and end use allocations align with the stated scope. If a material mismatch appears, the team recontacts sources to verify whether the change is real or driven by timing, currency, or reporting differences. The report is refreshed each year, and interim updates are made when large events such as capacity changes or sharp pricing moves materially alter the outlook, followed by a final pre delivery review to keep the view current.
Mordor Intelligence's North America Calcium Carbonate Market Size Compared With Other Published Estimates
Published market sizes for North America calcium carbonate can differ even when the topic label looks identical. Differences usually come from what each study counts as calcium carbonate revenue, how it treats imports and intercompany transfers, and how pricing is applied across grades and end uses.
By tracking end use demand signals and refreshing price and volume assumptions through interviews, Mordor Intelligence keeps the total tied to North America consumption rather than broad mineral filler spending that can pull in adjacent materials. Some sources use a single base year and then project forward with a higher growth curve, while others may include pharma and dietary supplement demand more aggressively even when industrial grade volumes dominate the region.
Benchmark comparison
| Source | Market Size | Gaps in Research Methodology |
|---|---|---|
| Mordor Intelligence | USD 12.34 B (2024) | |
| Global Consultancy A | USD 14.91 B (2022) | Uses an earlier base year and a broader application bucketing that can pull in higher value specialty use cases, and it is less explicit on how intercountry trade is netted out within North America. |
| Industry Publisher B | USD 14.26 B (2025) | Anchors on a later year and applies a faster growth path, which can inflate the near term size if price escalation and end use intensity are not rechecked against paper, plastics, and coatings demand realities. |
The spread in the table mainly comes from timing, plus how tightly the scope is limited to calcium carbonate sold into industrial end uses within the region. When the model is anchored to measurable output, trade signals, and end use pull through, the final number stays easier to explain and repeat, even when inputs need to be updated.


Key Questions Answered in the Report
What is the current North America Calcium Carbonate Market size?
The North America Calcium Carbonate Market is projected to register a CAGR of 1.02% during the forecast period (2026-2031)
Who are the key players in North America Calcium Carbonate Market?
Omya AG, Imerys, Minerals Technologies Inc., Mississippi Lime Company and J.M. Huber Corporation are the major companies operating in the North America Calcium Carbonate Market.
What years does this North America Calcium Carbonate Market cover?
The report covers the North America Calcium Carbonate Market historical market size for years: 2019, 2020, 2021, 2022, 2023 and 2024. The report also forecasts the North America Calcium Carbonate Market size for years: 2026, 2027, 2028, 2029, 2030 and 2031.
Page last updated on:


 Your data is secure and never sold or shared.


