Market Overview
| Study Period | 2020 - 2030 |
|---|---|
| Forecast Data Period | 2025 - 2030 |
| Historical Data Period | 2020 - 2023 |
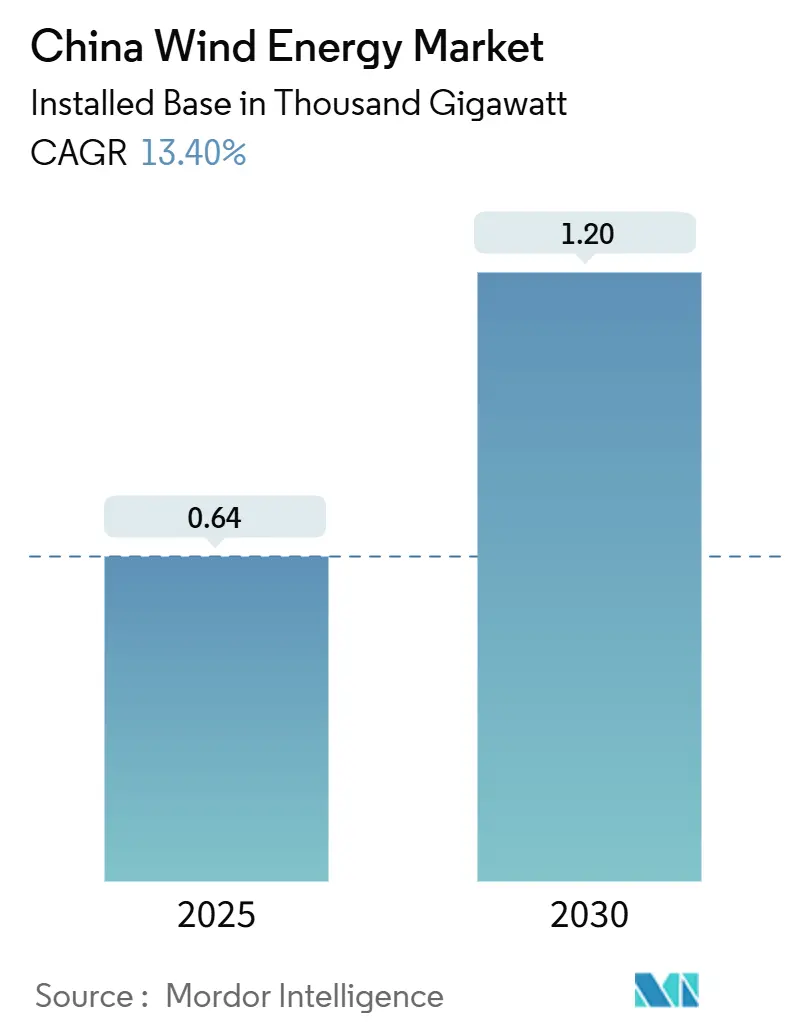
| Market Volume (2025) | 0.64 Thousand gigawatt |
| Market Volume (2030) | 1.20 Thousand gigawatt |
| Growth Rate (2025 - 2030) | 13.40% CAGR |
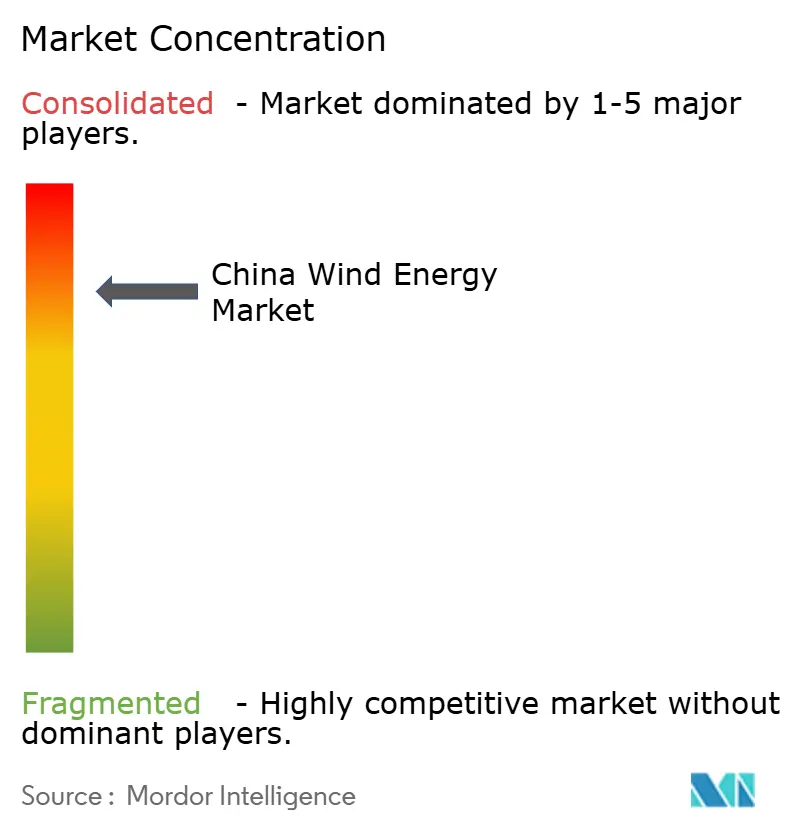
| Market Concentration | High |
Major Players *Disclaimer: Major Players sorted in no particular order Image © Mordor Intelligence. Reuse requires attribution under CC BY 4.0. | |
China Wind Energy Market Analysis by Mordor Intelligence
The China Wind Energy Market size in terms of installed base is expected to grow from 0.64 Thousand gigawatt in 2025 to 1.20 Thousand gigawatt by 2030, at a CAGR of 13.40% during the forecast period (2025-2030).
Beijing’s shift from feed-in tariffs to competitive, market-oriented pricing in February 2025 compels developers to prioritize grid-parity economics, accelerating large-scale project pipelines. Provincial renewable-energy portfolio standards now outpace national targets, concentrating new capacity in Inner Mongolia, Gansu, and Guangdong, where streamlined land-use approvals shorten development cycles.(1)California-China Climate Institute, “Provincial 14th Five-Year Plans,” ccci.berkeley.edu Record transmission investment of USD 88.7 billion by State Grid in 2025 eases curtailment concerns along the eastern seaboard and unlocks deep-water offshore resources. Meanwhile, rapid turbine scaling toward 8 MW and above lowers levelized costs, reinforcing wind’s cost competitiveness even in moderate resource zones.
Key Report Takeaways
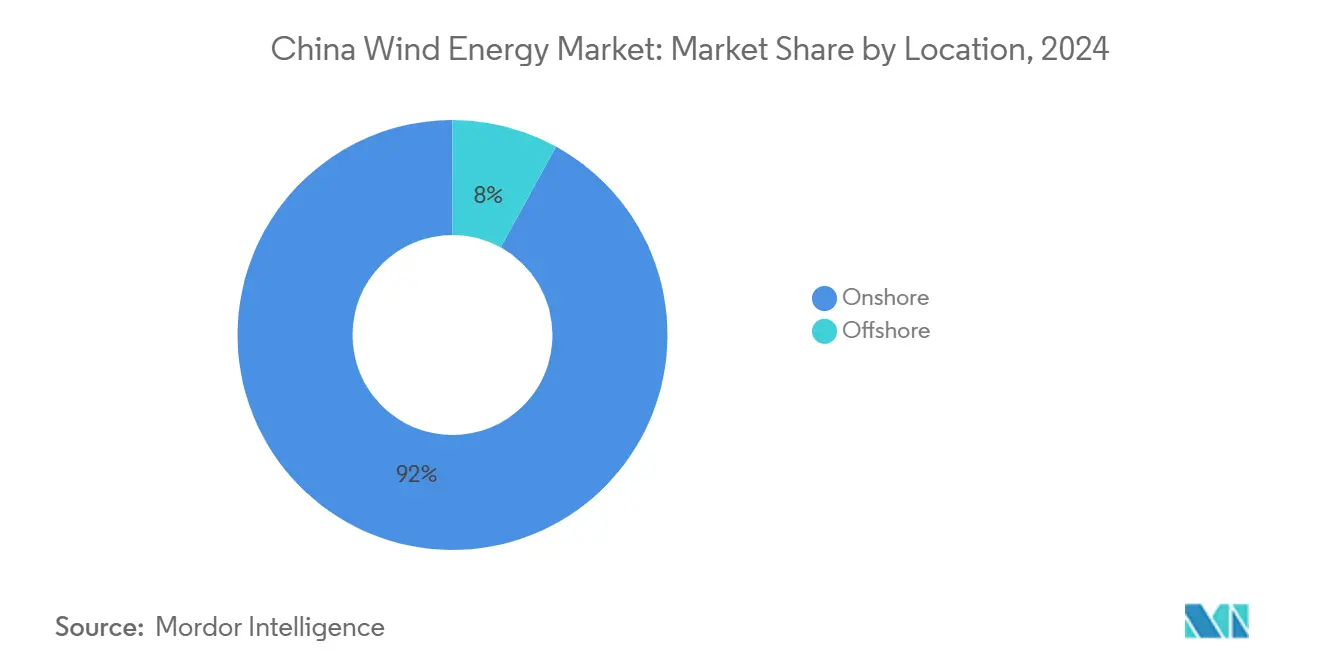
- By location, onshore installations led with 92% of the China wind energy market size in 2024, while offshore capacity is projected to advance at a 13.9% CAGR through 2030.
- By turbine capacity, the 3–6 MW class captured 51.3% share of the China wind energy market size in 2024; units above 6 MW are set to expand at a 24.3% CAGR between 2025 and 2030.
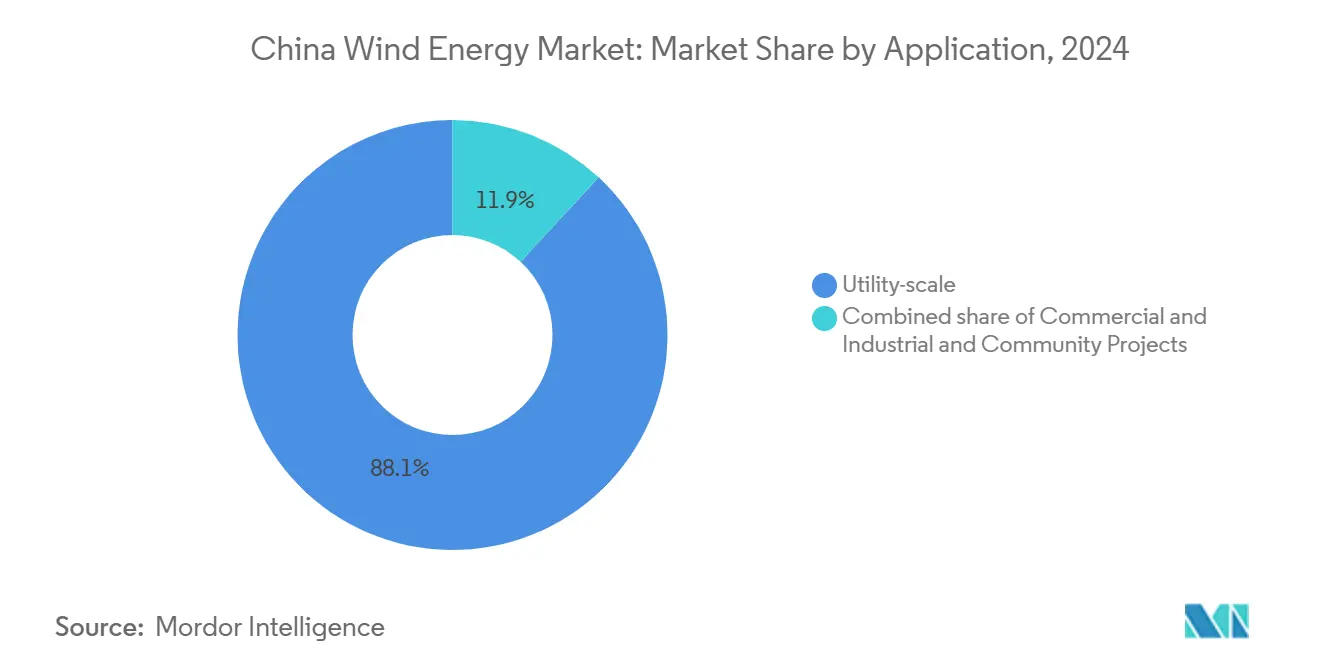
- By application, utility-scale projects commanded 88.1% of the China wind energy market size in 2024, whereas community projects are forecast to register a 23.5% CAGR to 2030.
- Xinjiang Goldwind, Envision Group, and Ming Yang Smart Energy together supplied more than 60% of new turbines in 2024
China Wind Energy Market Trends and Insights
Drivers Impact Analysis*
| Driver | (~) % Impact on CAGR Forecast | Geographic Relevance | Impact Timeline |
|---|---|---|---|
| Rapid expansion of provincial renewable-energy portfolio standards | +2.8% | National, early gains in Jiangsu, Guangdong, Shandong | Medium term (2-4 years) |
| Aggressive grid-parity auction pricing driving new capacity | +2.5% | High-wind provinces (Inner Mongolia, Gansu, Xinjiang) | Short term (≤2 years) |
| Declining LCOE for ≥8 MW turbines | +2.1% | Offshore coast and Inner Mongolia/Gansu onshore | Medium term (2-4 years) |
| Offshore-transmission build-out led by State Grid | +1.9% | Coastal provinces (Jiangsu, Guangdong, Shandong, Fujian) | Long term (≥4 years) |
| Repowering of first-generation wind farms | +1.2% | Inner Mongolia, Gansu, Xinjiang | Medium term (2-4 years) |
| Hybrids with solar & storage | +0.9% | Western provinces (Qinghai, Inner Mongolia, Gansu, Xinjiang) | Long term (≥4 years) |
| Source: Mordor Intelligence | |||


Rapid Expansion of Provincial Renewable-Energy Portfolio Standards
Provincial mandates now exceed national goals, creating localized demand spikes that pull new projects into approval pipelines before schedule. Inner Mongolia’s 134 GW wind-solar goal for 2025 equals 11% of the national ambition and signals how local targets reshape developer site selection. Shandong plans 35 GW of offshore wind by 2030, steering capital toward deep-water engineering hubs along the Bohai Rim. As provinces race to meet self-imposed quotas, they bundle land-use rights with supply-chain incentives that favor domestic turbine vendors and shorten permitting cycles.(2)Bureau, “Solar Tariff Benchmarks,” asian-power.com These standards feed the Chinese wind energy market with a reliable queue of shovel-ready projects that sustain manufacturing capacity utilization.
Aggressive Grid-Parity Auction Pricing Driving New Capacity
Since February 2025, developers bid for offtake without feed-in tariff cushions, and winning prices now fall below CNY 0.40 per kWh in high-wind corridors, a level on par with coastal coal power. The auction format rewards scale, so integrated players like China Three Gorges secure larger blocks and spread fixed costs across gigawatt portfolios.(3)Editorial Desk, “China’s Renewable Auctions,” scmp.com Lower clearing prices sharpen focus on turbine efficiency and O&M savings, pushing suppliers to release higher-capacity machines faster. Consolidation is accelerating because smaller firms lack the balance-sheet strength to survive thin margins, which increases concentration in the Chinese wind energy market. Site selection has become data-driven, emphasizing locations with low curtailment and firm transmission access that safeguard merchant revenues.
Declining LCOE for ≥8 MW Turbines
Chinese manufacturers commissioned 16 MW offshore units in 2024 and unveiled a 26 MW model in 2025, doubling nameplate capacity in less than two years. Larger rotors capture stronger winds aloft, raising capacity factors and cutting energy costs, which widens the economically viable map beyond premium wind belts. Balance-of-system savings follow because fewer foundations, cables, and substations are needed per installed gigawatt. The technology leap also benefits onshore repowering, where bigger turbines on existing pads double annual output without new land take. As economies of scale deepen, the Chinese wind energy market sees cost curves that rival new coal in most provinces.
Offshore-Transmission Build-Out Led by State Grid
State Grid allocated USD 88.7 billion for 2025 transmission upgrades, including China’s first ±400 kV flexible DC link at Rudong that ships power more than 100 kilometers offshore. High-voltage DC lowers losses and enables clustering of multiple wind farms onto shared export cables, which trims connection fees for developers. Deep-water resources in 50-meter seas become bankable once grid access is firm, tripling the exploitable offshore wind area compared with near-shore zones.(4)GOV Information Office, “Energy Law Comes into Force,” gov.cn Eastern demand centers receive cleaner power and fewer curtailment events, reinforcing provincial decarbonization goals. The build-out, therefore, locks in long-term growth for the Chinese and energy market along the coast.
Restraints Impact Analysis*
| Restraint | (~) % Impact on CAGR Forecast | Geographic Relevance | Impact Timeline |
|---|---|---|---|
| Rising curtailment risk in weak-grid western provinces | −1.4% | Gansu, Xinjiang, Qinghai, Inner Mongolia | Short term (≤2 years) |
| Competition from record-low solar PPA tariffs | −1.1% | National, acute in Qinghai, Xinjiang, Inner Mongolia | Medium term (2-4 years) |
| Supply-chain bottlenecks for XL monopiles & vessels | −0.8% | Jiangsu, Guangdong, Fujian, Shandong | Short term (≤2 years) |
| Stricter land-use approvals near cropland | −0.6% | Jiangsu, Shandong, Henan, Anhui | Medium term (2-4 years) |
| Source: Mordor Intelligence | |||
Rising Curtailment Risk in Weak-Grid Western Provinces
Wind curtailment reached 6.2% in early 2025, up from 4.0% in 2024, with Tibet peaking at 27.5%, signaling that transmission still lags generation.(5)Analysts, “Curtailment Update,” belfercenter.org Western grids were designed for coal dispatch and struggle to balance variable output, especially during seasonal demand lulls. Must-run cogeneration plants in northern heating zones further crowd out wind, forcing operators to idle turbines and eroding project cash flows. Although new UHV lines are under construction, they will not relieve bottlenecks before 2027, so developers factor higher curtailment into financial models. Despite strong policy tailwinds, persistent curtailment tempers near-term growth expectations in the Chinese wind energy market.
Competition from Record-Low Solar PPA Tariffs
Utility-scale solar PPAs fell below CNY 0.30 per kWh in 2024 in high-irradiance provinces, undercutting wind bids for the same grid quota. Solar arrays deploy faster and face fewer land-use conflicts, enabling local officials to meet renewable targets quickly. Hybrid wind-solar designs can reduce curtailment by blending complementary generation profiles, yet they also split scarce transmission capacity. In procurement auctions, grid planners often favor the cheapest megawatt-hour, so low solar prices push wind developers to sharpen cost structures and adopt larger turbines. Unless wind maintains its cost decline trajectory, solar gains could siphon share from the Chinese wind energy market during the forecast window.
*Our forecasts treat driver/restraint impacts as directional, not additive. The impact forecasts reflect baseline growth, mix effects, and variable interactions.
Segment Analysis
By Location: Offshore Acceleration Reshapes Coastal Strategy
Offshore capacity is on track to expand at a 13.9% CAGR, far outpacing onshore additions and elevating the China wind energy market size along coastal provinces. Onshore still accounted for 92% of the installed volume in 2024, supported by a capital expenditure (capex) of USD 1.2 million per MW, compared to roughly USD 2.5 million offshore, and by streamlined supply chains that deliver turbines within 12-month cycles. Jiangsu already operates 12 GW of offshore wind and targets 25 GW by 2030, leveraging shallow depths of 10–40 m and provincial subsidies that bridge the remaining cost gaps. Guangdong is moving toward floating foundations for depths exceeding 50 m, where a 100 MW demonstration has validated semi-submersible designs that can unlock 200 GW of deepwater resource potential.
Onshore growth is tilting toward repowering; Inner Mongolia’s 8 GW pipeline will replace 1.5 MW machines with 3–5 MW platforms, boosting site capacity factors from 28% to 42% without requiring new land. Offshore enjoys superior 45%+ capacity factors in Guangdong and Fujian, and minimal transmission losses, partly offsetting its higher capital expenditures. Shandong exploits local shipyards to fabricate monopiles domestically, cutting project costs by 15% and reinforcing its status as an offshore supply-chain hub. Floating platforms also sidestep fishing-zone conflicts and shipping lanes in Zhejiang, where the continental shelf drops sharply 30 km from shore, making fixed foundations uneconomic. Combined, these trends are reshaping capacity geography and tilting more of the China wind energy market toward the coast.


By Turbine Capacity: Platforms Above 6 MW Redefine Economics
The >6 MW class will grow at a 24.3% CAGR, compressing the supplier landscape yet lifting the overall China wind energy market share for large machines. In 2024, 3–6 MW turbines still held a 51.3% share of the China wind energy market size, as they fit existing onshore logistics and crane limits. Ming Yang’s 260-m-rotor 20 MW offshore unit slashes turbines per gigawatt from 200 to 50, trimming foundations and cables 30% and lifting capacity factors to 50% on select Guangdong sites. Onshore, 8–10 MW models open moderate wind corridors in Hebei and Liaoning that were previously uneconomic, expanding the buildable map by roughly 15 GW.
Sub-3 MW machines now target distributed or repowering projects where crane capacity or road access caps component size. CSIC Haizhuang’s direct-drive 18 MW turbine reduces offshore maintenance by 12% by eliminating gearboxes, thereby shrinking downtime windows that average USD 100,000 per vessel per day. Larger ratings require blade plants capable of 100-m molds, prompting CNY 8 billion of 2024 capacity investments by Goldwind, Envision, and Ming Yang, moves that squeeze smaller OEMs out of the market. International brands, such as Vestas, focus on premium service contracts rather than volume, accepting a single-digit local market share amid domestic price pressure. Size escalation also simplifies permitting by letting developers meet capacity targets with fewer turbines, shortening approval queues by up to nine months.
By Application: Community Projects Tap Distributed Ownership Models
Utility-scale assets held 88.1% of 2024 installations, reflecting economies of scale, low-cost debt from policy banks, and easier PPA negotiations with provincial grid companies. Yet community wind is poised for a 23.5% CAGR as village cooperatives claim direct dividend streams and smooth land acquisition; a 200 MW Hebei project pays each household CNY 3,000 annually and reserves local O&M jobs. Cooperative structures experience a financial close that is extended by three to six months because banks require blended concessional loans and equity; however, local acceptance often offsets this delay.
Commercial and industrial wind remains a niche market, limited by zoning and interconnection hurdles, yet it offers behind-the-meter power to steel mills and data centers, hedging them against volatile grid tariffs and earning tradable green certificates priced at CNY 0.08 / kWh. A 50 MW Hebei industrial project cut grid purchases by 30% and lifted returns by four points through certificate revenue. Community ownership also defuses rural resistance in densely farmed Shandong, where provincial planners now earmark capacity quotas specifically for cooperatives. Together, these trends diversify participation and embed social buy-in, although utility-scale dominance is expected to persist through 2030.
Geography Analysis
The Three North provinces, Northeast, North, and Northwest, hosted 58% of installed capacity in 2024, anchored by Inner Mongolia’s 134 GW wind-solar target for 202, which equals 11% of the China wind energy market size earmarked for that horizon. Northwest grids exported 100.5 billion kWh of renewable electricity in 2024, the first time any Chinese region crossed the 100 billion-kWh mark, underscoring a west-to-east power-flow pattern that widens the China wind energy market’s geographic footprint. Despite these milestones, curtailment climbed to 6.2% in early 2025 and hit 27.5% in Tibet, reflecting transmission build-outs that still trail generation growth. Provincial operators respond by favoring hybrids that pair wind with solar or storage, which raises dispatch priority and trims lost output during seasonal troughs. Repowering projects in Inner Mongolia and Xinjiang now install 6 MW turbines on legacy pads, doubling site-level capacity factors without expanding land use.
Eastern coastal provinces drive offshore momentum by marrying superior marine winds close to demand centers. Guangdong alone targets 17 GW of offshore turbines by 2025, channeling shipyard investment into monopile fabrication and installation-vessel fleets that support a fast-growing slice of the China wind energy market. Jiangsu leverages the Rudong ±400 kV flexible DC link to evacuate generation from 50-meter-depth arrays more than 100 km offshore, cutting line losses and curtailment risk. Fujian tests floating platforms in 120-meter waters, expanding the exploitable area threefold compared with fixed-foundation zones. Coastal developers secure premium merchant tariffs because power arrives near industrial load centers, offsets higher construction costs, and encourages 16 MW-plus turbine deployments that lift energy yield per foundation.
Central and southwestern provinces shape a complementary dynamic where hydropower variability determines wind dispatch priority. Wet-season water inflows from Sichuan and Yunnan create surplus hydro that can absorb wind only when reservoir releases are throttled, while dry-season deficits elevate wind’s grid value and stabilize renewable supply. Limited east-bound transmission in these mountainous regions curbs the pace of new builds, yet local governments deploy community-scale turbines to meet distributed energy goals and hedge hydro shortfalls. Stricter land-use approvals near high-value agricultural zones slow ground-mount projects in Hubei and Hunan, redirecting capital toward rooftop or hillside sites that minimize farmland conversion. These regional contrasts diversify revenue streams and broaden risk profiles within the China wind energy market.
Competitive Landscape
Domestic OEMs intensified their global ascent in 2024 when Goldwind (19.3 GW), Envision (14.5 GW), Windey (12.5 GW), and Mingyang (12.2 GW) seized the top four worldwide installation spots, collectively altering supply-chain power balances that once favored European brands. Their 30–40% cost advantage stems from vertically integrated steel, blade, and generator lines that compress lead times and shield margins against steel-price volatility. Rapid product scaling is another differentiator: Dongfang Electric jumped from 16 MW to 26 MW offshore prototypes in only 18 months, an interval that once spanned full product life cycles, and has already logged pre-orders from Guangdong developers.
Strategic alliances enhance export reach. Mingyang's joint venture with BASF pairs turbine know-how with chemicals expertise to build a 500 MW offshore array that will supply renewable power directly to an integrated petrochemical park in Guangdong, forming a replicable template for industry-anchored projects. Goldwind acquired GE's Camaçari factory in Brazil in April 2024, fulfilling local-content rules that unlock Brazilian Development Bank financing and positioning the firm for Latin American bids that further scale the China wind energy market's manufacturing engine. Dajin Heavy Industry's USD 135 million monopile order from a European developer signals acceptance of Chinese foundations in mature European waters, widening profit pools beyond domestic installations.
Innovation pipelines stay active through digital and grid-integration patents. Chinese entities represented 25% of global grid-technology filings in 2022, led by digital twins that predict blade fatigue and optimize O&M schedules for far-offshore fleets. CRRC's "Qihang" 20 MW floating turbine prototype integrates direct-drive generators and active ballast, positioning the company for deep-water tenders where fixed foundations prove uneconomic. Yet policy screens in the United States and Europe limit unfettered market entry, prompting Chinese OEMs to explore joint ventures that bundle low-cost hardware with local project equity to satisfy security reviews. Overall, cost leadership, accelerated R,&D and agile partnership models cement a high-concentration structure in China's wind energy market.
China Wind Energy Industry Leaders
ENVISION GROUP
Xinjiang Goldwind Science & Technology Co., Ltd.
Shanghai Electric Group Company Limited
Ming Yang Smart Energy
Vestas Wind Systems
- *Disclaimer: Major Players sorted in no particular order

Recent Industry Developments
- May 2025: China Dongfang Electric Corporation unveiled the world's largest offshore wind turbine with 26 MW capacity and 185-meter hub height, capable of generating 100 million kWh annually and powering 55,000 homes while reducing coal consumption by 32,000 tons annually.
- April 2025: CRRC unveiled the “Qihang” 20 MW floating wind turbine, establishing China’s leadership in ultra-large floating technology and surpassing current Western specifications.
- March 2025: Orient Cable reported overseas revenue of RMB 733 million (USD 102 million) and an order backlog of RMB 17.975 billion (USD 2.5 billion), confirming strong global demand for Chinese subsea cables.
- January 2025: CRRC Wind Power installed the world's largest floating offshore wind turbine in China, marking a significant advancement in deep-water wind energy technology and demonstrating the viability of floating platforms for commercial applications


China Wind Energy Market Report Scope
Wind energy is the energy obtained from the force of the wind. The energy is mainly extracted from the rotor, which transforms kinetic energy into mechanical energy, and from the generator, which transforms this mechanical energy into electrical energy. The market in the report considers the cumulative installed capacity of wind energy projects and upcoming projects in China annually. The market sizes and forecasts were made for each segment based on installed capacity.
The China wind energy market report includes:
By Location
| Onshore |
| Offshore |
By Turbine Capacity
| Up to 3 MW |
| 3 to 6 MW |
| Above 6 MW |
By Application
| Utility-scale |
| Commercial and Industrial |
| Community Projects |
By Component (Qualitative Analysis)
| Nacelle/Turbine |
| Blade |
| Tower |
| Generator and Gearbox |
| Balance-of-System |
| By Location | Onshore |
| Offshore | |
| By Turbine Capacity | Up to 3 MW |
| 3 to 6 MW | |
| Above 6 MW | |
| By Application | Utility-scale |
| Commercial and Industrial | |
| Community Projects | |
| By Component (Qualitative Analysis) | Nacelle/Turbine |
| Blade | |
| Tower | |
| Generator and Gearbox | |
| Balance-of-System |


Key Questions Answered in the Report
How large is China’s wind build-out plan for 2030?
National capacity is forecast to hit 1,200 GW by 2030, growing at a 13.4% CAGR under the China wind energy market outlook.
What CAGR is expected for Chinese offshore wind through 2030?
Offshore installations are projected to expand at a 13.9% CAGR for 2025–2030.
Which turbine size segment is growing fastest?
Platforms above 6 MW are forecast to rise at a 24.3% CAGR, driven by 15–20 MW offshore units and 8–10 MW onshore machines.
Why are curtailment rates higher in western provinces?
Limited transmission to eastern load centers and inflexible coal baseloads force grid operators to shed 5–7% of potential wind output in Gansu and Xinjiang.
How do community wind projects benefit rural areas?
Village cooperatives receive direct dividends, averaging CNY 3,000 per household annually, and gain priority for local O&M employment.
Which companies dominate China’s turbine supply?
Xinjiang Goldwind, Envision Group, and Ming Yang Smart Energy together accounted for more than 60% of 2024 installations.
Page last updated on:


