Market Overview
| Study Period | 2021 - 2031 |
|---|---|
| Forecast Data Period | 2026 - 2031 |
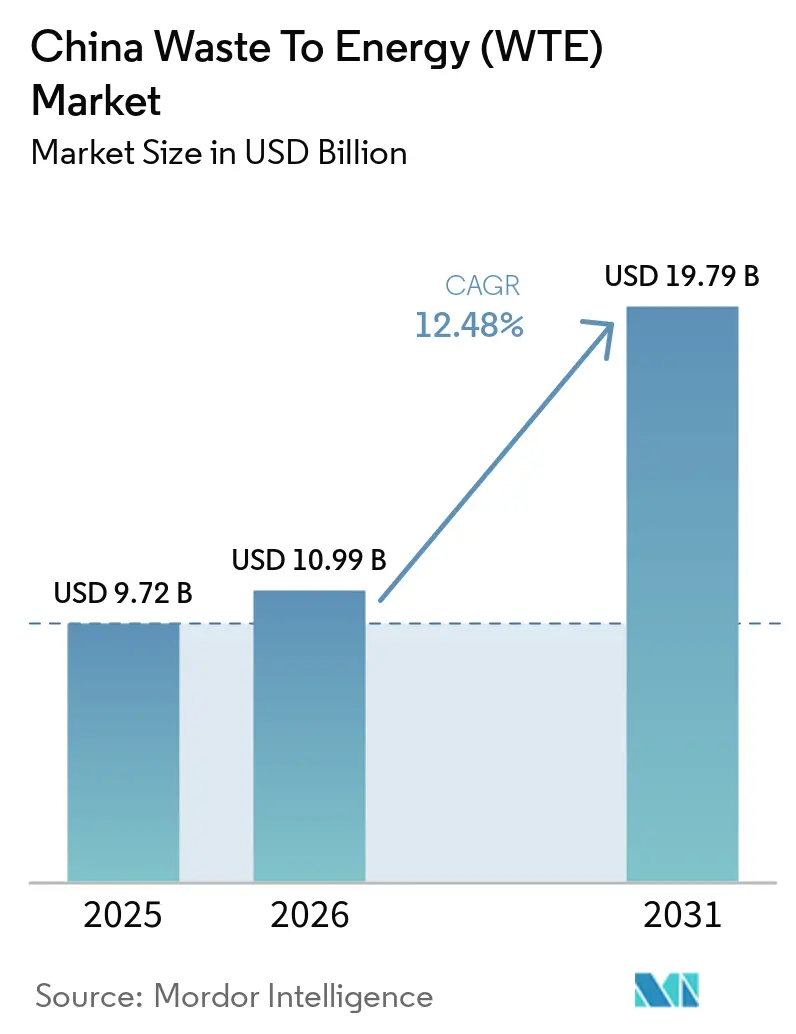
| Base Year Market Size (2025) | USD 9.72 Billion |
| Market Size (2026) | USD 10.99 Billion |
| Market Size (2031) | USD 19.79 Billion |
| Growth Rate (2026 - 2031) | 12.48% CAGR |
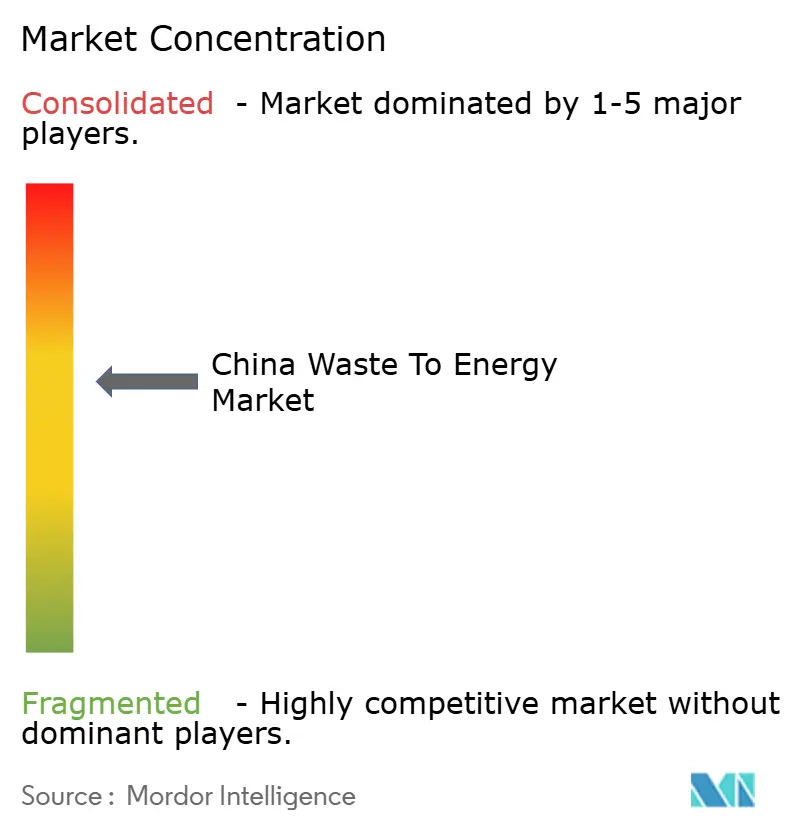
| Market Concentration | Medium |
Major Players *Disclaimer: Major Players sorted in no particular order Image © Mordor Intelligence. Reuse requires attribution under CC BY 4.0. | |
China Waste To Energy (WTE) Market Analysis by Mordor Intelligence
The China Waste To Energy Market size is expected to increase from USD 9.72 billion in 2025 to USD 10.99 billion in 2026 and reach USD 19.79 billion by 2031, growing at a CAGR of 12.48% over 2026-2031. Demand stems from landfill‐diversion mandates, carbon-neutrality goals, and provincial subsidies that push operators toward ultra-supercritical retrofits, biomethane upgrading, and combined heat and power configurations. At the same time, utilization plateaus near 73% because mandatory household waste sorting and rising recycling rates siphon high-calorific fractions away from incinerators. Operators are therefore focusing on process automation, feedstock diversification into agricultural residues, and revenue stacking from district-heating steam and transport fuels. Subsidized lending from China Development Bank and green-bond eligibility accelerate these upgrades, yet tightening emission caps under GB 18485-2025 raise compliance costs for 320 legacy plants.
Key Report Takeaways
- By technology, thermal routes led with 77.1% revenue share in 2025, whereas biological treatment is forecast to expand at a 17.8% CAGR through 2031.
- By waste type, municipal solid waste held a 74.8% share in 2025, and agricultural residues are advancing at a 15.6% CAGR to 2031.
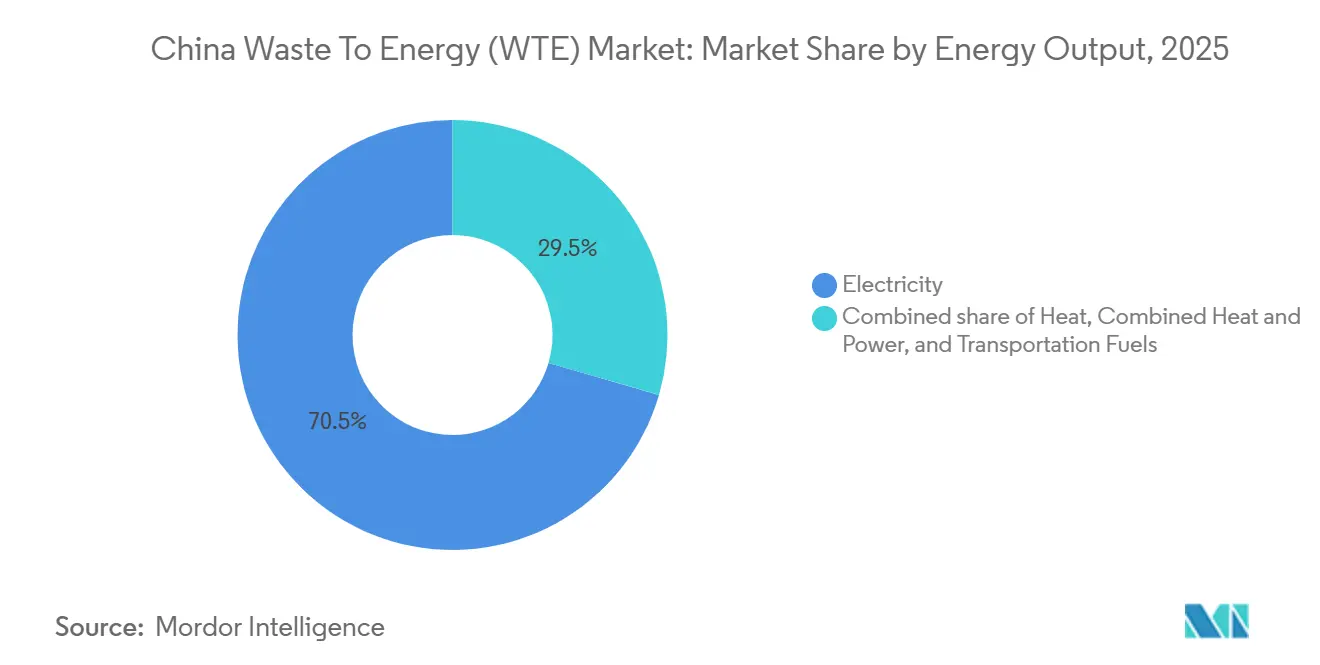
- By energy output, electricity dominated with 70.5% of the China waste to energy market size in 2025, while transport fuels are projected to grow at an 18.5% CAGR through 2031.
- By end-user, utilities and independent power producers captured 76.9% of demand in 2025, and transport fuel distributors recorded the highest forecast CAGR at 18.4%.
Note: Market size and forecast figures in this report are generated using Mordor Intelligence’s proprietary estimation framework, updated with the latest available data and insights as of January 2026.
China Waste To Energy (WTE) Market Trends and Insights
Drivers Impact Analysis*
| Driver | (~) % Impact on CAGR Forecast | Geographic Relevance | Impact Timeline |
|---|---|---|---|
| Grid-Parity Large-Scale Incinerator Retrofits (Ultra-Supercritical) | 2.8% | National, with concentration in Guangdong, Zhejiang, Jiangsu, Shandong | Medium term (2-4 years) |
| National Zero-Waste City Roll-out (113 cities by 2027) | 2.5% | National, with early gains in Beijing, Shanghai, Shenzhen, Chengdu | Short term (≤ 2 years) |
| AI-Optimised Dispatch of CHP Exports to District Heating | 1.2% | Northern provinces (Beijing, Tianjin, Hebei, Liaoning, Jilin) | Medium term (2-4 years) |
| Provincial RDF Blending Mandates for Cement Kilns | 1.5% | Henan, Anhui, Shandong, Hubei (cement production hubs) | Long term (≥ 4 years) |
| Mainstream Policy-Driven Gate Fees & FIT Subsidies | 1.8% | National, with higher gate fees in Tier-1 cities (Beijing, Shanghai, Shenzhen, Guangzhou) | Short term (≤ 2 years) |
| Under-the-Radar High-Value Plastics Segregation Boosting LHV | 0.9% | Tier-1 and Tier-2 cities with mandatory waste sorting (Shanghai, Beijing, Shenzhen, Guangzhou, Hangzhou, Ningbo) | Medium term (2-4 years) |
| Source: Mordor Intelligence | |||
Grid-Parity Large-Scale Incinerator Retrofits (Ultra-Supercritical)
Ultra-supercritical boilers operating above 25 megapascals and 580 °C raise net thermal efficiency to 32–35%, allowing plants to sell power at market rates without feed-in tariffs. Shenzhen Energy’s Baoan Phase III plant, commissioned in 2025, produces 550 kWh per tonne of waste and won a 15-year power purchase agreement that undercuts coal dispatch costs. A National Energy Administration circular encourages retrofitting 180 plants above 1,200 t/d, backed by USD 1.67 billion in China Development Bank loans. Retrofit economics depend on long-term offtake contracts because spot power prices in eastern provinces dipped 12% in 2025, stretching payback periods to 11 years. Skilled labor shortages in ultra-supercritical boiler operation have prompted partnerships with Mitsubishi Heavy Industries and Hitachi Zosen for technology transfer.[1]National Energy Administration, “Notice on Ultra-Supercritical Retrofit Promotion,” National Energy Administration, nea.gov.cn
National Zero-Waste City Roll-Out (113 Cities by 2027)
The framework mandates 60% landfill diversion by 2027, guaranteeing baseline feedstock for thermal and biological projects. The 113 pilot cities handled 48% of national urban waste in 2025 and allocated USD 11.82 billion to waste infrastructure, 40% of which funds anaerobic digestion. Chengdu alone budgeted USD 445.12 million for four digesters that will yield 180 million m³ of biogas annually for buses and district heating. Projects aligned with municipal master plans secure environmental permits in 14 months versus 24 months previously, trimming pre-construction financing costs by about 20%.[2]Ministry of Ecology and Environment, “Zero-Waste City Implementation Guidelines,” Ministry of Ecology and Environment, mee.gov.cn
AI-Optimised Dispatch of CHP Exports to District Heating
Machine-learning systems balance steam extraction and electricity generation to maximize revenue. Beijing Enterprises Environment’s Gaoantun plant lifted its annual income by 18% in 2025 by integrating weather and price forecasts. Northern provinces now require cities above 1 million population to source at least 15% of heating from waste or biomass by 2028. Upfront investment of USD 2.09–3.48 million for sensors and control software limits adoption to top-tier operators, yet those systems shield plants from power-curtailment risk during winter peaks.
Provincial RDF Blending Mandates for Cement Kilns
Henan, Shandong, Anhui, and Hubei require 10–20% coal substitution with refuse-derived fuel by 2028. Henan licensed 18 preprocessing hubs with 12,000 t/d combined throughput, supplying kilns that pay USD 5.56–8.35 million per tonne tipping fees. Average blending reached 8% in 2025, displacing 6.2 million t of coal. Quality variability remains a constraint, prompting pilot extended producer responsibility programs that move packaging-recycling funds into RDF production.
Restraints Impact Analysis*
| Restraint | (~) % Impact on CAGR Forecast | Geographic Relevance | Impact Timeline |
|---|---|---|---|
| Stricter Dioxin/Furan Emission Caps (GB 18485-2025) | -1.8% | National, with acute impact on plants commissioned before 2016 | Short term (≤ 2 years) |
| Mainstream Rising Public Opposition & Social Licence Costs | -1.2% | National, with acute incidents in Guangzhou, Wuhan, Chengdu, Hangzhou, Nanjing | Short term (≤ 2 years) |
| Under-the-Radar Recycling-Led Feedstock Shortfalls in Tier-1 Cities | -1.5% | Shanghai, Beijing, Shenzhen, Guangzhou, Hangzhou, Nanjing, Suzhou | Medium term (2-4 years) |
| Volatile Carbon Credit Prices Reducing PPP IRRs | -0.8% | National, with higher exposure in projects relying on CCER revenue (biogas, biomethane facilities) | Medium term (2-4 years) |
| Source: Mordor Intelligence | |||
Stricter Dioxin/Furan Emission Caps (GB 18485-2025)
The new standard halves allowable dioxin emissions to 0.05 ng TEQ/m³ and mandates continuous monitoring. Compliance needs USD 3.48–5.56 million per plant for activated-carbon injection and real-time analyzers, slicing operating margins by up to 6 percentage points. Roughly 320 plants built before 2016 face retrofit or closure. Early movers such as Zhejiang Weiming Environment leverage compliance readiness to win 20-year concessions with inflation-indexed gate fees.[3]Ministry of Ecology and Environment, “GB 18485-2025 Consultation Draft,” Ministry of Ecology and Environment, mee.gov.cn
Recycling-Led Feedstock Shortfalls in Tier-1 Cities
Mandatory sorting diverts 25–35% of municipal waste mass, yet mostly plastics, paper, and textiles that have a lower heating value. Shanghai plants saw calorific value fall 14% between 2023 and 2025, forcing 18% more natural-gas co-firing. Utilization dropped to 78%, cutting gate-fee income by USD 58.42 million. Operators now import residual waste from neighboring provinces or co-process sewage sludge at premium disposal fees, but interprovincial approvals average nine months.[4]Shanghai Municipal Government, “2025 Waste Sorting Progress Report,” Shanghai Municipal Government, sh.gov.cn
*Our forecasts treat driver/restraint impacts as directional, not additive. The impact forecasts reflect baseline growth, mix effects, and variable interactions.
Segment Analysis
By Technology: Anaerobic Digestion Accelerates Within a Thermal-Dominant Mix
Thermal schemes controlled 77.1% of the Chinese waste-to-energy market in 2025, supported by proven GB 18485 pathways and high tolerance of mixed waste streams. Biological treatment is gaining traction at a 17.8% CAGR because biogas attracts carbon credits and renewable gas certificates. Gasification and pyrolysis remain niche at under 2% of capacity due to tar handling and high capital intensity.
Anaerobic digestion benefits from the relaunch of the China Certified Emission Reduction scheme, which paid an average USD 13.21 per tonne CO₂-eq in 2025, boosting project revenues by up to 18%. The National Energy Administration aims to triple digestion capacity to supply 30 billion m³ of biogas by 2030. This trajectory positions biological routes to gradually erode thermal dominance, though incineration still tolerates 60% moisture and unsorted feed, a capability unmatched by digestion or RDF lines.


By Waste Type: Rural Residues Grow Faster Than Urban Waste Streams
Municipal solid waste represented 74.8% of throughput in 2025, yet agricultural and agro-industrial residues are growing at 15.6% CAGR under straw-utilization mandates that target 60% recovery by 2028. Industrial solid waste contributed 12% of feedstock, and sewage sludge 5%.
Seasonality and storage costs challenge straw projects, yet USD 6.96–11.13 per tonne collection subsidies and flexible feed-in-tariff quotas improve economics. Sludge co-incineration attracts disposal fees twice those of household waste, helping urban operators backfill capacity lost to recycling. These trends broaden the resource base for the Chinese waste-to-energy market while aligning with rural revitalization policies.
By Energy Output: Transport Fuels Offer the Next Growth Curve
Electricity retained a 70.5% value share in 2025. However, bio-SNG, bio-LNG, and ethanol are expanding at 18.5% CAGR thanks to a 10% renewable content requirement for heavy-duty vehicle fuel by 2030. PetroChina and Sinopec signed 15-year biomethane offtake contracts at 25–30% price premiums over fossil gas, accelerating project bankability.
Combined heat and power plants, 18% of capacity in 2025, achieve 65% thermal efficiency and earn higher revenue per tonne of waste, yet are limited to northern provinces with long heating seasons. Transport-fuel production is capital-intensive, bio-LNG liquefaction costs USD 16.69–25.04 million per 100 million m³ yearly capacity, but benefits from green bonds priced 80–120 bps below commercial loans.
By End-User: Utilities Still Dominate, Fuel Distributors Scale Fastest
Utilities and independent power producers bought 76.9% of output in 2025 under public-private partnership concessions. Transport-fuel distributors are the fastest-growing customers at 18.4% CAGR, procuring biomethane blends to satisfy renewable-fuel mandates.
Utilities face shrinking feed-in-tariff support and tougher gate-fee negotiations, prompting them to diversify into operations-and-maintenance services. Industrial captive plants in food, paper, and chemicals use on-site waste to slash energy costs and meet zero-landfill rules, accounting for 7% of capacity in 2025.
Geography Analysis
Coastal provinces such as Guangdong, Zhejiang, Jiangsu, and Shandong host over 50% of national capacity, yet inland regions draw increasing subsidies under the 14th Five-Year Plan. Guangdong alone ran 98,000 t/d of incinerators in 2025, produced 14.2 TWh of power, and earned USD 166.92 million in carbon credits. Zhejiang’s Zero-Waste Province initiative funds anaerobic digestion with guaranteed gate fees of USD 16.69 million per tonne for organics.
Tier-1 cities now grapple with feedstock deficits. Beijing’s plants worked at 76% utilization in 2025 and import 1,200 t/d from Hebei and Tianjin under premium transfer fees. Inland Henan added 16,500 t/d capacity across 18 plants in 2024–2025, financed at 3.2% interest via policy-bank loans. Sichuan channels USD 667.68 million into 500 rural digesters that contract straw and manure through village co-operatives.
The Yangtze River Delta pilots integrated waste management, requiring 80% of provincial waste to be treated in-province by 2028, spurring RDF hubs for cement kilns. The Pearl River Delta exports technology know-how to ASEAN markets through Chinese build-operate-transfer deals. Northern provinces retrofit electricity-only plants for district-heating duty; Hebei targets 25% urban heating from waste energy by 2030. These regional policies diversify opportunity and cushion the Chinese waste-to-energy market against coastal saturation.
Competitive Landscape
The top five operators control about 40% of installed capacity, signaling moderate concentration. Leaders pivot from capital-heavy builds to service-heavy models such as technology licensing and third-party operations. China Everbright Environment and Mitsubishi Heavy Industries co-market ultra-supercritical boiler designs, while Zheneng Jinjiang partners with PetroChina on biomethane upgrading ventures.
Smaller firms secure niches in sludge drying, RDF production, and AI-based plant optimization that carry lower capital requirements but command premium margins. Compliance with GB 18485-2025 is a decisive differentiator; plants that cannot finance flue-gas retrofits are being acquired at 20–30% discounts to replacement cost. Veolia’s joint ventures file multiple patents on compositional forecasting and predictive maintenance, licensing the software on revenue-share terms that lift plant uptime and cut auxiliary fuel by up to 20%.
Strategic thrusts now include district-heating steam contracts, bio-LNG supply agreements, and overseas BOT exports to Southeast Asia. This diversification spreads risk as feed-in-tariff support winds down, yet it raises competitive stakes for skilled labor, proprietary data, and carbon-credit aggregation. The Chinese waste-to-energy industry, therefore, moves toward performance-based competition rather than sheer scale.
China Waste To Energy (WTE) Industry Leaders
China Everbright Environment Group
Zheneng Jinjiang Environment Holding
Grandblue Environment
Zhejiang Weiming Environment Protection
Dynagreen Environmental Protection
- *Disclaimer: Major Players sorted in no particular order

Recent Industry Developments
- January 2026: China's State Council unveiled an ambitious action plan aimed at significantly boosting the nation's solid waste treatment capabilities. The initiative emphasized treating solid waste that directly affected public health and workplace safety.
- December 2025: Chongqing, one of China's largest cities, made a significant shift in its urban waste management by completely transitioning from household waste landfilling to waste-to-energy incineration.
- October 2025: Xi'an upgraded its waste treatment facilities, transforming waste into valuable resources through a strategy of "incineration substitution + classification promotion." The Gaoling domestic waste harmless treatment incineration cogeneration project served five key areas, including Gaoling district, Weiyang district, and Chanba International Port. It featured three 750-ton mechanical grate furnaces, two 25-megawatt steam turbines, and two 30-MW generators.
- September 2025: SUS ENVIRONMENT's showcase, "Key Technologies and Applications for Low-Carbon and Efficient Waste to Energy," clinched the top honor in the Green Industry category at the BRICS Industrial Innovation Contest 2025.


China Waste To Energy (WTE) Market Report Scope
Waste-to-energy is the process of generating energy in the form of electricity and heat through the primary treatment of waste or processing the same into a fuel source.
The Chinese waste-to-energy market is segmented by technology, waste type, energy output, end-user, and geography. By technology, the market is segmented into physical, thermal, and biological processes. By waste type, the market is segmented into municipal solid waste, industrial waste, agricultural and agro-industrial residues, sewage sludge, and other waste streams. By energy output, the market is segmented into electricity, heat, combined heat and power, and transportation fuels. By end-user, the market is segmented into utilities and independent power producers (IPPs), industrial captive plants, district heating operators, and transport fuel distributors. For each segment, market sizing and forecasts have been provided on the basis of value (USD).
By Technology
| Physical (Refuse-Derived Fuel, Mechanical Biological Treatment) |
| Thermal (Incineration/Combustion, Gasification, Pyrolysis and Plasma-Arc) |
| Biological (Anaerobic Digestion, Fermentation) |
By Waste Type
| Municipal Solid Waste |
| Industrial Waste |
| Agricultural and Agro-industrial Residues |
| Sewage Sludge |
| Others (Commercial, Construction, Hazardous) |
By Energy Output
| Electricity |
| Heat |
| Combined Heat and Power (CHP) |
| Transportation Fuels (Bio-SNG, Bio-LNG, Ethanol) |
By End-user
| Utilities and IPPs |
| Industrial Captive Plants |
| District Heating Operators |
| Transport Fuel Distributors |
| By Technology | Physical (Refuse-Derived Fuel, Mechanical Biological Treatment) |
| Thermal (Incineration/Combustion, Gasification, Pyrolysis and Plasma-Arc) | |
| Biological (Anaerobic Digestion, Fermentation) | |
| By Waste Type | Municipal Solid Waste |
| Industrial Waste | |
| Agricultural and Agro-industrial Residues | |
| Sewage Sludge | |
| Others (Commercial, Construction, Hazardous) | |
| By Energy Output | Electricity |
| Heat | |
| Combined Heat and Power (CHP) | |
| Transportation Fuels (Bio-SNG, Bio-LNG, Ethanol) | |
| By End-user | Utilities and IPPs |
| Industrial Captive Plants | |
| District Heating Operators | |
| Transport Fuel Distributors |


Key Questions Answered in the Report
What is the current value of the China waste to energy market?
The China waste to energy market size is USD 10.99 billion in 2026.
How fast is the sector expected to grow through 2031?
It is forecast to expand at a 12.48% CAGR, reaching USD 19.79 billion by 2031.
Which technology segment is growing the quickest?
Biological treatment, mainly anaerobic digestion, is advancing at a 17.8% CAGR.
Why are inland provinces attracting new capacity?
Subsidies and policy-bank loans channel investment toward provinces like Henan and Sichuan where waste generation rises 8–10% yearly but treatment lags.
How will GB 18485-2025 affect operators?
The stricter emission cap forces legacy plants to spend USD 3.48–5.56 million each on flue-gas upgrades or face closure.
Page last updated on:


