Market Overview
| Study Period | 2021 - 2031 |
|---|---|
| Forecast Data Period | 2026 - 2031 |
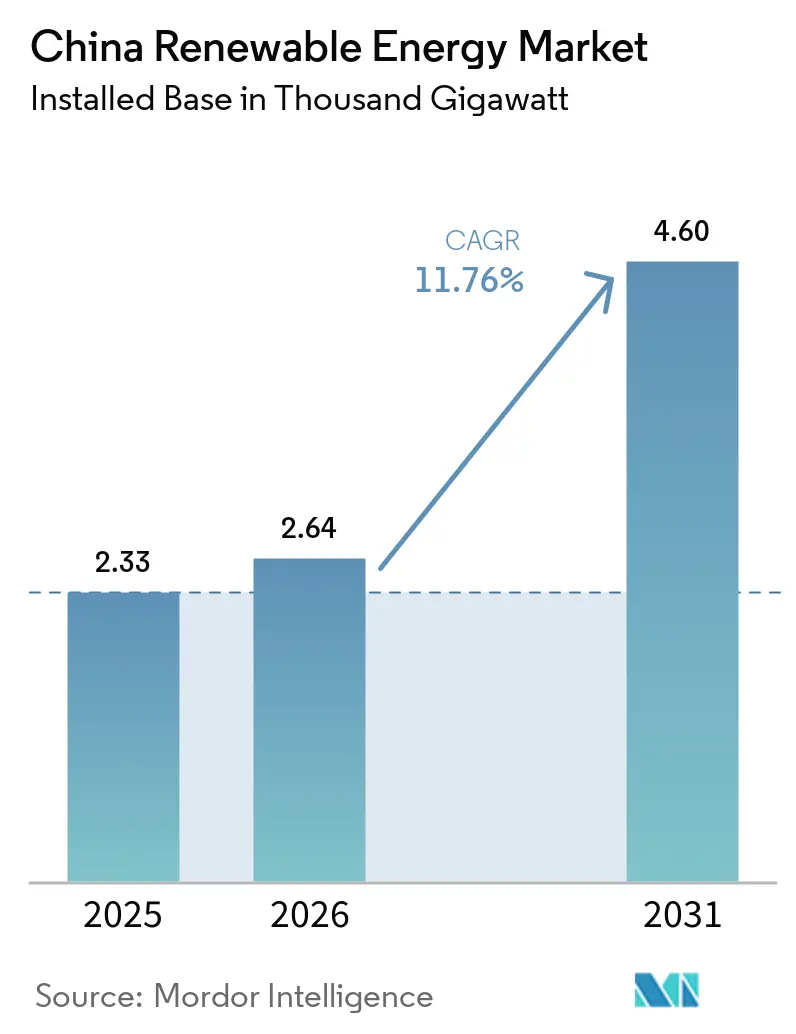
| Base Year Market Size (2025) | 2.33 Thousand gigawatt |
| Market Volume (2026) | 2.64 Thousand gigawatt |
| Market Volume (2031) | 4.60 Thousand gigawatt |
| Growth Rate (2026 - 2031) | 11.76% CAGR |
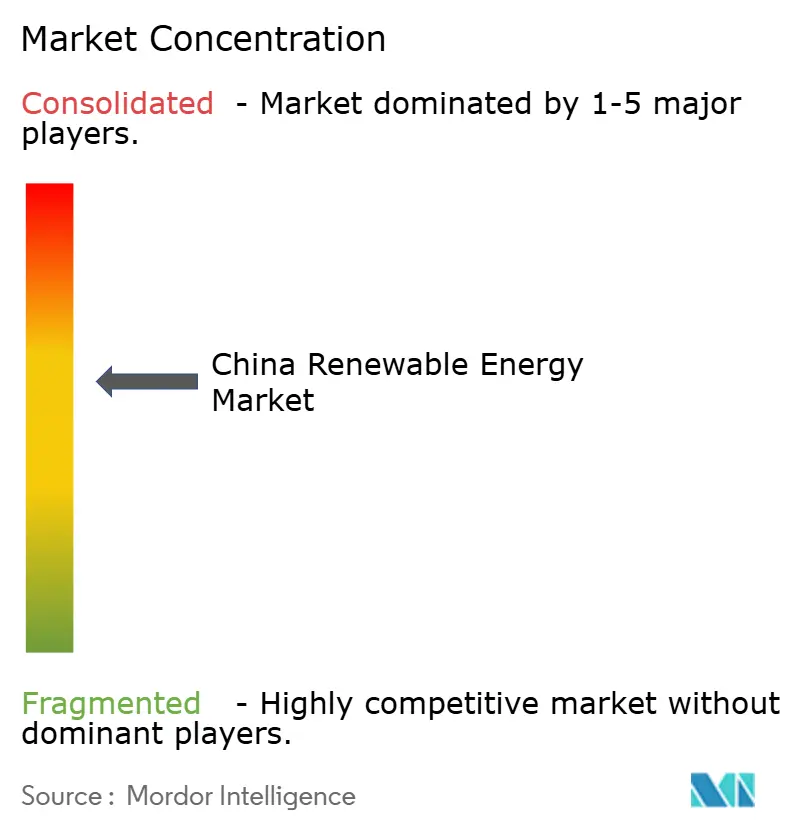
| Market Concentration | Medium |
Major Players *Disclaimer: Major Players sorted in no particular order Image © Mordor Intelligence. Reuse requires attribution under CC BY 4.0. | |
China Renewable Energy Market Analysis by Mordor Intelligence
The China Renewable Energy Market size in terms of installed base is projected to be 2.33 Thousand gigawatt in 2025, 2.64 Thousand gigawatt in 2026, and reach 4.60 Thousand gigawatt by 2031, growing at a CAGR of 11.76% from 2026 to 2031.
An ambitious 2060 carbon-neutrality mandate, rapid declines in levelized cost of energy for both solar photovoltaics and onshore wind, and liberalized green-power trading are accelerating fresh capacity additions. Beijing’s quota-linked penalties for provincial governments have amplified demand among commercial and industrial buyers for long-term, captive power-purchase agreements that bypass auction volatility. Module and turbine manufacturers continue to cut hardware costs, widening the pool of financially viable sites even as feed-in tariffs expire. Developers are able to integrate battery storage with variable renewables capture priority dispatch, improve project utilization, and secure ancillary-service revenue streams, bolstering returns despite narrowing tariff spreads.
Key Report Takeaways
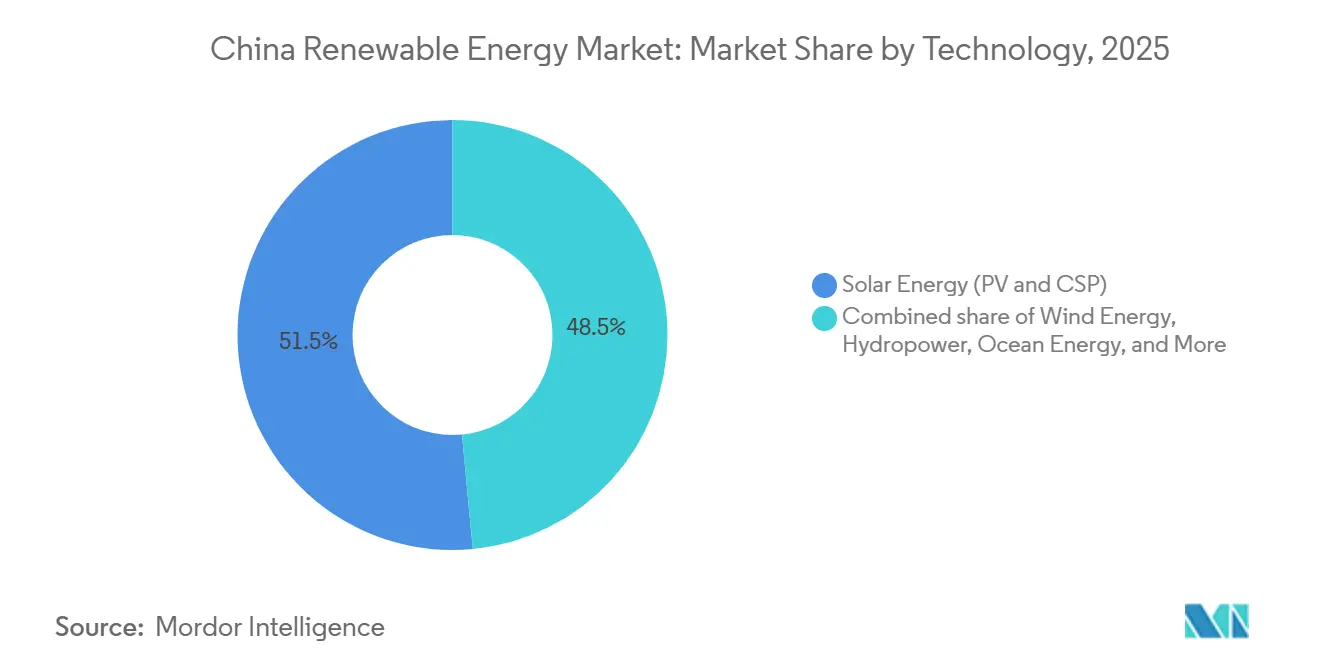
- By technology, solar energy held 51.5% of the Chinese renewable energy market share in 2025, and ocean energy is expected to advance at a 71.9% CAGR through 2031.
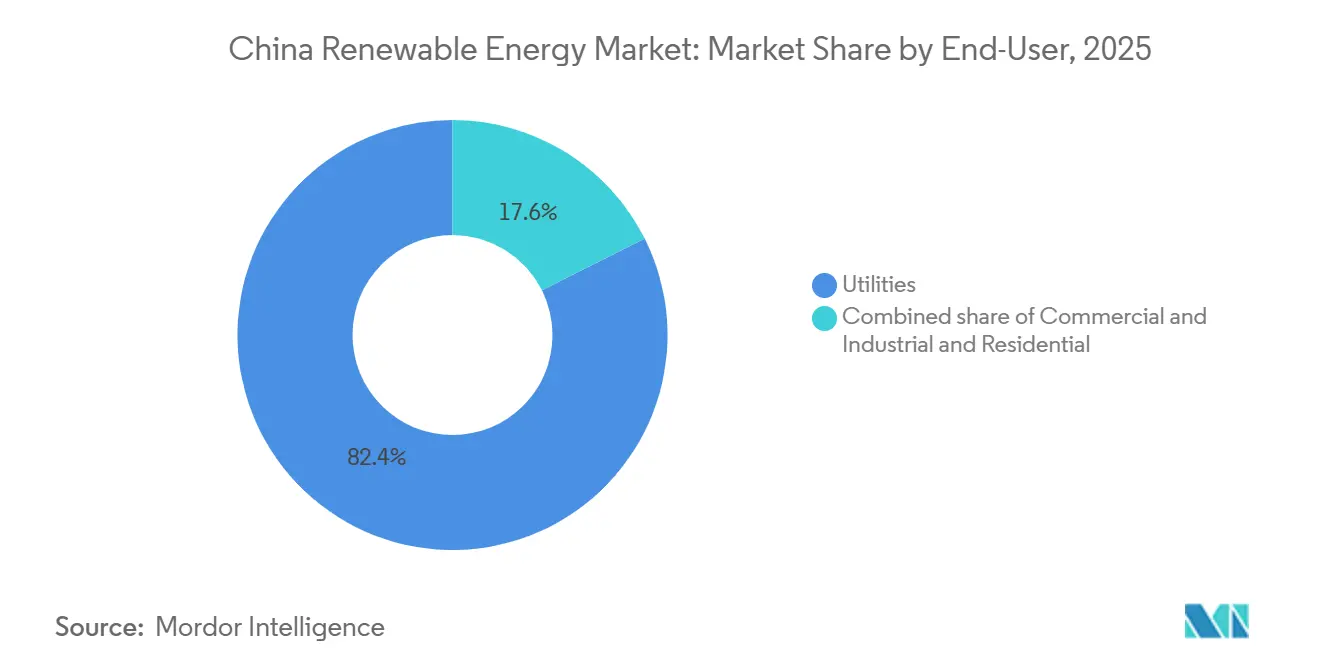
- By end-user, utilities controlled 82.4% of installed capacity in 2025, while the commercial and industrial segment is projected to expand at 14.0% CAGR through 2031.
Note: Market size and forecast figures in this report are generated using Mordor Intelligence’s proprietary estimation framework, updated with the latest available data and insights as of 2026.
China Renewable Energy Market Trends and Insights
Drivers Impact Analysis*
| Driver | (~) % Impact on CAGR Forecast | Geographic Relevance | Impact Timeline |
|---|---|---|---|
| Government 2060 carbon-neutrality mandate & policy incentives | 3.5% | National, with accelerated deployment in Jiangsu, Guangdong, Zhejiang | Long term (≥ 4 years) |
| Rapid LCOE decline for solar PV & onshore wind | 2.8% | National, particularly western provinces (Qinghai, Gansu, Inner Mongolia) | Medium term (2-4 years) |
| Grid-parity policies & green-power trading liberalization | 2.0% | National, with early adoption in eastern industrial hubs | Medium term (2-4 years) |
| Provincial renewable-quota penalties driving captive corporate PPAs | 1.5% | Shandong, Hebei, Jiangsu, Guangdong | Short term (≤ 2 years) |
| Boom in hybrid renewable-storage project approvals | 1.2% | National, concentrated in high-curtailment provinces | Medium term (2-4 years) |
| Mandatory rooftop PV on new public buildings | 0.8% | Urban centers: Beijing, Shanghai, Shenzhen, Chengdu | Short term (≤ 2 years) |
| Source: Mordor Intelligence | |||
Government 2060 Carbon-Neutrality Mandate & Policy Incentives
China’s legally binding 2060 carbon-neutrality goal requires non-fossil energy to supply 80% of total primary consumption by 2060, up from 17% in 2023. Provincial targets cascade from this national commitment, with Jiangsu aiming for 70 GW of new solar and wind by 2027 and Guangdong pledging 50 GW of offshore wind by 2030. State-owned utilities are retiring subcritical coal assets ahead of schedule and redirecting capital toward gigawatt-scale renewable clusters. New carbon-trading regulations introduced in 2025 extended compliance to generators emitting above 26,000 t CO₂ annually, raising fossil-fuel operating costs. Access to green bonds and concessional loans now hinges on adherence to ISO 14064 greenhouse-gas accounting, pushing developers to accelerate low-carbon projects and deepening the Chinese renewable energy market.[1]China Dialogue, “China Extends Carbon Trading to More Generators,” chinadialogue.net
Rapid LCOE Decline for Solar PV & Onshore Wind
Utility-scale solar LCOE fell to USD 0.03-0.04 per kWh in 2025, undercutting coal generation in 22 provinces.[2]International Renewable Energy Agency, “Renewable Power Generation Costs 2025,” irena.org Polysilicon oversupply, domestic capacity reached 1.9 million t in 2024, combined with TOPCon and heterojunction cell efficiencies above 24%, drives these reductions.[3]PV Magazine, “Polysilicon Prices Crash to Five-Year Low,” pv-magazine.com Onshore wind LCOE dropped to USD 0.035 per kWh after the roll-out of 6-MW turbines sporting 170-m rotor diameters. Competitive auction bids in Gansu and Xinjiang at CNY 0.18 per kWh illustrate the new floor. Further cost compression is expected once perovskite-silicon tandem modules and 10-MW onshore turbines mature, supporting sustained expansion in the Chinese renewable energy market.
Grid-Parity Policies & Green-Power Trading Liberalization
The National Energy Administration’s Document 136, released in February 2025, scrapped inter-provincial barriers that previously forced manufacturers to buy in-province coal power. Voluntary green-certificate trading soared to 180 TWh in 2025 as multinational firms chased Scope 2 emission goals. Captive solar arrays now deliver electricity at CNY 0.25 per kWh, well below industrial tariffs of CNY 0.60 per kWh. Priority dispatch rules adopted in 2025 oblige grid operators to curtail thermal assets before renewables during low-price windows, incentivizing flexible storage. These measures strengthen revenue certainty, enlarge financing options, and reinforce the growth trajectory of the Chinese renewable energy market.
Boom in Hybrid Renewable-Storage Project Approvals
Guidelines issued in 2025 require all new wind and solar projects greater than 100 MW to add batteries covering 15-20% of capacity with at least two hours of storage. Hybrid approvals reached 45 GW that year, mainly in Qinghai, Gansu, and Inner Mongolia. Lithium-iron-phosphate pack prices at USD 85 per kWh and ancillary-service payments of CNY 0.50 per kWh underpin attractive economics. Projects integrating storage enjoy 98 % utilization versus 85 % for standalone solar, limiting revenue volatility and reinforcing investor confidence in the Chinese renewable energy market.
Restraints Impact Analysis*
| Restraint | (~) % Impact on CAGR Forecast | Geographic Relevance | Impact Timeline |
|---|---|---|---|
| Grid curtailment & transmission bottlenecks | -1.5% | Qinghai, Gansu, Inner Mongolia, Xinjiang | Medium term (2-4 years) |
| Raw-material supply-chain volatility (polysilicon, rare earths) | -0.8% | National, with acute pressure on offshore wind supply chains | Short term (≤ 2 years) |
| Land-use conflicts causing stricter project permitting | -0.5% | Agricultural provinces: Henan, Anhui, Sichuan | Medium term (2-4 years) |
| Feed-in-tariff phase-out & low auction prices | -0.4% | Western provinces with competitive auction markets | Short term (≤ 2 years) |
| Source: Mordor Intelligence | |||
Grid Curtailment & Transmission Bottlenecks
Despite CNY 500 billion in ultra-high-voltage (UHV) lines commissioned between 2020 and 2025, peak renewable output still outstrips transmission by 30 GW on windy, sunny days. Curtailment averaged 6.6 % for solar in Qinghai and 4.1 % for wind in Gansu during 1H 2025. Developers lose 150-200 basis points in project IRRs when effective capacity factors slide. Eight additional UHV corridors scheduled for service by 2028 should relieve pressure, yet bottlenecks remain a structural headwind for the Chinese renewable energy market until that date.
Raw-Material Supply-Chain Volatility
Spot polysilicon prices crashed from USD 30 per kg in 2022 to USD 6-8 per kg in 2024-2025, wreaking havoc on EPC contracts and forcing renegotiations. Rare-earth metals used in permanent-magnet turbines saw dysprosium jump from USD 350 per kg in 2023 to USD 520 per kg in 2025 following Myanmar export restrictions. Each 16-MW offshore turbine needs roughly 2 t of magnets, so input-price spikes add more than USD 1 million per machine, squeezing margins. OEMs are researching dysprosium-free chemistries, but commercial solutions are unlikely before 2027, sustaining cost risk in the Chinese renewable energy market.
*Our forecasts treat driver/restraint impacts as directional, not additive. The impact forecasts reflect baseline growth, mix effects, and variable interactions.
Segment Analysis
By Technology: Solar Dominates Installed Base While Ocean Energy Surges
Solar accounted for 51.5 % of installed capacity in 2025, equal to 1,204 GW, underpinned by mega-parks in Qinghai and Inner Mongolia that leverage irradiance above 1,800 kWh/m² annually. Wind followed, with 73 GW of offshore capacity and 380 GW onshore, riding turbine uprating to 6-MW land-based and 16-MW sea-based machines. Hydropower kept its anchor role in southwestern provinces, supplying 120 GW in Sichuan and Yunnan and buffering intermittency via pumped storage. Ocean energy is forecast to grow at a 71.9 % CAGR, pushing the Chinese renewable energy market size for this niche segment towards 150 MW by 2031.[4]China Ocean Energy Association, “Tidal and Wave Progress Update 2025,” coea.cn
Continued cost declines in heterojunction, N-type TOPCon, and perovskite-tandem modules should lift photovoltaic utilization. Offshore wind enjoys policy-backed port upgrades and local-content rules that trim logistics expenses, cutting LCOE to USD 0.055 per kWh for 16 MW turbines in Jiangsu waters. Large pumped-storage projects such as the 3.6 GW Fengning facility improve system flexibility, enabling higher solar and wind penetration. The Chinese renewable energy market share led by solar may narrow modestly as tidal-stream and wave pilots mature, but solar remains the backbone through 2031.


By End-User: Utilities Lead but Commercial and Industrial Accelerate
Utilities owned 82.4 % of capacity in 2025, leveraging balance-sheet heft and policy-bank funding to construct gigawatt-scale parks. The commercial and industrial segment is running at a 14.0 % CAGR, supported by rooftop mandates in four megacities and by multinationals enforcing Scope 2 compliance on Chinese suppliers. Long-term PPAs priced at CNY 0.35-0.40 per kWh guarantee stable cash flows, unlocking non-recourse loans.
Industrial parks in Shandong and Hebei deploy 50-200 MW arrays that shave peak tariffs. Data centers in Guizhou and smelters in Yunnan blend hydropower with solar to stabilize load profiles. Although residential adoption remains subdued at an estimated 8 % CAGR because of communal roof ownership, subsidy tweaks and standardized leasing models could unlock incremental growth. Utilities’ control over transmission and dispatch ensures they keep a majority stake, yet their Chinese renewable energy market share is expected to decline gradually as distributed assets scale.
Geography Analysis
Eastern coastal provinces dominate offshore wind. Jiangsu operated 22 GW of sea-based turbines in 2025 and targets 40 GW by 2030, backed by provincial subsidies of CNY 0.05 per kWh for projects online before 2027. Guangdong’s ambition reaches 50 GW, with 8 GW already spinning in Yangjiang waters. Fast-track marine-spatial planning and shallow continental shelves shorten project lead times to 24 months, boosting the Chinese renewable energy market in the east.
Resource-rich western provinces drive solar and onshore wind. Qinghai’s Hainan solar park scales to 16 GW, linked via ±800 kV UHV to Henan, exporting 25 TWh annually. Inner Mongolia surpasses 45 GW of wind but curtails 8 % of output amid insufficient east-bound lines. Xinjiang blends 10 GW solar with 6 GW wind for complementary generation, smoothing profiles, and lessening storage needs. Projects here anchor the long-term supply horizon for the Chinese renewable energy market.
Southwestern hydropower strongholds complement variable renewables. Sichuan’s 120 GW of large hydro covers baseload and frequency regulation, allowing neighboring Chongqing to lift solar shares without stability concerns. Yunnan exported 120 TWh of clean electricity to Guangdong in 2025, facilitated by the China Southern Power Grid’s 500 kV backbone. Central provinces such as Henan pivot to rooftop solar, installing 18 GW across industrial zones and meeting 12 % of local demand. Together, these regional dynamics diversify and de-risk the Chinese renewable energy market.
Competitive Landscape
The top 10 entities command roughly 55 % of installed capacity, indicating moderate concentration. State-owned majors, China Three Gorges, State Power Investment Corporation, Huaneng, Huadian, and Datang, leverage sovereign funding and streamlined permitting to build utility-scale hydro, offshore wind, and pumped storage. China Three Gorges alone operates 130 GW, including the 22.5 GW Three Gorges Dam and 18 GW of offshore wind, anchoring the Chinese renewable energy market.
Private players innovate on efficiency and cost. LONGi’s 26.5 % back-contact heterojunction modules priced at USD 0.12 per W led to industry-wide ASP compression. JinkoSolar, Trina, and Canadian Solar expand N-type TOPCon lines, collectively shipping 120 GW in 2025. Turbine makers Goldwind, Ming Yang, and Envision rolled out 16-18 MW offshore platforms with hybrid magnet systems that slash dysprosium needs by 40 %, widening their addressable market in typhoon-prone waters.
Emerging niches show promise. Independent power producers combining 2-4 h batteries with solar secure priority dispatch and 200 bp higher IRRs. Agrivoltaics deliver dual land use and tap rural revitalization subsidies. Ocean energy remains at pilot scale, yet exclusive marine zones totaling 500 km² earmarked for tidal arrays underscore long-term growth prospects inside the Chinese renewable energy market.
China Renewable Energy Industry Leaders
China Three Gorges Corporation
State Power Investment Corporation (SPIC)
China Huaneng Group
China Datang Corp Renewable Power
China General Nuclear New Energy
- *Disclaimer: Major Players sorted in no particular order

Recent Industry Developments
- May 2026: China deployed a 16 MW floating offshore wind turbine, named the "Three Gorges Pilot," near Guangdong. This turbine is designed for deep-water deployment and has the capacity to generate electricity sufficient to power approximately 4,200 homes annually.
- April 2025: Jinneng launched a 5 GW solar project in a coal zone, highlighting China's strategy to repurpose fossil fuel regions for renewable energy development while maintaining employment and economic activity.
- March 2025: China's National Development and Reform Commission has issued comprehensive guidelines promoting the high-quality development of the renewable energy green electricity certificate market, aiming to establish a complete trading system by 2027 and achieve international recognition of Chinese GECs, thereby facilitating exports to markets with carbon border adjustments.
- February 2025: The NDRC and National Energy Administration announced the transition from feed-in tariffs to market-based pricing for all new renewable energy projects, effective June 2025. This implementation will introduce a price settlement mechanism similar to contracts for difference, ensuring revenue stability while promoting market efficiency.
- January 2025: State Power Investment Corporation confirmed financial close on China’s first commercial floating wind farm, a 400 MW project in Shandong coastal waters.


China Renewable Energy Market Report Scope
Renewable energy, including biomass, geothermal, hydropower, solar, wind, tidal, and wave, offers tremendous benefits for meeting global energy needs. Since the last decade, renewable energy has become the fastest-growing energy technology, particularly wind and solar, and is cost-competitive in various grid, off-grid, and remote applications worldwide.
The Chinese renewable energy market is segmented by technology and end-user. By technology, the market is segmented into solar energy (PV and CSP), wind energy (onshore and offshore), hydropower (small, large, and PSH), bioenergy, geothermal energy, and ocean energy (tidal and wave). By end-user, the market is segmented into utilities, commercial and industrial, and residential sectors. For each segment, the market sizing and forecasts have been presented in terms of volume (gigawatts, GW).
By Technology
| Solar Energy (PV and CSP) |
| Wind Energy (Onshore and Offshore) |
| Hydropower (Small, Large, PSH) |
| Bioenergy |
| Geothermal |
| Ocean Energy (Tidal and Wave) |
By End-User
| Utilities |
| Commercial and Industrial |
| Residential |
| By Technology | Solar Energy (PV and CSP) |
| Wind Energy (Onshore and Offshore) | |
| Hydropower (Small, Large, PSH) | |
| Bioenergy | |
| Geothermal | |
| Ocean Energy (Tidal and Wave) | |
| By End-User | Utilities |
| Commercial and Industrial | |
| Residential |


Key Questions Answered in the Report
What is the installed capacity of the Chinese renewable energy market in 2026?
Installed capacity reached 2,640 GW in 2026, up from 2,338 GW in 2025, reflecting 12.9% year-on-year growth.
How fast is ocean energy growing in China?
Ocean energy is expanding at a 71.9 % CAGR to 2031, the quickest pace among all renewable technologies, albeit from a very small base.
Which provinces lead offshore wind additions?
Jiangsu and Guangdong lead, boasting 22 GW and 8 GW of offshore wind capacity respectively as of 2025.
Why are corporate PPAs important for Chinese manufacturers?
Long-term PPAs priced below grid tariffs lock in electricity costs and help firms meet Scope 2 emissions targets imposed by global customers.
What role do batteries play in new Chinese solar and wind projects?
Since 2025, projects above 100 MW must include 15-20 % battery capacity with at least two hours duration to cut curtailment and earn ancillary-service revenue.
How concentrated is competition among Chinese renewable energy developers?
The top ten developers control about 55 % of installed capacity, indicating a moderately concentrated market where private innovators compete with state-owned giants.
Page last updated on:


