Market Overview
| Study Period | 2018 - 2031 |
|---|---|
| Forecast Data Period | 2026 - 2031 |
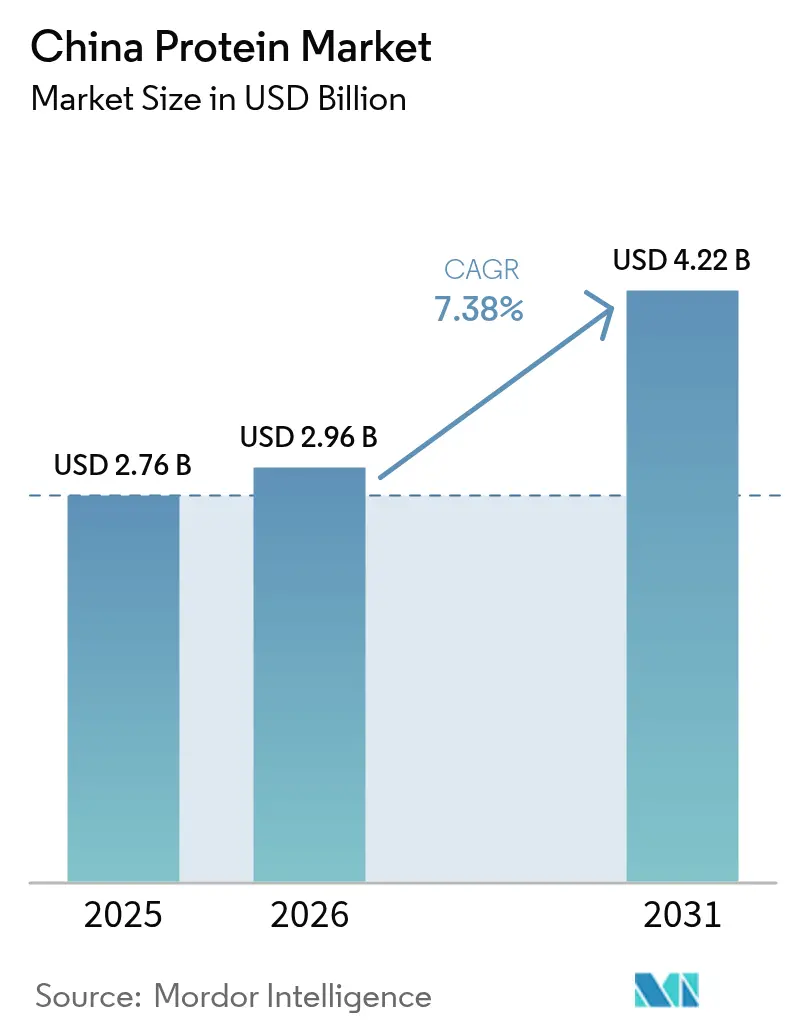
| Base Year Market Size (2025) | USD 2.76 Billion |
| Market Size (2026) | USD 2.96 Billion |
| Market Size (2031) | USD 4.22 Billion |
| Growth Rate (2026 - 2031) | 7.38% CAGR |
| Market Concentration | Low |
Major Players*Disclaimer: Major Players sorted in no particular order Image © Mordor Intelligence. Reuse requires attribution under CC BY 4.0. | |
China Protein Market Analysis by Mordor Intelligence
The China Protein Market size is expected to grow from USD 2.76 billion in 2025 to USD 2.96 billion in 2026 and is forecast to reach USD 4.22 billion by 2031 at 7.38% CAGR over 2026-2031.
The Chinese protein industry is experiencing significant transformation driven by changing consumer preferences and dietary habits. The average per capita protein consumption in China of animal protein has increased steadily, reaching 42.89 grams per day in 2022, reflecting growing affluence and health consciousness among Chinese consumers. The government's implementation of the National Nutrition Plan (2017-2030) and Healthy China 2030 initiative has created a supportive framework for protein market development. The industry has also witnessed substantial growth in protein raw materials production, with animal protein raw materials production reaching 117.2 million metric tons in 2022, ensuring a stable supply for manufacturers.
The plant protein sector has gained considerable momentum, particularly in innovative product development and consumer acceptance. Approximately 70-75% of Chinese citizens expressed willingness to become flexitarian in 2022, with 25-30% already following a flexitarian diet. This shift is particularly evident in urban areas where consumers are increasingly seeking sustainable and healthier protein alternatives. The industry has responded with significant investments in research and development, leading to new product launches and improved protein formulations that better meet local taste preferences and nutritional requirements.
The sports and fitness sector has emerged as a significant driver of protein demand, supported by expanding fitness infrastructure and changing lifestyle patterns. As of 2022, China had approximately 129,000 gyms and 900,000 fitness trails across the country, creating substantial demand for protein-enriched products. The market has witnessed increased sophistication in product offerings, with manufacturers developing specialized formulations for different consumer segments, from professional athletes to casual fitness enthusiasts. In September 2024, Fonterra demonstrated its commitment to innovation by opening its sixth application center in China, enabling rapid product development in response to local market trends.
The industry has seen significant advancement in protein processing technologies and application methods. Manufacturers are increasingly focusing on improving protein functionality and bioavailability while maintaining cost-effectiveness. The soybean sector, a crucial component of China's protein industry, has shown remarkable progress with the government targeting to increase production to 23 million tonnes by 2025. This development is complemented by strategic partnerships and investments in the sector, such as Archer Daniels Midland's 2023 collaboration with Air Protein to develop innovative protein solutions, demonstrating the industry's commitment to technological advancement and sustainable production methods.
Note: Market size and forecast figures in this report are generated using Mordor Intelligence’s proprietary estimation framework, updated with the latest available data and insights as of 2026.
China Protein Market Trends and Insights
Animal protein's consumption growth fuels opportunities for key players in the ingredients segment
- The graph given depicts the per capita consumption of animal protein in China. In the past, adults across China mainly ignored milk and dairy products (including milk protein) because they were seen as food for children or the elderly. However, this trend has changed in recent years. The nation of nearly 1,400 million people is now the second-largest consumer of dairy products in the world. China imports products from various other countries, ranging from New Zealand-based dairies to German industries. The Chinese animal protein market has witnessed a huge demand for high-quality protein ingredients from health-conscious people. The per capita consumption increased from 40 grams in 2016 to 45.1 grams in 2021.
- Organic milk protein is most widely consumed in China. The organic segment witnesses a dynamic demand, with around 57% of mothers considering organic products. Arla Foods introduced two innovative 'organic kiddies snack' concepts by using its Nutrilac range of functional protein ingredients in 2021. Fonterra launched SureProteinTM SoftBar 1000, a milk protein bar that is exceptionally soft and has a relatively short chew time.
- The Chinese market is witnessing rapid growth in the demand for collagen protein in food applications. This product is already well-established and marketed in Western countries. Its demand in China is being fueled by the rising awareness of the impact of beauty-oriented nutritional products. This trend is known as "oral beauty" or "beautiful eating" in China. China is the largest market for whey protein in Asia-Pacific. The Chinese personal care market witnessed an increase in the demand for whey protein as it is widely used in the production of various weight management and beauty products.


China's domestic meat production increased due to the outbreak of African Swine Fever
- Meat from cattle, chicken, and pig with bone, raw milk from cattle and goats, skim milk of cows, and dry whey powder make up the production of animal protein, and the same data is given in the graph. The Dietary Guidance for Chinese Residents recommends a daily intake of 300 grams of dairy products. The US exports skimmed milk powder, cheese, and whey powder following the implementation of the Section 301 tariff exclusion. The Chinese government promotes processed dairy products, including cheese, whey, and butter, as good sources of protein.
- In 2020, milk production in China witnessed moderate growth due to the COVID-19 pandemic. This was mainly due to transport restrictions and reduced dairy processing activities. The fall in production was mainly observed in small farms. Large farms were less affected due to contract farming with major dairy manufacturers. The production of most dairy products, including fluid milk, dropped by 5%-11% in 2020. China's import of fluid milk increased to 980,000 MT in 2021, as per the USDA. The European Union is the major supplier of fluid milk to China, followed by New Zealand.
- China's domestic beef production increased due to the outbreak of African Swine Fever. Beef was promoted in China as a healthy protein option in salads or processed ready-to-eat meal packs. In December 2022, China's National Conference of Agricultural and Rural Affairs decided to set an annual pork production target of 55 million metric tons for the country's five-year plan, which is approximately 35% above the current production rate. Cattle and pigs across the country account for large-scale breeding and production purposes, thereby providing sufficient raw material for collagen production.

OTHER KEY INDUSTRY TRENDS COVERED IN THE REPORT
- The growing infant population and reduction in breastfeeding are driving the segment
- Healthy, functional drinks are driving segmental growth
- The combination of distinct growth strategies is driving the industry
- Plant-based milk is driving the segment's growth
- High volume of meat consumption is driving the sector in China
- Savory snacks are a current market trend
- Innovative techniques and expertise are pushing the industry
- The growing popularity of plant-based meat is expected to contribute to an increase in consumption
- The cake sub-segment is growing
- Breakfast cereals can target the on-the-go processed food segment
- Intensive economy is boosting the sales of premium chocolate
- Aging population to support market growth
- Innovations from multinational companies, coupled with increasing preference for prepackaged foods with healthy choices, are expected to impact the segment's growth
- The rising involvement in sports activity is propelling the market's growth
- The cosmetics segment is impacting the market's growth
- China is estimated to become the world's top wheat producer
Segment Analysis: Source
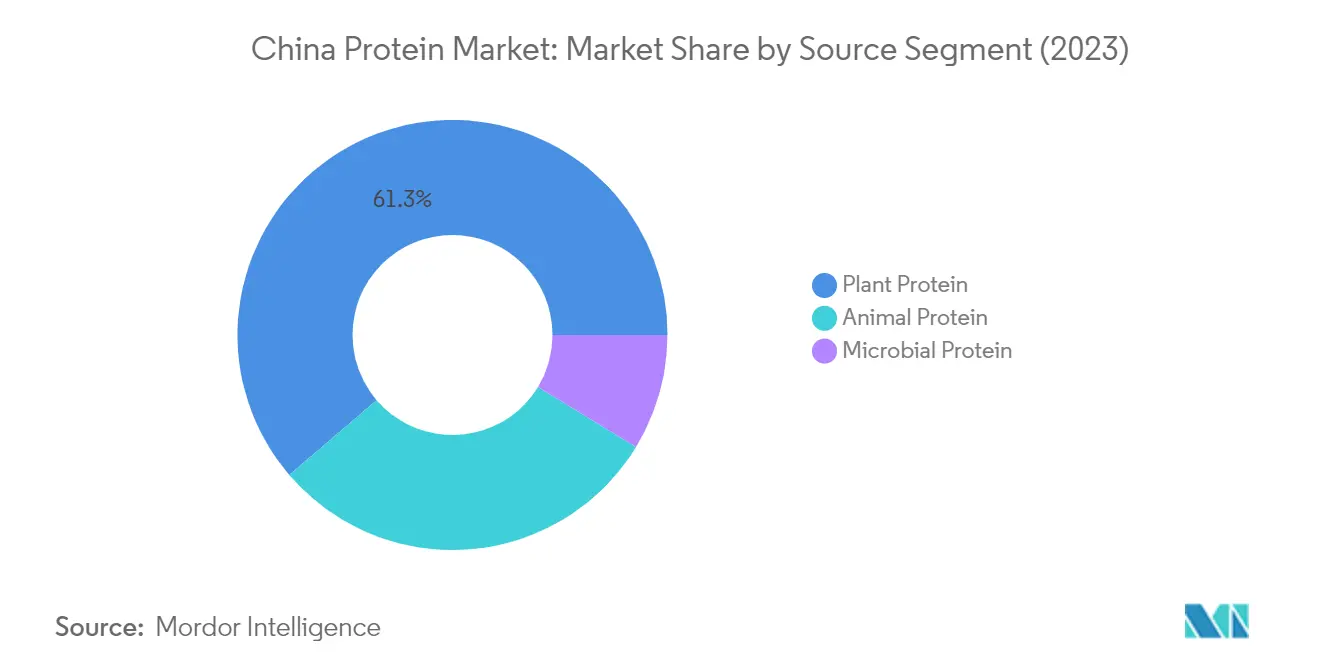
Plant Protein Segment in China Protein Market
The plant protein segment continues to dominate the China protein market, holding approximately 60.45% market share in 2025. This dominance is driven by the increasing vegan population and shifting consumer preferences away from animal protein. The segment's growth is primarily attributed to the extensive availability of raw materials, superior functionality, and rising demand for plant-based alternatives in various applications. In China, approximately 70-75% of citizens are willing to become flexitarian, with 25-30% already following a flexitarian diet, significantly boosting the plant protein market. The segment is experiencing robust growth with a projected growth rate of around 7.83% during 2026-2031, making it both the largest and fastest-growing segment. This growth is largely driven by applications in meat alternatives, dairy alternatives, and nutritional products, particularly with soy protein and pea protein leading the innovation in these categories.

Microbial Protein Segment in China Protein Market
The microbial protein segment, comprising algae protein and mycoprotein, represents an emerging category in China's protein market. The segment is witnessing increased adoption due to its sustainable production methods and high protein yield rates. Mycoprotein, which has the highest yield rate and an economical production setup using industrial fermenters for large-scale extraction, remains the most preferred type among formulators. The Chinese government's support in moving toward alternative protein sources and its dietary guidelines, which aim to reduce the country's meat consumption, are further boosting this segment's growth. Additionally, the expansion of the algal protein market is aided by the rising number of health clubs and exercise facilities, as well as the increased demand for cyanobacteria algae due to their role in weight management and nutritional benefits.
Animal Protein Segment in China Protein Market
The animal protein segment maintains a significant presence in the Chinese protein market, encompassing various protein types including whey protein, casein, collagen, egg protein, and gelatin. This segment serves diverse applications across food and beverage, nutritional supplements, and personal care products. The segment's strength lies in its established manufacturing infrastructure and proven nutritional benefits. Dairy proteins like whey and milk, being highly effective in muscle building and recovery, maintain strong demand among the growing consumer base. The segment also benefits from China's position as a major importer of dairy proteins, with substantial demand from sports nutrition and infant formula manufacturers.
Segment Analysis: End User
Food & Beverages Segment in China Protein Market
The Food & Beverages (F&B) segment maintains its dominant position in China's protein market, commanding approximately 62% market share in 2024. This substantial market presence is primarily driven by the meat/poultry/seafood and meat alternative products subsegment, which accounts for over one-third of the F&B protein consumption. The segment's growth is further supported by the rising demand for protein-rich functional foods and increasing awareness about protein-fortified diets among Chinese consumers. The dairy and dairy alternatives subsegment has emerged as the second-largest application area within F&B, representing nearly 18% of the segment's volume. The bakery, beverages, and snacks industries are also significant contributors to the segment's growth, with manufacturers increasingly incorporating various protein types to enhance nutritional profiles and meet consumer demands for healthier food options.
Animal Feed Segment in China Protein Market
The Animal Feed segment is projected to exhibit the most robust growth in the China protein market, with an expected growth rate of approximately 9% during 2024-2029. This accelerated growth is primarily attributed to the increasing demand for protein-enriched animal feed products and the government's strategic focus on enhancing livestock production efficiency. The segment's expansion is further driven by the rising adoption of plant proteins as alternatives to traditional feed ingredients, particularly in response to the country's revised regulations on crude protein content in poultry and swine feed. Manufacturers are increasingly focusing on developing innovative feed formulations incorporating various protein sources, including soy protein concentrates and pea protein, to improve feed efficiency and animal health outcomes. The segment is witnessing significant technological advancements in feed processing and growing investments in research and development for sustainable protein sources in animal nutrition.
Remaining Segments in End User Segmentation
The Personal Care & Cosmetics and Supplements segments represent significant opportunities in the Chinese protein market, each serving distinct consumer needs. The Personal Care & Cosmetics segment is experiencing notable growth driven by increasing demand for protein-enriched skincare and haircare products, particularly collagen-based formulations. The segment benefits from growing consumer awareness about the benefits of protein-based personal care products and the rising trend of "beauty from within" concepts. Meanwhile, the Supplements segment maintains its importance in the market through its diverse applications in sports nutrition, elderly nutrition, and medical nutrition. This segment is particularly influenced by the growing fitness consciousness among Chinese consumers and the increasing elderly population's nutritional needs, leading to innovative product developments and formulations.
Competitive Landscape
Top Companies in China Protein Market
The China protein market is characterized by intense competition driven by continuous product innovation and strategic expansion initiatives. Companies are heavily investing in research and development to create novel protein ingredients, particularly focusing on plant-based alternatives and specialized formulations for various applications. Operational agility has become crucial as manufacturers adapt to changing consumer preferences and regulatory requirements, with many players establishing local protein production facilities and innovation centers. Strategic moves predominantly involve partnerships with local distributors, acquisitions of regional players, and joint ventures to strengthen market presence. Companies are also expanding their geographical footprint through new manufacturing facilities and application centers, while simultaneously broadening their product portfolios to cater to emerging applications in food, beverages, and nutrition segments.
Market Structure Shows Dynamic Competitive Environment
The Chinese protein market exhibits a fragmented structure with a mix of global multinational corporations and local specialists competing for market share. Global players like Fonterra, International Flavors & Fragrances, and Archer Daniels Midland leverage their technological expertise and extensive research capabilities to maintain their positions, while local companies such as Shandong Yuwang Industrial and Shandong Jianyuan Bioengineering capitalize on their understanding of regional preferences and established distribution networks. The market is witnessing increasing consolidation through strategic mergers and acquisitions, as larger players seek to expand their capabilities and geographic reach while smaller companies look to access advanced technologies and broader distribution channels.
The competitive landscape is further shaped by the presence of specialized manufacturers focusing on specific protein types or applications, alongside diversified conglomerates offering comprehensive protein portfolios. Market dynamics are influenced by vertical integration strategies, with several players controlling multiple stages of the value chain from raw material sourcing to end-product manufacturing. The industry has seen numerous collaborative ventures between international and domestic players, combining global expertise with local market knowledge to enhance competitive positioning and market penetration.
Innovation and Sustainability Drive Future Success
For established players to maintain and expand their market share, focus on sustainable sourcing practices and innovative product development has become essential. Companies are investing in advanced protein processing technologies and clean-label solutions to meet evolving consumer demands. The development of application-specific protein formulation solutions and customized formulations for different end-user segments has emerged as a key differentiator. Incumbents are also strengthening their position through vertical integration, enhanced distribution networks, and strategic partnerships with key customers in high-growth segments.
New entrants and challenger brands can gain ground by focusing on niche markets and specialized applications, particularly in emerging segments like plant-based proteins and sports nutrition. Success factors include developing cost-effective production methods, establishing strong relationships with local distributors, and investing in research and development capabilities. Companies must also navigate potential regulatory changes, particularly regarding food safety standards and protein content claims, while addressing the growing demand for sustainable and traceable protein sources. Building strong relationships with end-users and maintaining flexibility in production capabilities will be crucial for long-term success in this dynamic market.
China Protein Industry Leaders
Archer Daniels Midland Company
Darling Ingredients Inc.
Fonterra Co-operative Group Limited
FUJI OIL HOLDINGS INC.
International Flavors & Fragrances, Inc.
- *Disclaimer: Major Players sorted in no particular order


Recent Industry Developments
- September 2024: Fonterra has opened its sixth application centre in china which enables the rapid launch of innovative product application in response to market trends and local customer's needs.
- August 2024: Global dairy co-operative Fonterra and natural ingredient manufacturer Superbrewed Food have teamed up to boost sustainable food production. The partnership combines Superbrewed’s biomass protein platform with Fonterra’s dairy processing, ingredients, and application expertise to develop additional nutrient-rich, functional biomass protein.
- May 2023: Archer Daniels Midland is partnering with Air Protein to help the food tech startup make healthy food out of thin air. The two companies have entered a strategic development agreement in which ADM will lend its researchers, ingredients insight, technologies, and strategy to help Air Protein develop products for commercialization. The partnership also includes mutually exclusive rights for ADM and Air Protein to collaborate to build and operate a commercial-scale Air Protein plant.


China Protein Market Report Scope
Animal, Microbial, Plant are covered as segments by Source. Animal Feed, Food and Beverages, Personal Care and Cosmetics, Supplements are covered as segments by End User.Source
| Animal | By Protein Type | Casein and Caseinates |
| Collagen | ||
| Egg Protein | ||
| Gelatin | ||
| Insect Protein | ||
| Milk Protein | ||
| Whey Protein | ||
| Other Animal Protein | ||
| Microbial | By Protein Type | Algae Protein |
| Mycoprotein | ||
| Plant | By Protein Type | Hemp Protein |
| Pea Protein | ||
| Potato Protein | ||
| Rice Protein | ||
| Soy Protein | ||
| Wheat Protein | ||
| Other Plant Protein |
End User
| Animal Feed | ||
| Food and Beverages | By Sub End User | Bakery |
| Beverages | ||
| Breakfast Cereals | ||
| Condiments/Sauces | ||
| Confectionery | ||
| Dairy and Dairy Alternative Products | ||
| Meat/Poultry/Seafood and Meat Alternative Products | ||
| RTE/RTC Food Products | ||
| Snacks | ||
| Personal Care and Cosmetics | ||
| Supplements | By Sub End User | Baby Food and Infant Formula |
| Elderly Nutrition and Medical Nutrition | ||
| Sport/Performance Nutrition | ||
| Source | Animal | By Protein Type | Casein and Caseinates |
| Collagen | |||
| Egg Protein | |||
| Gelatin | |||
| Insect Protein | |||
| Milk Protein | |||
| Whey Protein | |||
| Other Animal Protein | |||
| Microbial | By Protein Type | Algae Protein | |
| Mycoprotein | |||
| Plant | By Protein Type | Hemp Protein | |
| Pea Protein | |||
| Potato Protein | |||
| Rice Protein | |||
| Soy Protein | |||
| Wheat Protein | |||
| Other Plant Protein | |||
| End User | Animal Feed | ||
| Food and Beverages | By Sub End User | Bakery | |
| Beverages | |||
| Breakfast Cereals | |||
| Condiments/Sauces | |||
| Confectionery | |||
| Dairy and Dairy Alternative Products | |||
| Meat/Poultry/Seafood and Meat Alternative Products | |||
| RTE/RTC Food Products | |||
| Snacks | |||
| Personal Care and Cosmetics | |||
| Supplements | By Sub End User | Baby Food and Infant Formula | |
| Elderly Nutrition and Medical Nutrition | |||
| Sport/Performance Nutrition | |||


Market Definition
- End User - The Protein Ingredients Market operates on a B2B basis. Food, Beverages, Supplements, Animal Feed, and Personal Care & Cosmetic manufacturers are considered to be end-consumers in the market studied. The scope excludes manufacturers buying liquid/dry whey to be used for application as a binding agent or thickener or other non-protein applications.
- Penetration Rate - Penetration Rate is defined as the percentage of Protein-Fortified End User Market Volume in the Overall End User Market Volume.
- Average Protein Content - Average protein content is the average protein content present per 100 g of product manufactured by all end-user companies considered under the scope of this report.
- End User Market Volume - End-user market volume is the consolidated volume of all types and forms of end-user products in the country or region.
| Keyword | Definition |
|---|---|
| Alpha-lactalbumin (α-Lactalbumin) | It is a protein that regulates the production of lactose in the milk of almost all mammalian species. |
| Amino acid | It is an organic compound that contains both amino and carboxylic acid functional groups, which are required for the synthesis of body protein and other important nitrogen-containing compounds, such as creatine, peptide hormones, and some neurotransmitters. |
| Blanching | It is the process of briefly heating vegetables with steam or boiling water. |
| BRC | British Retail Consortium |
| Bread improver | It is a flour-based blend of several components with specific functional properties designed to modify dough characteristics and give quality attributes to bread. |
| BSF | Black Soldier Fly |
| Caseinate | It is a substance produced by adding an alkali to acid casein, a derivative of casein. |
| Celiac disease | Celiac disease is an immune reaction to eating gluten, a protein found in wheat, barley, and rye. |
| Colostrum | It is a milky fluid that’s released by mammals that have recently given birth before breast milk production begins. |
| Concentrate | It is the least processed form of protein and has a protein content ranging from 40-90% by weight. |
| Dry protein basis | It refers to the percentage of "pure protein" present in a supplement after the water in it is completely removed through heat. |
| Dry whey | It is the product resulting from drying fresh whey which has been pasteurized and to which nothing has been added as a preservative. |
| Egg protein | It is a mixture of individual proteins, including ovalbumin, ovomucoid, ovoglobulin, conalbumin, vitellin, and vitellenin. |
| Emulsifier | It is a food additive that facilitates the blending of foods that are immiscible with one another, such as oil and water. |
| Enrichment | It is the process of addition of micronutrients that are lost during the processing of the product. |
| ERS | Economic Research Service of the USDA |
| Extrusion | It is the process of forcing soft mixed ingredients through an opening in a perforated plate or die designed to produce the required shape. The extruded food is then cut to a specific size by blades. |
| Fava | Also known as Faba, it is another word for yellow split beans. |
| FDA | Food and Drug Administration |
| Flaking | It is a process in which typically a cereal grain (like corn, wheat, or rice) is broken down into grits, cooked with flavors and syrups, and then pressed into flakes between cooled rollers. |
| Foaming agent | It is a food ingredient that makes it possible to form or maintain a uniform dispersion of a gaseous phase in a liquid or solid food. |
| Foodservice | It refers to the part of the food industry which includes businesses, institutions, and companies which prepare meals outside the home. It includes restaurants, school and hospital cafeterias, catering operations, and many other formats. |
| Fortification | It is the deliberate addition of micronutrients that are not found in them naturally or which are lost during processing, to improve a food product's nutritional value. |
| FSANZ | Food Standards Australia New Zealand |
| FSIS | Food Safety and Inspection Service |
| FSSAI | Food Safety and Standards Authority of India |
| Gelling agent | It is an ingredient that functions as a stabilizer and thickener to provide thickening without stiffness through the formation of gel. |
| GHG | Greenhouse Gas |
| Gluten | It is a family of proteins found in grains, including wheat, rye, spelt, and barley. |
| Hemp | It is a botanical class of Cannabis sativa cultivars grown specifically for industrial or medicinal use. |
| Hydrolysate | It is a form of protein manufactured by exposing the protein to enzymes that can partially break the bonds between the protein's amino acids and break down large, complicated proteins into smaller pieces. Its processing makes it easier and quicker to digest. |
| Hypoallergenic | It refers to a substance that causes fewer allergic reactions. |
| Isolate | It is the purest and most processed form of protein which has undergone separation to obtain a pure protein fraction. It typically contains ≥ 90% of protein by weight. |
| Keratin | It is a protein that helps form hair, nails, and the outer layer of skin. |
| Lactalbumin | It is the albumin contained in milk and obtained from whey. |
| Lactoferrin | It is an iron‑binding glycoprotein that is present in the milk of most mammals. |
| Lupin | It is the yellow legume seeds of the genus Lupinus. |
| Millenial | Also known as Generation Y or Gen Y, it refers to the people born from 1981 to 1996. |
| Monogastric | It refers to an animal with a single-compartmented stomach. Examples of monogastric include humans, poultry, pigs, horses, rabbits, dogs, and cats. Most monogastric are generally unable to digest much cellulose food materials such as grasses. |
| MPC | Milk protein concentrate |
| MPI | Milk protein isolate |
| MSPI | Methylated soy protein isolate |
| Mycoprotein | Mycoprotein is a form of single-cell protein, also known as fungal protein, derived from fungi for human consumption. |
| Nutricosmetics | It is a category of products and ingredients that act as nutritional supplements to care for skin, nails, and hair natural beauty. |
| Osteoporosis | It is a medical condition in which the bones become brittle and fragile from loss of tissue, typically as a result of hormonal changes, or deficiency of calcium or vitamin D. |
| PDCAAS | Protein digestibility-corrected amino acid score (PDCAAS) is a method of evaluating the quality of a protein based on both the amino acid requirements of humans and their ability to digest it. |
| Per-capita consumption of animal protein | It is the average amount of animal protein (such as milk, whey, gelatin, collagen, and egg proteins) that is readily available for consumption by each person in an actual population. |
| Per-capita consumption of plant protein | It is the average amount of plant protein (such as soy, wheat, pea, oat, and hemp proteins) that is readily available for consumption by each person in an actual population. |
| Quorn | It is a microbial protein manufactured using mycoprotein as an ingredient, in which the fungus culture is dried and mixed with egg albumen or potato protein, which acts as a binder, and then is adjusted in texture and pressed into various forms. |
| Ready-to-Cook (RTC) | It refers to food products that include all of the ingredients, where some preparation or cooking is required through a process that is given on the package. |
| Ready-to-Eat (RTE) | It refers to a food product prepared or cooked in advance, with no further cooking or preparation required before being eaten. |
| RTD | Ready-to-Drink |
| RTS | Ready-to-Serve |
| Saturated fat | It is a type of fat in which the fatty acid chains have all single bonds. It is generally considered unhealthy. |
| Sausage | It is a meat product made of finely chopped and seasoned meat, which may be fresh, smoked, or pickled and which is then usually stuffed into a casing. |
| Seitan | It is a plant-based meat substitute made out of wheat gluten. |
| Softgel | It is a gelatin-based capsule with a liquid fill. |
| SPC | Soy protein concentrate |
| SPI | Soy protein isolate |
| Spirulina | It is a biomass of cyanobacteria that can be consumed by humans and animals. |
| Stabilizer | It is an ingredient added to food products to help maintain or enhance their original texture, and physical and chemical characteristics. |
| Supplementation | It is the consumption or provision of concentrated sources of nutrients or other substances that are intended to supplement nutrients in the diet and is intended to correct nutritional deficiencies. |
| Texturant | It is a specific type of food ingredient that is used to control and alter the mouthfeel and texture of food and beverage products. |
| Thickener | It is an ingredient that is used to increase the viscosity of a liquid or dough and make it thicker, without substantially changing its other properties. |
| Trans fat | Also called trans-unsaturated fatty acids or trans fatty acids, it is a type of unsaturated fat that naturally occurs in small amounts in meat. |
| TSP | Textured soy protein |
| TVP | Textured vegetable protein |
| WPC | Whey protein concentrate |
| WPI | Whey protein isolate |


Research Methodology
Mordor Intelligence follows a four-step methodology in all our reports.
- Step-1: Identify Key Variables: The quantifiable key variables (industry and extraneous) pertaining to the specific product segment and country are selected from a group of relevant variables & factors based on desk research & literature review; along with primary expert inputs. These variables are further confirmed through regression modeling (wherever required).
- Step-2: Build a Market Model: In order to build a robust forecasting methodology, the variables and factors identified in Step-1 are tested against available historical market numbers. Through an iterative process, the variables required for market forecast are set and the model is built on the basis of these variables.
- Step-3: Validate and Finalize: In this important step, all market numbers, variables and analyst calls are validated through an extensive network of primary research experts from the market studied. The respondents are selected across levels and functions to generate a holistic picture of the market studied.
- Step-4: Research Outputs: Syndicated Reports, Custom Consulting Assignments, Databases & Subscription Platforms


