Market Overview
| Study Period | 2021 - 2031 |
|---|---|
| Forecast Data Period | 2026 - 2031 |
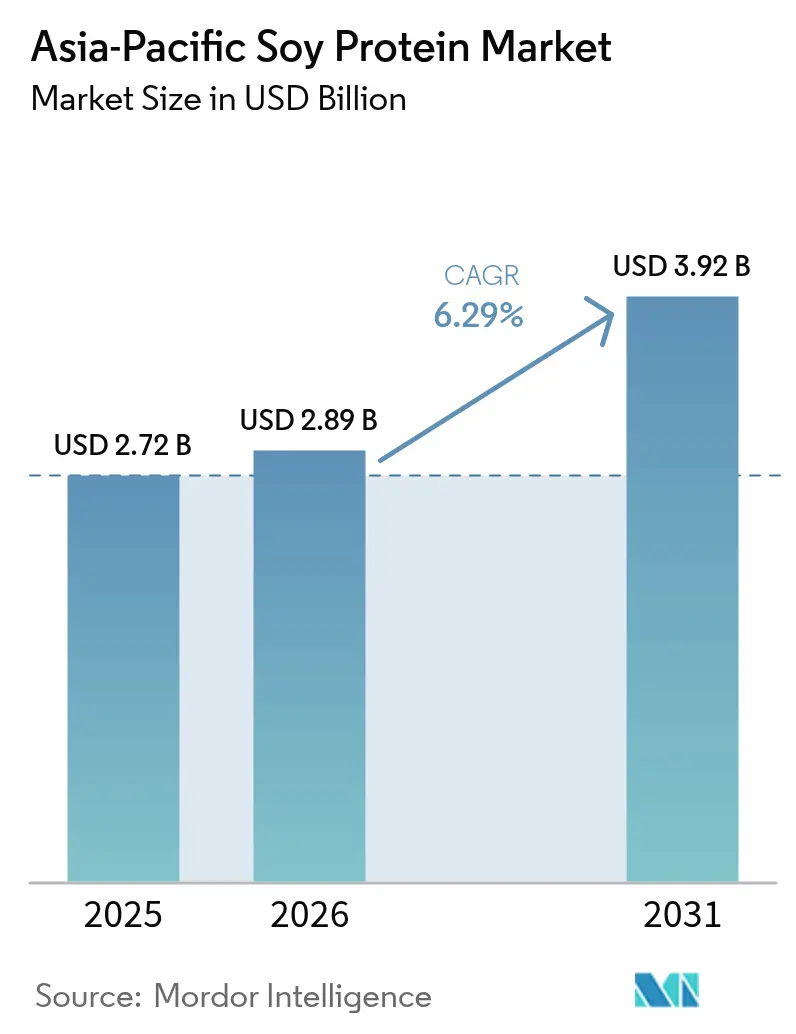
| Base Year Market Size (2025) | USD 2.72 Billion |
| Market Size (2026) | USD 2.89 Billion |
| Market Size (2031) | USD 3.92 Billion |
| Growth Rate (2026 - 2031) | 6.29% CAGR |
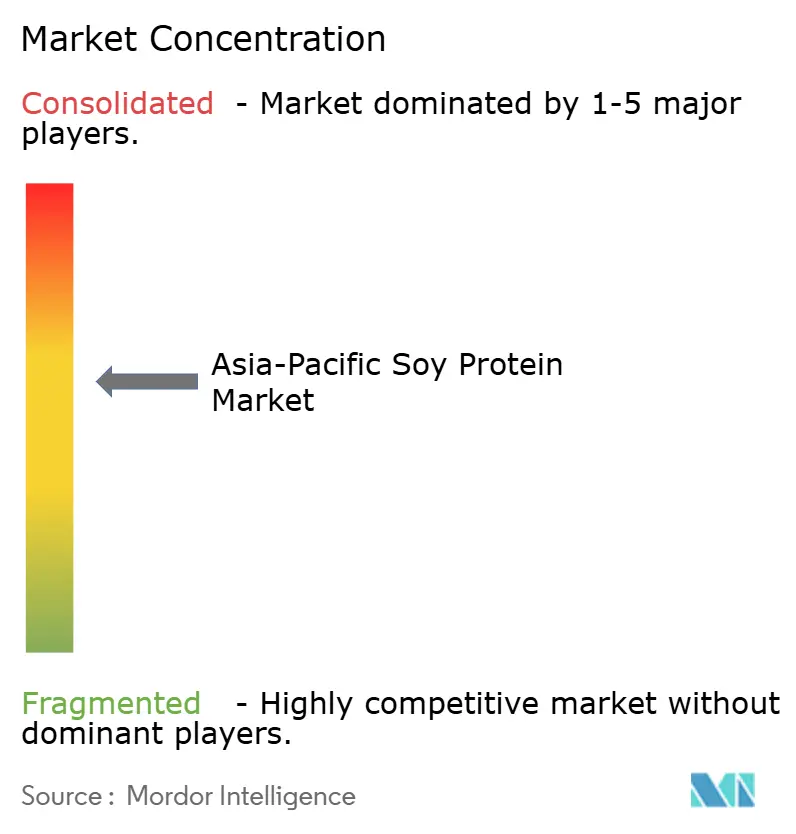
| Market Concentration | Medium |
Major Players
*Disclaimer: Major Players sorted in no particular order Image © Mordor Intelligence. Reuse requires attribution under CC BY 4.0. |
|
Asia-Pacific Soy Protein Market Analysis by Mordor Intelligence
Asia-Pacific soy protein market size in 2026 is estimated at USD 2.89 billion, growing from 2025 value of USD 2.72 billion with 2031 projections showing USD 3.92 billion, growing at 6.29% CAGR over 2026-2031. Growth stems from a steady pivot away from commodity feed uses toward premium, nutrition-focused applications such as infant formula, sports powders, and plant-based meat. Regulatory pushes on food security, wider consumer pursuit of sustainable protein, and scaling e-commerce channels are broadening regional reach. China retains the largest revenue share, yet Indonesia’s stronger income gains and new crushing assets give it the fastest growth runway. Supply-side headwinds import dependence in China, allergen-labeling compliance costs, and price sensitivity in rural markets temper momentum but also steer processors toward higher-margin hydrolyzed and textured formats. Competitive positioning now hinges on traceability, allergen transparency, and the ability to certify organic or non-GMO grades for export premiums.
Key Report Takeaways
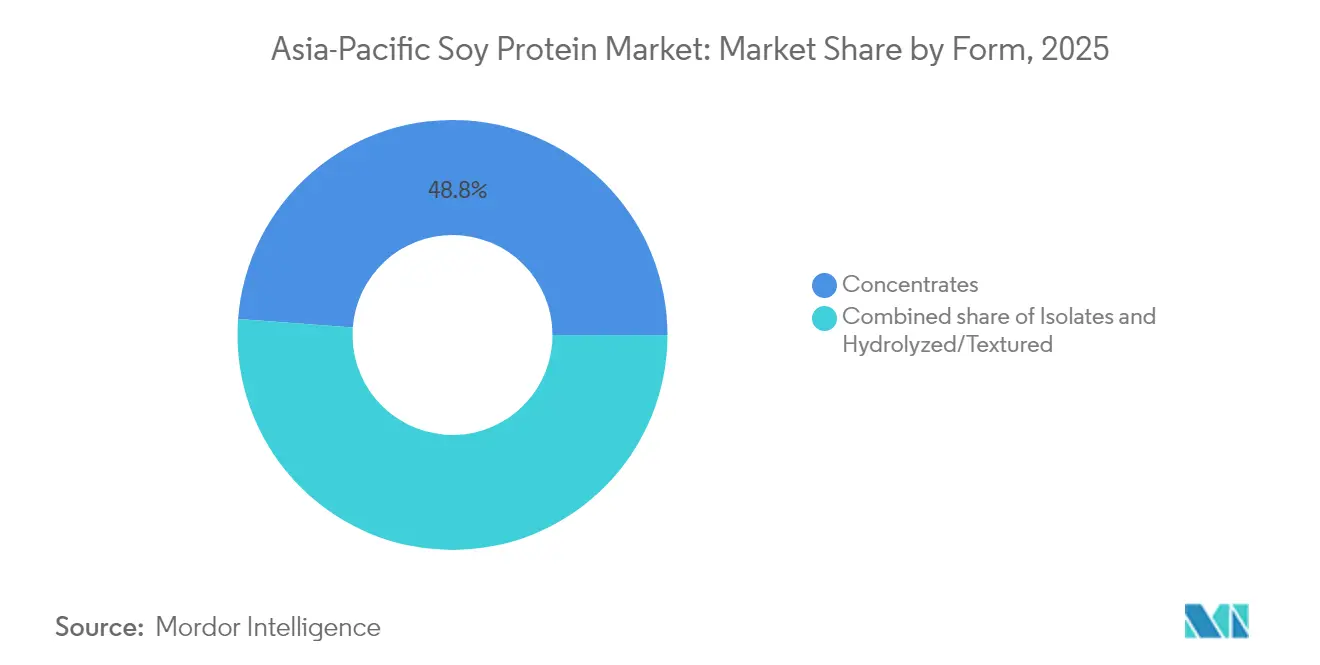
- By form, concentrates led with 48.82% revenue share in 2025; hydrolyzed and textured variants are advancing at a 7.29% CAGR to 2031.
- By nature, conventional variants accounted for 89.74% revenue share in 2025: organic variants are projected to grow at a faster CAGR of 7.65% through 2031.
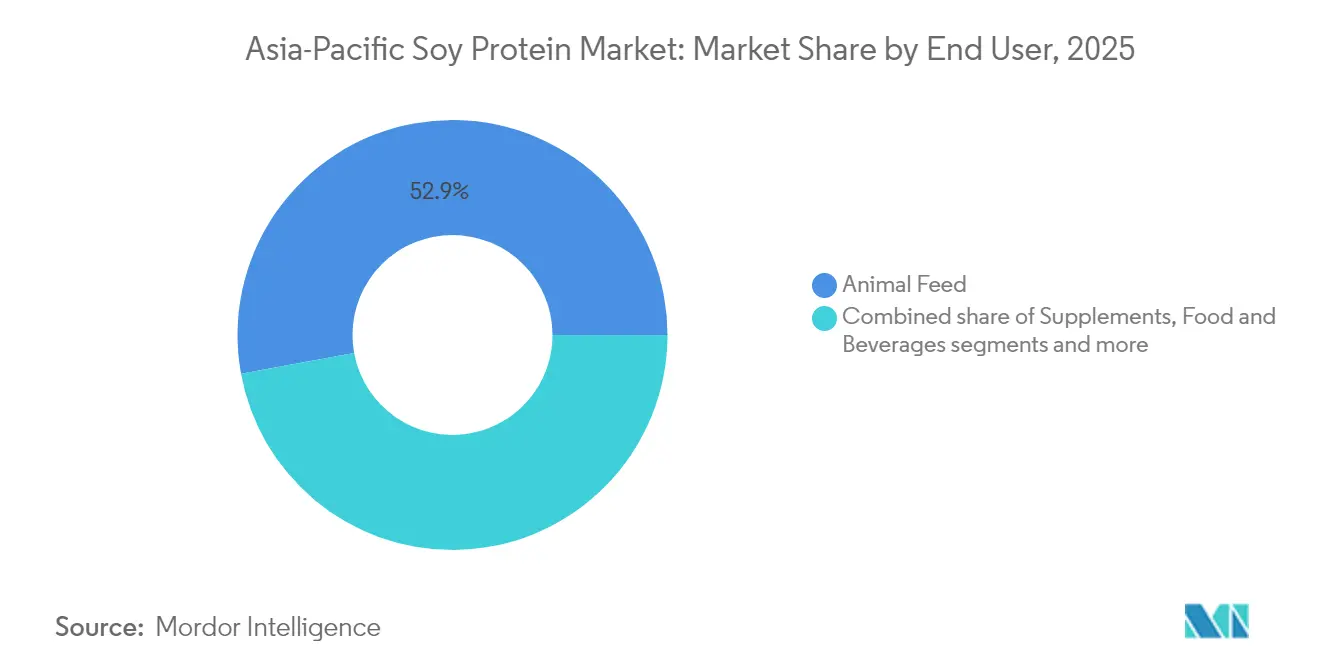
- By end user, animal feed accounted for 52.88% of 2025 demand, while supplements post the quickest 7.05% CAGR through 2031.
- By geography, China held 34.20% of 2025 revenue; Indonesia is progressing at a 7.38% CAGR to 2031.
Note: Market size and forecast figures in this report are generated using Mordor Intelligence’s proprietary estimation framework, updated with the latest available data and insights as of 2026.
Asia-Pacific Soy Protein Market Trends and Insights
Drivers Impact Analysis*
| Driver | (~) % Impact on CAGR Forecast | Geographic Relevance | Impact Timeline |
|---|---|---|---|
| Rising adoption of vegetarian and plant-based diets | +1.2% | China, India, Thailand, urban Asia-Pacific hubs | Medium term (2-4 years) |
| Increasing health awareness and demand for protein-rich foods | +1.5% | Japan, South Korea, Australia, urban China and India | Short term (≤ 2 years) |
| Rising consumption of bakery goods and convenient cereals | +0.9% | China, Indonesia, Philippines, Vietnam | Medium term (2-4 years) |
| Government initiatives focused on food security and sustainable protein sources | +1.3% | India, China, Indonesia | Long term (≥ 4 years) |
| Strong domestic soy production and processing infrastructure | +0.8% | China, India, Thailand | Long term (≥ 4 years) |
| Growing elderly population driving nutritional product demand | +1.0% | Japan, South Korea, China, Singapore | Medium term (2-4 years) |
| Source: Mordor Intelligence | |||


Rising adoption of vegetarian and plant-based diets
The rising adoption of vegetarian and plant-based diets is a key driver of the Asia-Pacific soy protein market, with consumer preferences shifting toward healthier and more sustainable protein sources. Madre Brava's 2024 Thailand Audience Strategy Research revealed[1]Source: Madre Brava, "Two-thirds of Thais want to reduce meat consumption and replace it with alternative and/or conventional plant-based proteins, for a healthier lifestyle", madrebrava.org that approximately two-thirds of Thai consumers are keen on reducing their meat consumption, opting instead for alternative or traditional plant-based proteins as part of a healthier lifestyle. This growing interest in plant-based diets is supported by increasing availability and affordability of soy protein products, along with the expanding variety of meat alternatives and dairy substitutes. Urbanization, rising disposable incomes, and heightened awareness about the environmental and health benefits of plant-based foods are further accelerating this trend. As per a UN-Habitat report, Asia is home to 54% of the world's urban population, translating to over 2.2 billion individuals. Projections indicate that by 2050, Asia's urban populace will swell by another 1.2 billion, marking a 50% increase[2]Source: UN-Habitat, "Asia and the Pacific Region", www.unhabitat.org. Food manufacturers and retailers in the region are rapidly innovating and expanding their plant-based product portfolios to meet evolving consumer demand. This shift is not only shaping dietary habits but also driving significant growth opportunities in the soy protein market across Asia-Pacific.
Increasing health awareness and demand for protein-rich foods
Increasing health awareness and the growing demand for protein-rich foods are key drivers of the Asia-Pacific soy protein market. Consumers in the region are becoming more conscious of the health benefits associated with protein intake, including muscle maintenance, weight management, and overall wellness. Soy protein, as a plant-based complete protein, appeals to a broad audience seeking nutritious, low-fat, and cholesterol-free alternatives to animal proteins. This heightened awareness is supplemented by the rise in lifestyle-related diseases, prompting many to opt for healthier dietary choices that include soy protein-rich foods and supplements. Additionally, the expanding food and beverage industry is innovating with fortified and functional products incorporating soy protein, targeting health-focused consumers. The combination of these factors is fueling sustained growth in the soy protein market across Asia-Pacific, driven by increasing consumer preference for clean, natural, and high-protein food options.
Government initiatives focused on food security and sustainable protein sources
Government initiatives focused on food security and sustainable protein sources are playing a crucial role in driving the growth of the Asia-Pacific soy protein market. Various governments across the region, including China, Japan, Malaysia, Singapore, and Indonesia, are implementing policies and programs to promote sustainable agricultural practices and alternative proteins as part of their national food security strategies. These initiatives include financial incentives, tax benefits, research and development grants, and public-private partnerships aimed at boosting production capacity, innovation, and adoption of soy protein products. For example, China’s Agricultural Modernization Plan sets ambitious targets to increase soybean production, while Singapore promotes alternative proteins through regulatory support and innovation funding to reduce reliance on traditional protein sources. Additionally, governments emphasize the importance of supporting local farmers and sustainable sourcing to create a resilient protein supply chain aligned with environmental goals.
Strong domestic soy production and processing infrastructure
Strong domestic soy production and processing infrastructure serve as a fundamental driver of the Asia-Pacific soy protein market. Countries such as China, India, Indonesia, and Malaysia have invested heavily in expanding their soybean cultivation areas and improving processing technologies, enabling them to reliably meet the rising demand for soy protein-based products. India's soybean production is expected to rise in 2024, supported by favorable weather conditions and improved agricultural practices that have led to increased yields. The Soybean Processors Association of India (SOPA) projects the production to reach nearly 1.26 million tonnes, reflecting a 6% growth compared to previous years[3]Source: India Brand Equity Foundation, "India's soybean production reaches 1.26 million tonnes: Trade body", ibef.org. Robust infrastructure encompassing advanced crushing facilities, extraction plants, and logistics networks ensures efficient production and distribution, enhancing cost competitiveness and product availability. For instance, integrated supply chains facilitate smooth procurement of raw soybeans and seamless processing into various soy protein forms including concentrates, isolates, and textured variants.
Restraints Impact Analysis*
| Restraint | (~) % Impact on CAGR Forecast | Geographic Relevance | Impact Timeline |
|---|---|---|---|
| Allergenic nature of soy limiting consumer acceptance | -0.7% | Japan, South Korea, urban China, Australia | Short term (≤ 2 years) |
| Strict regulatory frameworks requiring allergen labeling | -0.5% | China, Japan, South Korea, India | Medium term (2-4 years) |
| Limited awareness of soy protein benefits in some regions | -0.6% | Rural India, Indonesia, Philippines, Vietnam | Medium term (2-4 years) |
| Price sensitivity in lower-income markets | -0.8% | India, Indonesia, Philippines, rural China | Short term (≤ 2 years) |
| Source: Mordor Intelligence | |||
Allergenic nature of soy limiting consumer acceptance
The allergenic nature of soy protein can limit consumer acceptance in the Asia-Pacific soy protein market, posing a notable market restraint. Although soy allergies are relatively less prevalent in Asia compared to some Western countries, they still affect a segment of the population, particularly children. Food allergy studies indicate that soy is one of the recognized food allergens, and exposure can lead to symptoms ranging from mild oral reactions to more severe immune responses. This allergenic potential compels some consumers to avoid soy-based products, especially those with a known history of food allergies or sensitivities. Manufacturers often need to provide clear labeling and develop hypoallergenic soy protein variants to address these concerns. Despite soy's nutritional benefits, allergenicity remains a challenge for wider acceptance and market penetration, especially in sensitive consumer groups across Asia-Pacific.
Strict regulatory frameworks requiring allergen labeling
Strict regulatory frameworks requiring allergen labeling are a notable restraint for the Asia-Pacific soy protein market. Governments across the region, including major markets like China, Australia, and Thailand, have increasingly enforced mandatory allergen declaration on food products to protect consumers with food allergies and improve transparency. For example, China’s GB 7718-2025 standard introduces comprehensive requirements for clear allergen labeling, set to be fully enforced by 2027, ensuring consumers can easily identify potential allergens like soy. Similarly, Australia implemented mandatory allergen declaration requirements in 2024 to enhance consumer safety, and Thailand continues updating its labeling regulations in line with international best practices. These stringent regulations impose additional compliance burdens on manufacturers, such as meticulous product testing, detailed ingredient disclosures, and frequent documentation updates.
*Our forecasts treat driver/restraint impacts as directional, not additive. The impact forecasts reflect baseline growth, mix effects, and variable interactions.
Segment Analysis
By Form: Hydrolyzed Variants Capture Meat-Alternative Momentum
Concentrates held the largest market share in the Asia-Pacific soy protein market in 2025, accounting for approximately 48.82% of the revenue. This dominance is largely attributed to their cost-effectiveness and versatility, making them highly appealing for a range of applications. Concentrates are widely used in bakery products, dairy alternatives, and animal feed, where protein content ranging from 60% to 70% is sufficient to meet functional and nutritional requirements. Their affordability and adaptability allow manufacturers to incorporate soy protein into diverse formulations without significantly increasing production costs. Additionally, concentrates provide a good balance between protein quality and price, making them the preferred choice for many large-scale food producers. This segment’s broad applicability and economic feasibility continue to drive its market leadership across the region.
On the other hand, hydrolyzed and textured soy proteins represent the fastest growing segment, expected to expand at a compound annual growth rate (CAGR) of 7.29% through 2031, outpacing both concentrates and isolates. This rapid growth is primarily fueled by the rising demand from plant-based meat brands aiming to replicate the fibrous texture and mouthfeel of animal meat. Hydrolyzed soy proteins, produced via enzymatic hydrolysis, offer improved digestibility and functionality, making them increasingly popular in meat analog applications. Textured soy proteins are manufactured using high-temperature extrusion techniques, which help achieve the desirable fibrous structure essential for mimicking meat products. Plant-based meat manufacturers’ focus on delivering high-quality, protein-rich, and palatable alternatives has thus driven significant innovation and demand in this segment.


By Nature: Organic Certification Unlocks Export Premiums
The conventional soy protein segment held the largest revenue share in the Asia-Pacific market in 2025, accounting for 89.74% of the total. This dominance is primarily due to its widespread availability and cost efficiency, which make it highly attractive for mainstream food processing industries. Conventional soy protein products are produced using established agricultural practices, often relying on genetically modified soybeans to optimize yield and reduce costs. Their competitive pricing allows broad adoption across various applications, from bakery and dairy alternatives to animal feed. Additionally, the conventional segment benefits from mature supply chains and processing infrastructure, ensuring steady supply and quality consistency. This extensive market penetration has cemented its position as the backbone of the soy protein market throughout the Asia-Pacific region.
In contrast, the organic soy protein segment is the fastest growing, projected to expand at a compound annual growth rate (CAGR) of 7.65% through 2031. The growth is driven by increasing consumer preferences toward clean-label, non-GMO, and sustainably sourced products, which are perceived as healthier and environmentally friendly. Organic soy protein appeals particularly to health-conscious consumers and those following vegetarian or vegan lifestyles, who prioritize natural and chemical-free ingredients. Regulatory support in several countries and premium pricing further incentivize producers to expand organic soy offerings. Furthermore, rising awareness of sustainable agricultural practices boosts demand for organic soy protein across both food and beverage sectors. This trend positions the organic segment as a key growth opportunity, poised to gain increased market share as consumers gravitate toward healthier and more ethically produced protein sources.
By End User: Supplements Outpace Feed as Aging Demographics Reshape Demand
The animal feed segment commanded the largest share of end-user demand for soy protein in the Asia-Pacific market in 2025, accounting for 52.88% of the revenue. This dominance is closely linked to the region's significant role in aquaculture and poultry production, which require cost-effective and nutritionally rich protein sources for compound feeds. Soybean meal and soy protein concentrates are favored due to their high protein content, digestibility, and affordability, making them essential components in feed formulations supporting healthy growth and productivity of livestock and aquatic species. The extensive aquaculture clusters and poultry industries across countries like China, India, Vietnam, and Thailand drive consistent demand for soy proteins in feed applications. Moreover, innovations in feed formulations optimized for animal health and performance continue to reinforce the importance of soy protein in the animal feed sector.
In contrast, the supplements category is the fastest-growing segment, projected to expand at a compound annual growth rate (CAGR) of 7.05% through 2031. This growth is stimulated by demographic and lifestyle factors across key markets in the region. Aging populations in Japan and South Korea are fueling demand for protein supplements targeting muscle maintenance, bone health, and overall wellness. Urban centers in China witness rising consumption of sports nutrition products, reflecting increased health consciousness and active lifestyles. Additionally, government-backed infant nutrition and health programs in countries such as India and Indonesia stimulate demand for soy protein-based dietary supplements designed to support early childhood development. The supplements segment leverages soy protein’s functional and nutritional benefits, appealing to a broad consumer base from infants to the elderly
Geography Analysis
China held a substantial 34.20% share of the Asia-Pacific soy protein revenue in 2025, largely supported by the world's largest soybean crushing capacity. This dominant position is reinforced by China's vertically integrated supply chains, which cohesively link oilseed importers, protein extractors, and downstream food manufacturers. Such integration not only streamlines operations but also enhances cost efficiency and quality control throughout the production process. These capabilities position China as a pivotal player, effectively meeting both domestic demand and export requirements, while continuously advancing processing technologies to sustain its leadership in the soy protein market.
Indonesia is emerging as the fastest-growing market in the Asia-Pacific region, with a projected compound annual growth rate (CAGR) of 7.38% through 2031. This rapid expansion is driven by multiple factors, including a rising middle-class population with increased purchasing power and evolving dietary preferences toward protein-rich foods. Furthermore, government-backed food security initiatives are strengthening the domestic agriculture and processing sectors, encouraging investments in local soy processing infrastructure. These developments are contributing to Indonesia's growing self-reliance in soy protein production and enhancing its capacity to cater to both domestic consumption and regional demand.
Thailand, Vietnam, and Malaysia are developing into strategic export-oriented hubs for organic and non-genetically modified organism (non-GMO) soy protein products. These countries leverage their geographic proximity to Southeast Asian aquaculture clusters, facilitating the supply of plant-based proteins used in aquafeed formulations. Additionally, they benefit from preferential trade access within the Association of Southeast Asian Nations (ASEAN), an economic and political organization comprising ten Southeast Asian countries that promotes regional cooperation and trade facilitation. By focusing on high-quality, specialty soy protein segments, these nations are capitalizing on growing global demand for sustainable and clean-label protein sources, enhancing their competitiveness as exporters in the Asia-Pacific soy protein market.
Competitive Landscape
The Asia-Pacific soy protein market is moderately concentrated, dominated by multinational oilseed crushers such as Archer Daniels Midland, Wilmar International, and Bunge. These large players benefit from significant scale advantages in soybean procurement, processing capacity, and logistics networks. Their extensive infrastructure allows them to maintain cost leadership in producing commodity concentrates and soybean meal, serving broad markets efficiently. Their global scale and integrated supply chains enable them to compete effectively on price and volume, making them key incumbents in the region's soy protein industry.
Vertically integrated Chinese producers, including Yantai Shuangta, Shandong Yuwang, and Gushen Biotechnology, also maintain strong competitive positioning within the region. These companies leverage control over multiple stages of production from soybean farming to processing, enabling operational efficiencies and quality control. Their local expertise and large domestic soybean crushing capacity support their leadership in supplying soy protein concentrates and isolates to both domestic and export markets. Additionally, their scale allows them to respond swiftly to changes in demand and regulatory environments, further strengthening their market positions.
Despite dominance by these large incumbents, smaller specialty processors are increasingly capturing premium market niches. These include organic soy protein isolates, hydrolyzed proteins, and textured soy protein variants designed for plant-based meat alternatives. These specialty segments offer higher margins and growing demand driven by increasing consumer preference for organic and sustainable products as well as the plant-based protein trend. Smaller players focus on innovation and agility to develop value-added products with specific functionalities, differentiating themselves from commodity producers and carving out profitable spaces in the evolving Asia-Pacific market. This dynamic mix of large multinationals, integrated domestic processors, and agile specialty firms defines the market’s competitive landscape.
Asia-Pacific Soy Protein Industry Leaders
-
Archer Daniels Midland Company
-
Cargill, Incorporated
-
Wilmar International Limited
-
CHS Inc.
-
COFCO Corporation
- *Disclaimer: Major Players sorted in no particular order

Recent Industry Developments
- October 2025: Indonesia is intensifying efforts to achieve soybean self-sufficiency by expanding cooperation between the defense and agriculture sectors to boost domestic production. The Indonesian Navy has contributed by cultivating 30 hectares of land, yielding about 60 tons of soybeans, which is considered initial success for the national self-sufficiency program.
- July 2025: Bunge merged with Viterra, solidifying its position as one of the world's foremost grain companies. This strategic union is expected to expedite Bunge's mission of connecting farmers to consumers and facilitating the delivery of essential food, feed, and fuel to people around the globe.
- April 2025: Fuji Oil Holdings Inc. transitioned to a business holding company structure. This strategic move sought to bolster profitability and sustainability in its soy-based ingredients division, enhancing market position through optimized resource allocation across its business units.


Asia-Pacific Soy Protein Market Report Scope
Concentrates, Isolates, Textured/Hydrolyzed are covered as segments by Form. Animal Feed, Food and Beverages, Personal Care and Cosmetics, Supplements are covered as segments by End User. Australia, China, India, Indonesia, Japan, Malaysia, New Zealand, South Korea, Thailand, Vietnam are covered as segments by Country.
Form
| Isolates |
| Concentrates |
| Hydrolyzed/Textured |
Nature
| Conventional |
| Organic |
End User
| Food and Beverages | Bakery |
| Beverages | |
| Breakfast Cereals | |
| Condiments / Sauces | |
| Dairy & Dairy-Alternative | |
| Meat / Poultry / Seafood Alternatives | |
| RTE / RTC Meals | |
| Snacks | |
| Animal Feed | |
| Supplements | Baby Food and Infant Formula |
| Elderly and Medical Nutrition | |
| Sport/Performance Nutrition | |
| Personal Care and Cosmetics |
Country
| Australia |
| China |
| India |
| Indonesia |
| Japan |
| Malaysia |
| Philippines |
| South Korea |
| Thailand |
| Vietnam |
| Rest of Asia-Pacific |
| Form | Isolates | |
| Concentrates | ||
| Hydrolyzed/Textured | ||
| Nature | Conventional | |
| Organic | ||
| End User | Food and Beverages | Bakery |
| Beverages | ||
| Breakfast Cereals | ||
| Condiments / Sauces | ||
| Dairy & Dairy-Alternative | ||
| Meat / Poultry / Seafood Alternatives | ||
| RTE / RTC Meals | ||
| Snacks | ||
| Animal Feed | ||
| Supplements | Baby Food and Infant Formula | |
| Elderly and Medical Nutrition | ||
| Sport/Performance Nutrition | ||
| Personal Care and Cosmetics | ||
| Country | Australia | |
| China | ||
| India | ||
| Indonesia | ||
| Japan | ||
| Malaysia | ||
| Philippines | ||
| South Korea | ||
| Thailand | ||
| Vietnam | ||
| Rest of Asia-Pacific | ||


Market Definition
- End User - The Protein Ingredients Market operates on a B2B basis. Food, Beverages, Supplements, Animal Feed, and Personal Care & Cosmetic manufacturers are considered to be end-consumers in the market studied. The scope excludes manufacturers buying liquid/dry whey to be used for application as a binding agent or thickener or other non-protein applications.
- Penetration Rate - Penetration Rate is defined as the percentage of Protein-Fortified End User Market Volume in the Overall End User Market Volume.
- Average Protein Content - Average protein content is the average protein content present per 100 g of product manufactured by all end-user companies considered under the scope of this report.
- End User Market Volume - End-user market volume is the consolidated volume of all types and forms of end-user products in the country or region.
| Keyword | Definition |
|---|---|
| Alpha-lactalbumin (α-Lactalbumin) | It is a protein that regulates the production of lactose in the milk of almost all mammalian species. |
| Amino acid | It is an organic compound that contains both amino and carboxylic acid functional groups, which are required for the synthesis of body protein and other important nitrogen-containing compounds, such as creatine, peptide hormones, and some neurotransmitters. |
| Blanching | It is the process of briefly heating vegetables with steam or boiling water. |
| BRC | British Retail Consortium |
| Bread improver | It is a flour-based blend of several components with specific functional properties designed to modify dough characteristics and give quality attributes to bread. |
| BSF | Black Soldier Fly |
| Caseinate | It is a substance produced by adding an alkali to acid casein, a derivative of casein. |
| Celiac disease | Celiac disease is an immune reaction to eating gluten, a protein found in wheat, barley, and rye. |
| Colostrum | It is a milky fluid that’s released by mammals that have recently given birth before breast milk production begins. |
| Concentrate | It is the least processed form of protein and has a protein content ranging from 40-90% by weight. |
| Dry protein basis | It refers to the percentage of "pure protein" present in a supplement after the water in it is completely removed through heat. |
| Dry whey | It is the product resulting from drying fresh whey which has been pasteurized and to which nothing has been added as a preservative. |
| Egg protein | It is a mixture of individual proteins, including ovalbumin, ovomucoid, ovoglobulin, conalbumin, vitellin, and vitellenin. |
| Emulsifier | It is a food additive that facilitates the blending of foods that are immiscible with one another, such as oil and water. |
| Enrichment | It is the process of addition of micronutrients that are lost during the processing of the product. |
| ERS | Economic Research Service of the USDA |
| Extrusion | It is the process of forcing soft mixed ingredients through an opening in a perforated plate or die designed to produce the required shape. The extruded food is then cut to a specific size by blades. |
| Fava | Also known as Faba, it is another word for yellow split beans. |
| FDA | Food and Drug Administration |
| Flaking | It is a process in which typically a cereal grain (like corn, wheat, or rice) is broken down into grits, cooked with flavors and syrups, and then pressed into flakes between cooled rollers. |
| Foaming agent | It is a food ingredient that makes it possible to form or maintain a uniform dispersion of a gaseous phase in a liquid or solid food. |
| Foodservice | It refers to the part of the food industry which includes businesses, institutions, and companies which prepare meals outside the home. It includes restaurants, school and hospital cafeterias, catering operations, and many other formats. |
| Fortification | It is the deliberate addition of micronutrients that are not found in them naturally or which are lost during processing, to improve a food product's nutritional value. |
| FSANZ | Food Standards Australia New Zealand |
| FSIS | Food Safety and Inspection Service |
| FSSAI | Food Safety and Standards Authority of India |
| Gelling agent | It is an ingredient that functions as a stabilizer and thickener to provide thickening without stiffness through the formation of gel. |
| GHG | Greenhouse Gas |
| Gluten | It is a family of proteins found in grains, including wheat, rye, spelt, and barley. |
| Hemp | It is a botanical class of Cannabis sativa cultivars grown specifically for industrial or medicinal use. |
| Hydrolysate | It is a form of protein manufactured by exposing the protein to enzymes that can partially break the bonds between the protein's amino acids and break down large, complicated proteins into smaller pieces. Its processing makes it easier and quicker to digest. |
| Hypoallergenic | It refers to a substance that causes fewer allergic reactions. |
| Isolate | It is the purest and most processed form of protein which has undergone separation to obtain a pure protein fraction. It typically contains ≥ 90% of protein by weight. |
| Keratin | It is a protein that helps form hair, nails, and the outer layer of skin. |
| Lactalbumin | It is the albumin contained in milk and obtained from whey. |
| Lactoferrin | It is an iron‑binding glycoprotein that is present in the milk of most mammals. |
| Lupin | It is the yellow legume seeds of the genus Lupinus. |
| Millenial | Also known as Generation Y or Gen Y, it refers to the people born from 1981 to 1996. |
| Monogastric | It refers to an animal with a single-compartmented stomach. Examples of monogastric include humans, poultry, pigs, horses, rabbits, dogs, and cats. Most monogastric are generally unable to digest much cellulose food materials such as grasses. |
| MPC | Milk protein concentrate |
| MPI | Milk protein isolate |
| MSPI | Methylated soy protein isolate |
| Mycoprotein | Mycoprotein is a form of single-cell protein, also known as fungal protein, derived from fungi for human consumption. |
| Nutricosmetics | It is a category of products and ingredients that act as nutritional supplements to care for skin, nails, and hair natural beauty. |
| Osteoporosis | It is a medical condition in which the bones become brittle and fragile from loss of tissue, typically as a result of hormonal changes, or deficiency of calcium or vitamin D. |
| PDCAAS | Protein digestibility-corrected amino acid score (PDCAAS) is a method of evaluating the quality of a protein based on both the amino acid requirements of humans and their ability to digest it. |
| Per-capita consumption of animal protein | It is the average amount of animal protein (such as milk, whey, gelatin, collagen, and egg proteins) that is readily available for consumption by each person in an actual population. |
| Per-capita consumption of plant protein | It is the average amount of plant protein (such as soy, wheat, pea, oat, and hemp proteins) that is readily available for consumption by each person in an actual population. |
| Quorn | It is a microbial protein manufactured using mycoprotein as an ingredient, in which the fungus culture is dried and mixed with egg albumen or potato protein, which acts as a binder, and then is adjusted in texture and pressed into various forms. |
| Ready-to-Cook (RTC) | It refers to food products that include all of the ingredients, where some preparation or cooking is required through a process that is given on the package. |
| Ready-to-Eat (RTE) | It refers to a food product prepared or cooked in advance, with no further cooking or preparation required before being eaten. |
| RTD | Ready-to-Drink |
| RTS | Ready-to-Serve |
| Saturated fat | It is a type of fat in which the fatty acid chains have all single bonds. It is generally considered unhealthy. |
| Sausage | It is a meat product made of finely chopped and seasoned meat, which may be fresh, smoked, or pickled and which is then usually stuffed into a casing. |
| Seitan | It is a plant-based meat substitute made out of wheat gluten. |
| Softgel | It is a gelatin-based capsule with a liquid fill. |
| SPC | Soy protein concentrate |
| SPI | Soy protein isolate |
| Spirulina | It is a biomass of cyanobacteria that can be consumed by humans and animals. |
| Stabilizer | It is an ingredient added to food products to help maintain or enhance their original texture, and physical and chemical characteristics. |
| Supplementation | It is the consumption or provision of concentrated sources of nutrients or other substances that are intended to supplement nutrients in the diet and is intended to correct nutritional deficiencies. |
| Texturant | It is a specific type of food ingredient that is used to control and alter the mouthfeel and texture of food and beverage products. |
| Thickener | It is an ingredient that is used to increase the viscosity of a liquid or dough and make it thicker, without substantially changing its other properties. |
| Trans fat | Also called trans-unsaturated fatty acids or trans fatty acids, it is a type of unsaturated fat that naturally occurs in small amounts in meat. |
| TSP | Textured soy protein |
| TVP | Textured vegetable protein |
| WPC | Whey protein concentrate |
| WPI | Whey protein isolate |


Research Methodology
Mordor Intelligence follows a four-step methodology in all our reports.
- Step-1: Identify Key Variables: The quantifiable key variables (industry and extraneous) pertaining to the specific product segment and country are selected from a group of relevant variables & factors based on desk research & literature review; along with primary expert inputs. These variables are further confirmed through regression modeling (wherever required).
- Step-2: Build a Market Model: In order to build a robust forecasting methodology, the variables and factors identified in Step-1 are tested against available historical market numbers. Through an iterative process, the variables required for market forecast are set and the model is built on the basis of these variables.
- Step-3: Validate and Finalize: In this important step, all market numbers, variables and analyst calls are validated through an extensive network of primary research experts from the market studied. The respondents are selected across levels and functions to generate a holistic picture of the market studied.
- Step-4: Research Outputs: Syndicated Reports, Custom Consulting Assignments, Databases & Subscription Platforms


