Market Overview
| Study Period | 2020 - 2031 |
|---|---|
| Forecast Data Period | 2026 - 2031 |
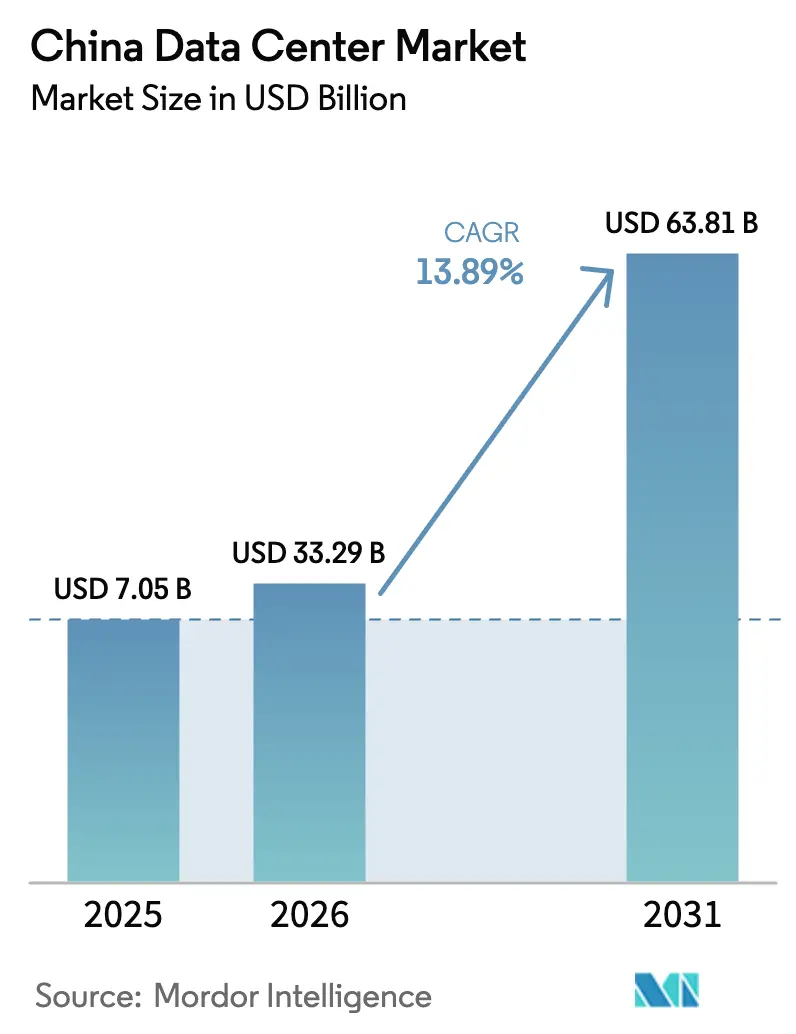
| Base Year Market Size (2025) | USD 7.05 Billion |
| Market Size (2026) | USD 33.29 Billion |
| Market Size (2031) | USD 63.81 Billion |
| Growth Rate (2026 - 2031) | 13.89% CAGR |
| Market Concentration | Medium |
Major Players
*Disclaimer: Major Players sorted in no particular order Image © Mordor Intelligence. Reuse requires attribution under CC BY 4.0. |
|
China Data Center Market Analysis by Mordor Intelligence
The China Data Center Market size was valued at USD 29.23 billion in 2025 and estimated to grow from USD 33.29 billion in 2026 to reach USD 63.81 billion by 2031, at a CAGR of 13.89% during the forecast period (2026-2031). In terms of IT Load Capacity, the market is expected to grow from 7.05 thousand megawatt in 2025 to 9.37 thousand megawatt by 2030, at a CAGR of 5.85% during the forecast period from 2025 to 2030. The market segment shares and estimates are calculated and reported in terms of MW. This capacity expansion reflects the country’s shift toward AI-optimized infrastructure, where hyperscale operators are responding to sovereign cloud mandates and GPU-driven rack densities that often exceed 100 kW. Rising state investments in digital sovereignty, aggressive 5G rollouts, and a maturing liquid-cooling supply chain collectively sustain demand, while Western China incentives unlock renewable-powered sites that alleviate stress on the coastal power grid. Competitive intensity remains moderate because strict security certifications and export curbs on advanced GPUs erect barriers that limit new entrants but do not allow any one provider to dominate. Operators able to combine sovereign-grade compliance with AI-ready capacity capture premium pricing, especially where rack densities command rates 30-50% higher than those of legacy colocation.
Key Report Takeaways
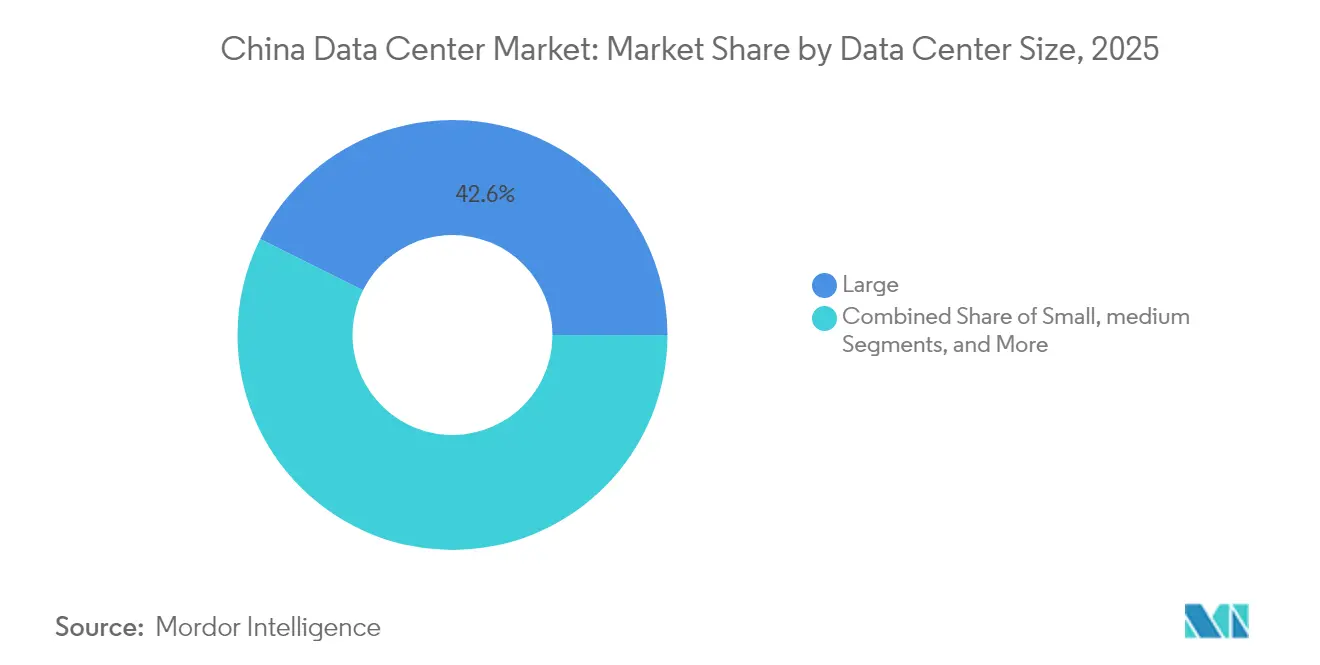
- By data center size, large facilities held 42.63% of the China data center market share in 2025, while medium facilities are forecast to register the fastest 6.86% CAGR through 2031.
- By tier standard, Tier 3 sites accounted for 60.08% share of the China data center market size in 2025, whereas Tier 4 sites are projected to grow at a 6.65% CAGR.
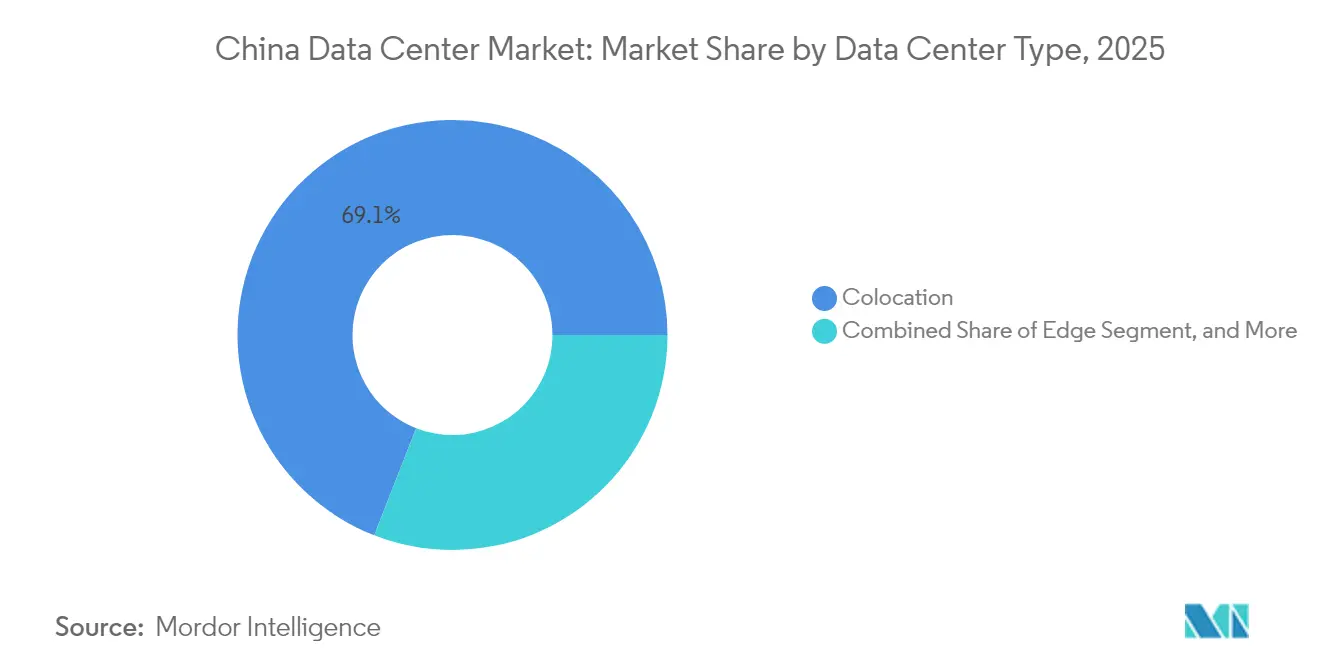
- By data center type, colocation services led with 69.07% market share in 2025, yet hyperscale self-built facilities are poised for a 6.73% CAGR under sovereign cloud mandates.
- By end-user industry, IT and telecom captured a 49.21% market share in 2025; BFSI is set to accelerate at an 7.88% CAGR on the back of digital yuan infrastructure investments.
- By hotspot, Beijing retained a 28.35% share in 2025, but the Rest of China is expected to expand at the highest 7.01% CAGR as Western clusters gain policy support.
Note: Market size and forecast figures in this report are generated using Mordor Intelligence’s proprietary estimation framework, updated with the latest available data and insights as of 2026.
China Data Center Market Trends and Insights
Drivers Impact Analysis*
| Driver | (~) % Impact on CAGR Forecast | Geographic Relevance | Impact Timeline |
|---|---|---|---|
| Excess demand for high-density racks from AI training workloads | +1.2% | National, concentrated in Beijing and Shenzhen tech corridors | Medium term (2-4 years) |
| Surge in sovereign cloud spending by Chinese state-owned enterprises | +0.8% | National, with priority in strategic sectors | Long term (≥ 4 years) |
| Rapid roll-out of 5G and edge nodes boosting micro-DC demand | +0.6% | National, accelerated in Tier-1 and Tier-2 cities | Short term (≤ 2 years) |
| Growing availability of green power trading quotas for DC operators | +0.5% | Western China clusters, expanding to coastal regions | Long term (≥ 4 years) |
| Mainstream adoption of liquid cooling in new hyperscale builds | +0.4% | National, led by hyperscale operators | Medium term (2-4 years) |
| Government incentives for Western China DC clusters to offload coastal loads | +0.3% | Western provinces, particularly Inner Mongolia and Xinjiang | Long term (≥ 4 years) |
| Source: Mordor Intelligence | |||
Excess Demand for High-Density Racks from AI Training Workloads
AI training clusters now draw more than 100 kW per rack, a tenfold leap over legacy deployments, forcing operators to redesign power and cooling at greenfield sites and retrofit older halls to avoid stranded capacity. [1]Supermicro Computer, “GPU Server Shipment Milestones and AI Infrastructure Trends,” SUPERMICRO.COM Direct-to-chip liquid cooling eliminates thermal bottlenecks and achieves PUE below 1.15, well inside China’s sub-1.3 mandate, yet it introduces higher upfront capex and calls for specialized maintenance skills. Operators meeting these specifications charge 30-50% premiums for GPU-ready racks, creating a differentiated revenue stream. Compliance layers under the Network Data Security Management Regulations further constrain site options, so facilities that combine AI density with certified data-sovereign walls gain decisive pricing power.
Surge in Sovereign Cloud Spending by Chinese State-Owned Enterprises
The National Data Infrastructure Construction Guidelines require state-owned enterprises to migrate 80% of non-sensitive workloads to domestic clouds by 2027, locking in multi-year capacity reservations that improve visibility for builders. [2]State-owned Assets Supervision and Administration Commission, “SOE Digital Transformation and Cloud. As SOEs place long-term orders, developers enjoy lower vacancy risk and more favorable financing, although they must prove end-to-end infrastructure ownership and stringent encryption protocols that foreign hyperscalers cannot match. Capital intensity rises because purpose-built halls integrate trusted modules, enhanced physical security, and real-time audit gateways, but the guaranteed revenue tail offsets cost pressures. In parallel, SOE demand for AI model training shifts spend from generalized compute into GPU-dense nodes, intertwining the sovereign cloud push with the AI hardware cycle.
Rapid Roll-out of 5G and Edge Nodes Boosting Micro-DC Demand
China Mobile alone had installed 3.7 million 5G base stations by 2024, each requiring low-latency processing within 10 milliseconds for autonomous vehicles, industrial robots, and AR services. [3]China Mobile Limited, “5G Base Station Deployment and Edge Computing Strategy,” CHINAMOBILE.COMThe dense radio network supports thousands of micro data centers, ranging from 50 kW to 500 kW, an architecture that favors local real estate holders and specialized integrators over traditional hyperscale firms. However, capacity per site is modest, aggregate demand scales quickly because roll-outs cover hundreds of cities. Unmanned operations, AI-assisted maintenance, and modular prefabrication reduce opex, yet introduce cybersecurity and orchestration complexities that create a services upsell for managed-edge providers.
Growing Availability of Green Power Trading Quotas for DC Operators
Renewable-rich provinces such as Inner Mongolia, Xinjiang, and Gansu now offer long-term green-power quotas that allow data center operators to execute virtual power purchase agreements without grid-curtailment risk. The arrangement supplies competitively priced wind and solar electricity, enabling facilities to achieve carbon-neutral operations in line with China’s dual-carbon goals. Early adopters differentiate via green-facility labels that attract multinational customers requiring verifiable renewable energy. However, transmission constraints mean that quota allocations often hinge on ultra-high-voltage line availability, pressing operators to assess grid-tie reliability as part of site selection.
Restraints Impact Analysis*
| Restraint | (~) % Impact on CAGR Forecast | Geographic Relevance | Impact Timeline |
|---|---|---|---|
| Inter-provincial power transfer congestion limits site selection | -0.7% | National, particularly affecting Western China clusters | Medium term (2-4 years) |
| Stricter PUE caps (<1.3) raising capex for legacy facilities | -0.4% | National, concentrated in Tier-1 cities | Short term (≤ 2 years) |
| Rising land-use taxes around Tier-1 cities | -0.3% | Beijing, Shanghai, Shenzhen metropolitan areas | Long term (≥ 4 years) |
| Export restrictions on advanced GPUs slowing AI cluster expansions | -0.2% | National, affecting hyperscale and enterprise segments | Medium term (2-4 years) |
| Source: Mordor Intelligence | |||
Inter-Provincial Power Transfer Congestion Limits Site Selection
Ultra-high-voltage corridors already operate at up to 95% utilization during peak periods, constraining the ability of wind-rich Western provinces to meet coastal computing loads. Grid operators may prioritize residential and industrial consumption over data center draw, forcing companies to accept redundancy schemes or on-site storage to mitigate the risk of curtailment. These safeguards elevate capex and complicate power purchase agreements, diminishing the cost advantage of inland sites unless transmission infrastructure expands in tandem with new capacity.
Stricter PUE Caps Raising Capex for Legacy Facilities
Regulators now compel existing halls to retrofit toward a PUE below 1.3, a threshold that many pre-2020 sites exceed by up to 50%. Achieving compliance requires liquid-cooling retrofits, airflow containment, and next-generation power modules, often adding USD 500-800 per kW in incremental cost. Smaller operators lacking scale face disproportionate financial strain, and non-compliance can trigger forced shutdowns, creating churn in the secondary-capacity market as tenants migrate to modern, efficient sites.
*Our forecasts treat driver/restraint impacts as directional, not additive. The impact forecasts reflect baseline growth, mix effects, and variable interactions.
Segment Analysis
By Data Center Size: Medium Sites Bridge the Cloud-to-Edge Divide
Medium facilities, typically 1-10 MW, registered the fastest 6.86% CAGR and are expected to solidify their role as the connective tissue between hyperscale clouds and edge devices. In 2025, large installations still accounted for 42.63% of total capacity within the China data center market, reflecting hyperscale AI training requirements that tend to require massive compute footprints. The medium-size cohort benefits from proximity to end users, lower latency, and regulatory flexibility, making it ideal for regional SaaS clusters and industrial IoT gateways. Developers leverage modular construction to shorten build cycles to under 12 months, capturing demand spikes from software launches and regional 5G densification. As liquid-cooling costs decline, medium-sized halls can accommodate GPU-dense racks without the extensive power spine required at megascale, preserving margins while meeting performance targets.
From a cost-of-capital perspective, banks view mid-range projects as lower-risk than Greenfield hyperscale builds because tenant concentration is lower and lease tenures are shorter. Operators blend wholesale contracts with retail colocation to maintain utilization above 80%, a threshold that drives attractive EBITDA yields. The balance between density and scale explains why the medium category acts as an early proving ground for innovations such as rack-level direct liquid cooling or on-site hydrogen backup. Over the next five years, medium sites are poised to capture incremental provincial incentives that favor edge compute proliferation, sustaining their outperformance relative to the broader China data center market.


By Tier Standard: Tier 4 Gains Momentum for Mission-Critical Loads
Tier 3 halls, with 60.08% share in 2025, remain the workhorse of the China data center market, offering 99.982% availability at an efficient cost point. Yet Tier 4 capacity grows at 6.65% CAGR as BFSI and algorithmic trading workloads demand 99.995% uptime. The upgraded tier integrates 2N+1 redundancy across power, cooling, and network layers, translating to higher leasing rates that BFSI tenants accept to safeguard millisecond-sensitive transactions. Government e-services that deploy digital yuan frameworks also tend to gravitate towards Tier 4 designs to meet the specifications of the Data Security Law.
Operators pursuing Tier 4 certifications face capex premiums of 10-15%, primarily in duplicate chillers, switchgear, and network fabrics. The payback period compresses when power densities exceed 50 kW per rack, as higher rack revenue mitigates capital costs. Moreover, investors see Tier 4 assets as inflation-protected due to sticky contracts extending five years or longer. Consequently, the tier upgrade trend aligns with the strategic shift toward high-value, AI-centric workloads, reinforcing the upward-quality migration within the China data center market.
By Data Center Type: Hyperscale Self-Builds Accelerate under Sovereign Mandates
Colocation still dominates with 69.07% share, reflecting legacy enterprise outsourcing and multitenant economics. However, hyperscale self-builds post the fastest 6.73% CAGR as cloud majors internalize risk, meet sovereignty requirements, and customize infrastructure for AI clusters. Self-builds allow Alibaba, Tencent, and Baidu to deploy immersion-cooled tanks or GPU-optimized power trains without negotiating facility retrofits, thus accelerating time-to-market for new AI services. They also secure full lifecycle control over hardware supply chains, crucial when U.S. export regulations tighten GPU availability.
Wholesale colocation adapts by shifting toward fit-out-ready shells, enabling hyperscalers to lease raw space and install bespoke gear. For enterprise customers, retail colocation remains attractive for compliance-light workloads. The hybrid landscape pushes operators to maintain both wholesale and retail capability, often within the same campus. As sovereign cloud directives mature, the China data center market size attributed to self-builds is poised to rise further, even while colocation continues to serve a diversified tenant base.
By End User Industry: BFSI Demand Surges on Digital Yuan Roll-Out
IT and telecom retained 49.21% share in 2025, yet BFSI is on track for an 7.88% CAGR through 2031, outpacing all other verticals. Central bank digital currency pilots require distributed-ledger nodes hosted in compliant domestic facilities, shifting substantial loads from bank premises into Tier 4-certified halls. Simultaneously, algorithmic trading engines and risk analytics clusters are migrating toward GPU-accelerated platforms that consume rack densities exceeding 40 kW, further fueling the segment’s appetite for high-spec capacity.
Regulatory scrutiny from the China Banking and Insurance Regulatory Commission stipulates data residency, prompting foreign-hosted fintechs to repatriate their applications to the China data center market. Beyond BFSI, e-commerce sites scaling livestream transactions and manufacturing firms rolling out Industry 4.0 robotics continue to maintain steady growth, yet none match the velocity of financial workloads. As digital payments and wealth-tech platforms proliferate, BFSI is set to become the bellwether of premium pricing trends across the China data center industry.
Geography Analysis
Beijing continues to anchor the China data center market with a 28.35% share, thanks to dense demand from AI research labs, internet majors, and public-sector clouds. However, power and real estate scarcity lead operators to fringe districts such as Yanqing, where land costs are undercut by 30% compared to the urban core, and new fiber corridors bolster connectivity. The rest of China, encompassing Inner Mongolia, Gansu, and Xinjiang, expands at a 7.01% CAGR as national incentives and renewable abundance combine to draw hyperscale investments.
The rest of China consolidates its position as the most dynamic sub-region in the China data center market, driven by national policy that earmarks Western clusters as the primary vehicle for absorbing data-sovereignty spend while alleviating coastal power stress. Inner Mongolia boasts an average site PUE of below 1.25 by leveraging sub-zero winters for free cooling, while Xinjiang pairs 24-hour solar-plus-wind hybrid plants with redundant looped feeders to ensure a high-availability supply. Transmission congestion still curbs unrestrained build-out, so operators hedge by adding on-site battery energy storage sized at 15% of IT load, cushioning against curtailment.
Weinan and Huai’an typify the emergence of cost-optimized, connectivity-rich secondary markets. Weinan’s municipal authorities reduce business-tax surcharges for data centers by 50% for three years in exchange for local hiring commitments, lowering operators’ payback periods on 20 MW campuses. Huai’an entices edge operators with dark-fiber packages bundled into land grants, slashing network opex and enabling ultra-low latency routing to Shanghai’s Stock Exchange trading engines. Collectively, these trends illustrate how the China data center market is evolving into a multi-node ecosystem where each geography plays a specialized role in supporting the country’s AI ambitions.
Competitive Landscape
China’s data center arena displays moderate concentration as telecom-affiliated giants such as China Telecom, China Mobile, and China Unicom leverage nationwide fiber backbones and favorable spectrum allocations to retain large contract volume. GDS Holdings and VNET dominate premium wholesale colocation, courting hyperscale cloud providers with campus-style footprints that integrate green power and submarine-cable gateways. Foreign ownership caps and data-localization laws restrict the direct presence of international hyperscalers, channeling them into minority-stake structures with domestic partners that already hold coveted compliance certificates.
Strategic differentiation centers on technology adoption and compliance depth. Operators investing early in liquid-cooling expertise, direct-current power buses, and AI-driven facility management secure double-digit pricing premiums and lower churn rates. For example, GDS’s Shanghai complex achieves a PUE of 1.12, reducing power costs by 20% and enabling the operator to share savings with tenants while maintaining margins. Meanwhile, Tencent and Alibaba’s self-built programs emphasize vertical integration, controlling everything from fiber trenching to GPU inventory, thus mitigating export-restriction risk and time-to-deploy bottlenecks.
Smaller regional players pivot toward edge-specialized offers, bundling managed services such as unattended operations and predictive maintenance. Although export restrictions on advanced GPUs impose procurement delays, operators with multivendor pipelines cushion the impact, whereas greenfield entrants lacking such relationships face nine-month lead times. Overall, competition coalesces around the ability to secure green power, comply with tightening PUE thresholds, and offer AI-ready density, factors that collectively define success in the China data center market.
China Data Center Industry Leaders
-
Chindata Group Holdings Ltd
-
Alibaba Cloud
-
Global Data Solutions Co., Ltd. (GDS)
-
Huawei Cloud Computing Technologies Co., Ltd
-
Space DC Pte Ltd
- *Disclaimer: Major Players sorted in no particular order

Recent Industry Developments
- March 2025: China's National Development and Reform Commission launched the "Eastern Data, Western Computing" strategy, directing hyperscale data centers to western hubs like Inner Mongolia, Gansu, Guizhou, and Ningxia to boost energy efficiency and renewable energy use.
- January 2025: China's Ministry of Industry and Information Technology now requires large data centers to maintain a PUE below 1.3 and use at least 30% renewable energy in eastern regions.
- November 2024: Alibaba Cloud has expanded its availability zones in China with AI-ready infrastructure, featuring enhanced GPU capacities and liquid cooling systems to support large language model training and inference workloads.
- September 2024: Tencent upgraded its data centers with advanced liquid cooling systems, supporting GPU clusters over 50 kW per rack, enhancing AI infrastructure and energy efficiency.


China Data Center Market Report Scope
The China Data Center Market refers to the infrastructure and facilities used to house computer systems and associated components, such as telecommunications and storage systems, within China. It encompasses various types of data centers, including hyperscale, enterprise, and colocation, catering to diverse end-user industries. The market is segmented by Hotspot, covering regions such as Beijing, Guangdong, Hebei, Jiangsu, and Shanghai.
The China Data Center Market Report is Segmented by Data Center Size (Large, Massive, Medium, Mega, and Small), Tier Type (Tier 1 and 2, Tier 3, and Tier 4), Data Center Type (Hyperscale/Self-Built, and Enterprise/Edge, and Colocation), End User (BFSI, IT and ITES, E-Commerce, Government, Manufacturing, Media and Entertainment, Telecom, and Other End Users), and Hotspot. The Market Forecasts are Provided in Terms of IT Load Capacity (MW).
By Data Center Size
| Large |
| Massive |
| Medium |
| Mega |
| Small |
By Tier Standard
| Tier 1 and 2 |
| Tier 3 |
| Tier 4 |
By Data Center Type
| Hyperscale/Self-built | ||
| Enterprise/Edge | ||
| Colocation | Non-Utilized | |
| Utilized | Retail Colocation | |
| Wholesale Colocation | ||
By End User Industry
| BFSI |
| IT and ITES |
| E-Commerce |
| Government |
| Manufacturing |
| Media and Entertainment |
| Telecom |
| Other End User Industries |
By Hotspot
| Beijing |
| Weinan |
| Huai'an city |
| Rest of China |
| By Data Center Size | Large | ||
| Massive | |||
| Medium | |||
| Mega | |||
| Small | |||
| By Tier Standard | Tier 1 and 2 | ||
| Tier 3 | |||
| Tier 4 | |||
| By Data Center Type | Hyperscale/Self-built | ||
| Enterprise/Edge | |||
| Colocation | Non-Utilized | ||
| Utilized | Retail Colocation | ||
| Wholesale Colocation | |||
| By End User Industry | BFSI | ||
| IT and ITES | |||
| E-Commerce | |||
| Government | |||
| Manufacturing | |||
| Media and Entertainment | |||
| Telecom | |||
| Other End User Industries | |||
| By Hotspot | Beijing | ||
| Weinan | |||
| Huai'an city | |||
| Rest of China | |||


Key Questions Answered in the Report
What is the current China Data Center Market size?
The China data center market is projected to grow in IT load capacity from 7.46 thousand megawatts in 2026 to 9.87 thousand megawatts by 2031, marking a CAGR of 5.76% during the forecast period from 2026 to 2031.
Who are the key players in China Data Center Market?
China Telecom Corporation Ltd, Equinix Inc., GLP Pte Limited, Keppel DC REIT Management Pte. Ltd and Princeton Digital Group are the major companies operating in the China Data Center Market.
Which segment has the biggest share in the China Data Center Market?
In the China Data Center Market, the Tier 3 segment accounts for the largest share by data center type.
Which is the fastest growing segment in the China Data Center Market?
The BFSI segment accounts for the fastest growing by end-user industry in the China Data Center Market.
Page last updated on:


