Market Overview
| Study Period | 2018 - 2031 |
|---|---|
| Forecast Data Period | 2026 - 2031 |
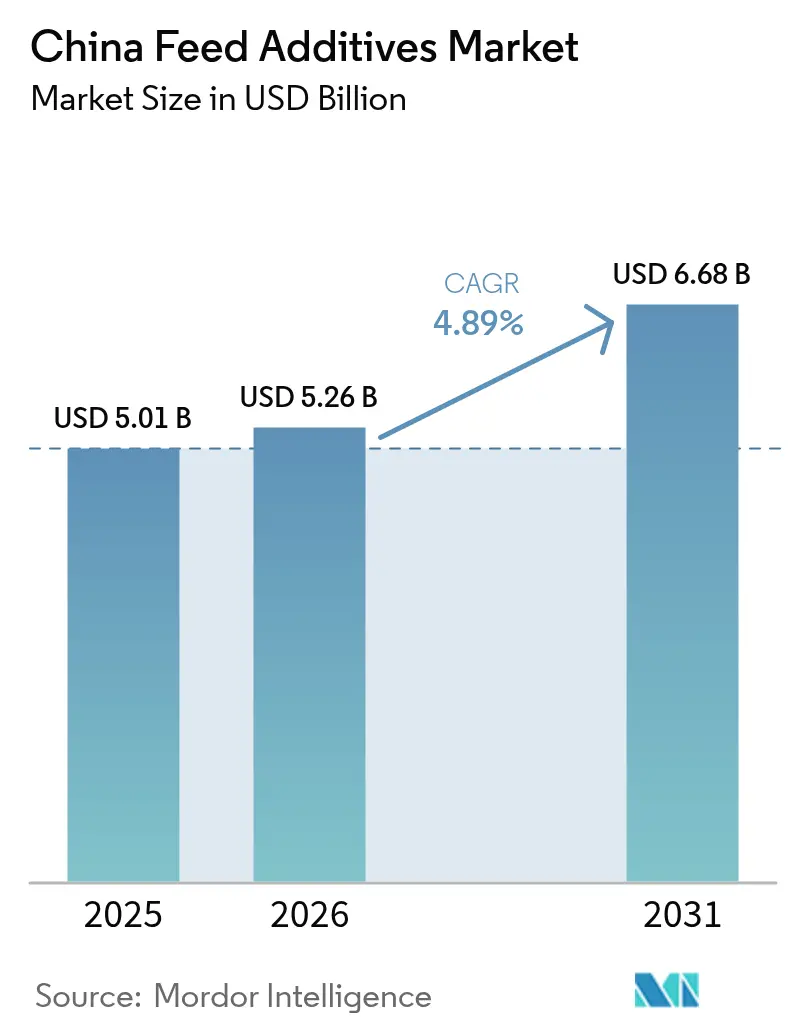
| Base Year Market Size (2025) | USD 5.01 Billion |
| Market Size (2026) | USD 5.26 Billion |
| Market Size (2031) | USD 6.68 Billion |
| Growth Rate (2026 - 2031) | 4.89% CAGR |
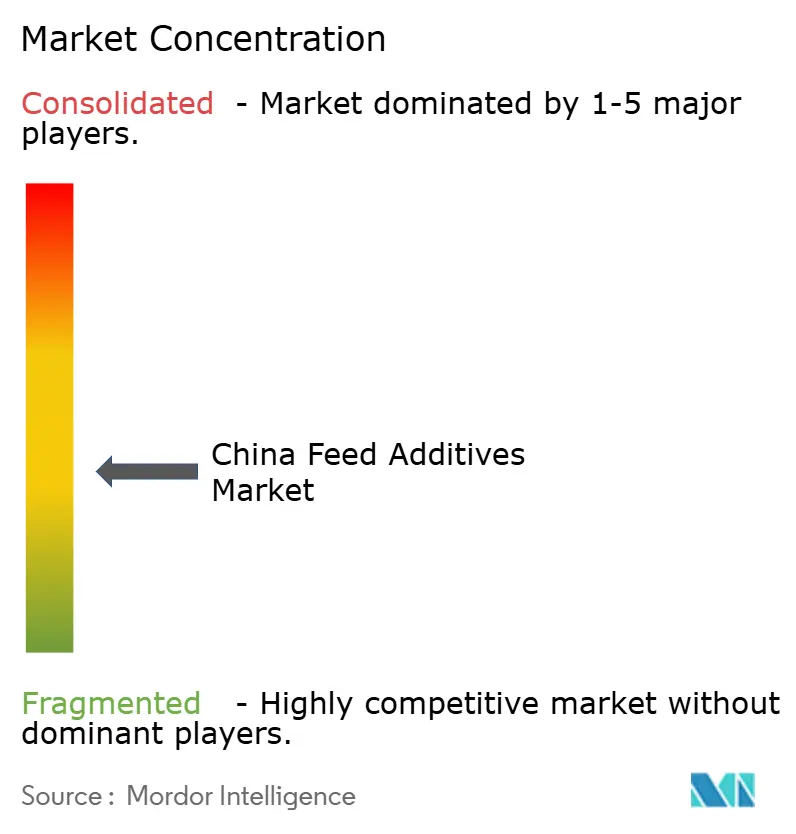
| Market Concentration | Medium |
Major Players *Disclaimer: Major Players sorted in no particular order Image © Mordor Intelligence. Reuse requires attribution under CC BY 4.0. | |
China Feed Additives Market Analysis by Mordor Intelligence
The China feed additives market size was valued at USD 5.01 billion in 2025 and estimated to grow from USD 5.26 billion in 2026 to reach USD 6.68 billion by 2031, at a CAGR of 4.89% during the forecast period (2026-2031). Robust livestock intensification, widening aquaculture output, and a decisive policy shift away from routine antibiotics underpin the expansion of the China feed additives market despite volatile raw-material costs and complex regulatory oversight. Widespread adoption of precision-formulation software enables producers to calibrate additive inclusion rates with unprecedented accuracy, thereby supporting better feed conversion ratios and cost efficiency. Structural emphasis on soy-meal substitution is steering demand toward synthetic amino acids and enzyme blends that unlock alternative protein sources. Concurrently, sustainability goals, including lower greenhouse-gas footprints and circular-economy mandates, continue to elevate functional additives targeting waste valorization, gut health, and shelf-life extension across the China feed additives market.
Key Report Takeaways
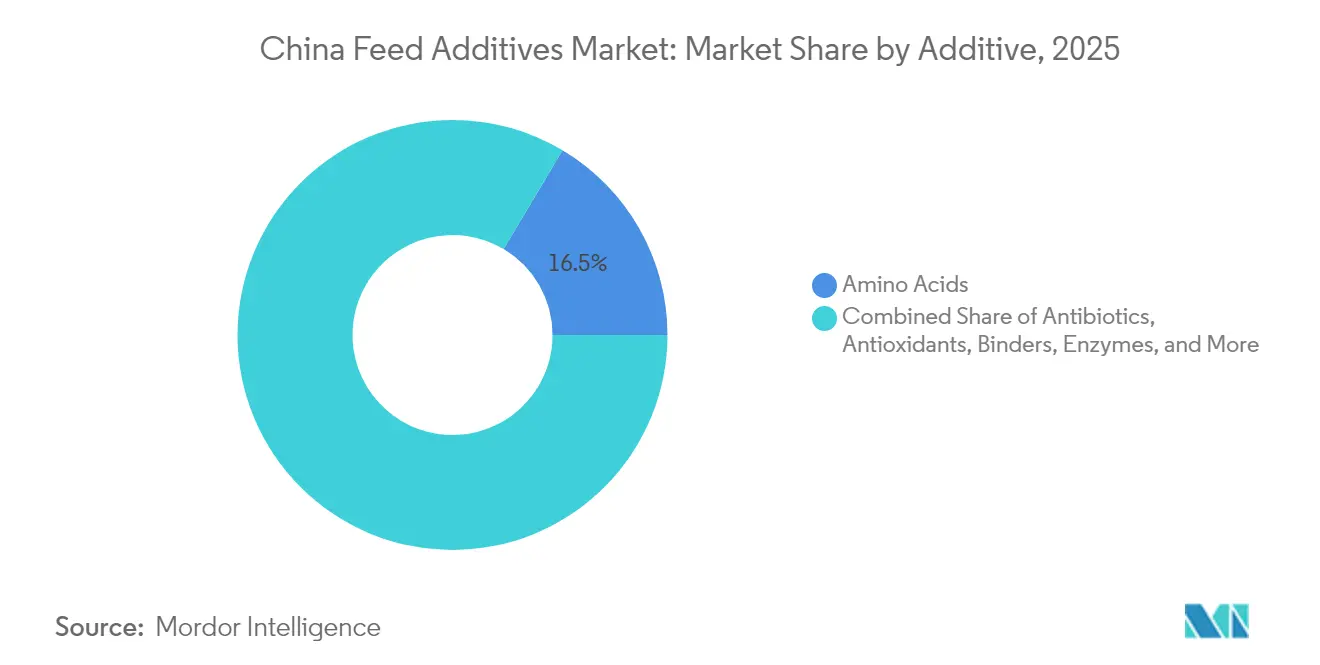
- By additive type, amino acids captured 16.45% of the China feed additives market share in 2025, while antioxidants are forecast to expand at a 5.46% CAGR to 2031.
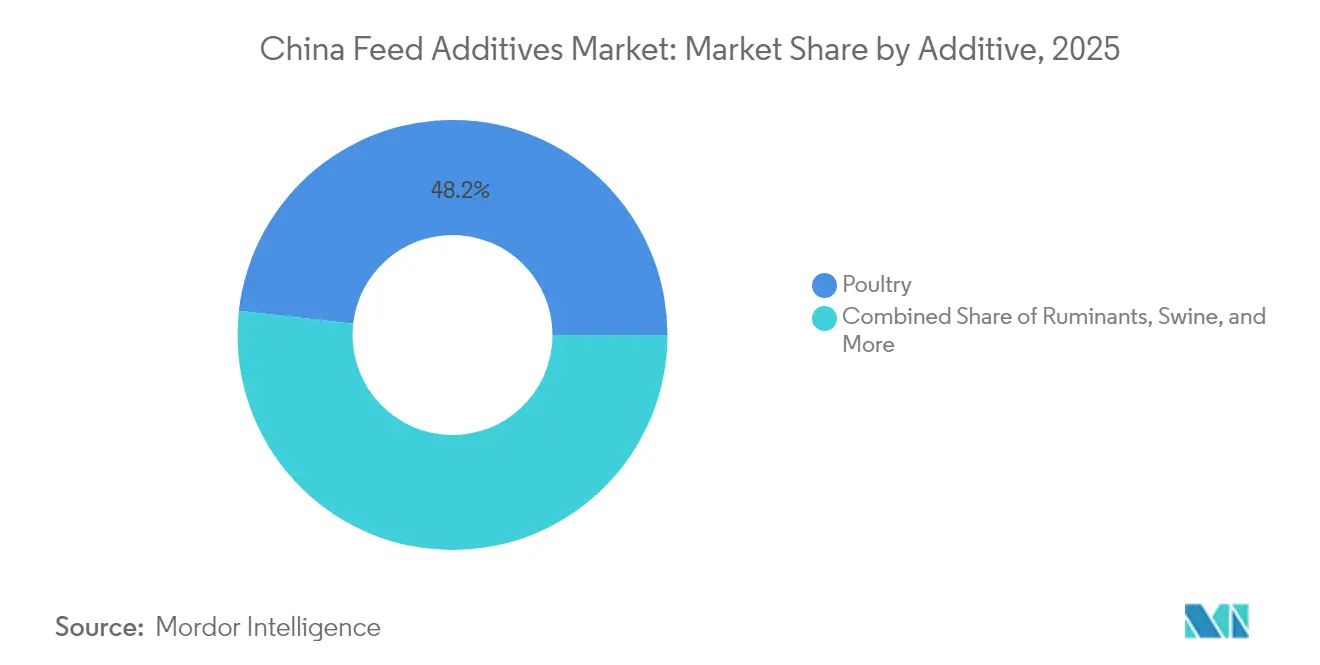
- By animal segment, poultry held 48.20% of the China feed additives market size in 2025, while the “Other Animals” category is advancing at a 5.86% CAGR through 2031.
Note: Market size and forecast figures in this report are generated using Mordor Intelligence’s proprietary estimation framework, updated with the latest available data and insights as of 2026.
China Feed Additives Market Trends and Insights
Drivers Impact Analysis*
| Driver | ( ~ )% Impact on CAGR Forecast | Geographic Relevance | Impact Timeline |
|---|---|---|---|
| Rising meat and dairy demand in China | +1.2% | National, strongest in eastern provinces | Medium term (2-4 years) |
| National ban on antibiotic growth promoters | +0.8% | Nationwide, higher in intensive livestock clusters | Short term (≤ 2 years) |
| Aquaculture expansion driving specialty additive uptake | +0.6% | Coastal provinces—Guangdong, Fujian, Shandong | Medium term (2-4 years) |
| Soy-meal reduction policy catalyzing amino-acid demand | +0.7% | National, especially Northeast grain belt | Long term (≥ 4 years) |
| Precision-nutrition software boosting additive inclusion | +0.4% | Eastern provinces with advanced feed mills | Long term (≥ 4 years) |
| Enzyme blends enabling valorization of tea-residue feeds | +0.3% | Tea-producing regions: Zhejiang, Fujian, Yunnan | Medium term (2-4 years) |
| Source: Mordor Intelligence | |||
Rising meat and dairy demand in China
Per-capita protein consumption continues its steady climb, encouraging a migration from backyard farming to large-scale commercial operations that demand precise nutritional strategies. Livestock integrators increasingly deploy compound feeds fortified with performance enhancers that improve weight-gain trajectories and reduce time to market. These intensification dynamics directly elevate volumes within the China feed additives market, especially for enzymes that boost nutrient digestibility and probiotics that maintain gut integrity under high-density housing. Investment in automated climate-control and real-time production analytics further strengthens the case for additive-driven productivity gains, reinforcing a virtuous cycle of higher throughput and additive uptake.
National ban on antibiotic growth promoters
The full implementation of the Ministry of Agriculture and Rural Affairs (MARA) Announcement No. 194 in 2021 outlawed routine antibiotic growth promoters and fundamentally reshaped demand patterns across the China feed additives market. Probiotic strains such as Bacillus subtilis DE111, cleared for poultry and swine in 2024, have emerged as scalable replacements that aid immune modulation and pathogen control.[1]Source: Archer-Daniels-Midland Company, “ADM’s DE111 Gut Health Probiotic Approved by the National Health Commission (NHC) in China,” adm.com Phytogenic compounds, eugenol, carvacrol, and thymol, have gained regulatory traction owing to their broad-spectrum antimicrobial properties and consumer perception of “clean-label” animal products. Formulators now position gut-health platforms as core nutritional pillars rather than optional enhancements, spawning a wave of R&D around synbiotic and postbiotic concepts.
Aquaculture expansion driving specialty additive uptake
China remains the world’s largest aquaculture producer, and output growth is intensifying demand for water-stable, species-specific additive programs. The 2024 clearance of Calysta’s single-cell protein for fish and shrimp feeds validated the regulatory path for novel marine ingredients.[2]Source: Global Seafood Alliance, “China approves the use of Calysta’s alternative protein in aquaculture feeds,” globalseafood.org Farmers pursuing higher stocking densities rely on functional additives such as immune-stimulatory beta-glucans, nitrogen-scavenging probiotics, and enzyme cocktails to limit water quality degradation and support feed conversion efficiency. These product classes now represent one of the fastest-scaling niches within the broader China feed additives market.
Soy-meal reduction policy catalyzing amino-acid demand
China’s national blueprint to lower soybean-meal inclusion across animal rations is reshaping protein-formulation paradigms and elevating demand for lysine, methionine, and threonine. Government projections show domestic soybean self-sufficiency potentially rising to 24.68% by 2030, but the residual import gap still compels feed manufacturers to substitute synthetic amino acids for intact soy protein. The flexibility of crystalline amino acids enables formulators to fine-tune diets, meet essential amino-acid ratios, and reduce nitrogen excretion, dovetailing with the country’s environmental objectives. Consequently, amino acids have consolidated their leadership position in the China feed additives market and remain a cornerstone of protein-efficient ration design.
Restraints Impact Analysis*
| Restraint | (~) % Impact on CAGR Forecast | Geographic Relevance | Impact Timeline |
|---|---|---|---|
| Volatile corn and fermentation input prices | –0.9% | Nationwide, pronounced in Northeast corn belt | Short term (≤ 2 years) |
| Stringent MARA registration and renewal costs | –0.5% | National, impacts all manufacturers | Medium term (2-4 years) |
| EU/Brazil anti-dumping duties on Chinese amino acids | –0.6% | Export-oriented provinces: Shandong, Jiangsu | Long term (≥ 4 years) |
| Industry consolidation squeezing small premixers | –0.4% | Regional, centered in traditional manufacturing hubs | Medium term (2-4 years) |
| Source: Mordor Intelligence | |||
Volatile corn and fermentation input prices
Corn-derived substrates dominate fermentation processes for amino acids, vitamins, and organic acids. Fluctuating domestic corn prices introduce material cost risk, compelling producers to explore alternative carbohydrate sources such as wheat off-grade flour or cassava. Energy-intensive fermentation also faces upward pressure from China’s dual-carbon targets that favor greener but costlier utilities. Margin compression is most acute for small and mid-sized producers lacking process-intensification investments, potentially prompting further consolidation within the China feed additives industry.
Stringent MARA registration and renewal costs
MARA maintains rigorous data-submission requirements covering efficacy, toxicology, and residue depletion before a new additive or new use can be registered. Parallel facility certification under the General Administration of Customs of China (GACC) Decree 248 extends compliance obligations to imported additives and upstream intermediates.[3]Source: European Commission, “The Food and Beverage Market Entry Handbook: China,” europa.eu These multi-layered approvals lengthen commercial timelines and increase working-capital needs, tightening the gate for start-ups and novel technology entrants. Well-capitalized incumbents therefore secure a structural advantage, even as the rulebook continues to evolve toward greater transparency and traceability across the China feed additives market.
*Our forecasts treat driver/restraint impacts as directional, not additive. The impact forecasts reflect baseline growth, mix effects, and variable interactions.
Segment Analysis
By Additive: Amino Acids Lead While Antioxidants Accelerate
Amino acids commanded 16.45% of the China feed additives market share in 2025, reflecting deep manufacturing know-how, extensive domestic capacity, and policy-driven incentives to reduce soybean-meal dependence. Continuous-fermentation upgrades, membrane filtration, and process-integration projects have lowered unit costs, enabling competitive export as well as domestic penetration. Vitamins remain a mainstay for multispecies nutrition, though price volatility linked to fermentation inputs encourages ration optimization. Antioxidants, projected to advance at a 5.46% CAGR to 2031, are benefiting from heightened focus on oxidative-stress mitigation and shelf-life extension amid expanded cold-chain logistics. Enzymes gain traction by unlocking fiber-bound nutrients in novel feedstuffs, including distillers' grains and single-cell proteins. The China feed additives market size for phytogenic solutions is widening in concert with consumer preferences for “natural” meat and dairy products.
Probiotics and postbiotics mark the frontier of functional nutrition, underpinned by high-throughput screening of host-specific strains and next-generation sequencing to chart microbiome shifts. Mycotoxin binders preserve ration safety in humid southern provinces, while pigment markets remain concentrated in carotenoids for layer-hen yolk coloration and astaxanthin for aquaculture species. Acidifiers support pathogen suppression and gut-mucosa integrity, especially in antibiotic-free programs. Across categories, precision-inclusion algorithms embedded in feed-mill software ensure that each micro-ingredient is dosed to its marginal return, preserving the momentum of the China feed additives market.


By Animal: Poultry Dominance Amid Diversification Trends
Poultry accounted for 48.20% of the China feed additives market size in 2025, leveraging vertically integrated supply chains, standardized genetics, and tight biosecurity protocols that facilitate consistent additive adoption. Broiler producers prioritize coccidiosis management and rapid weight gain, fueling demand for coccidiostats, ionophores alternatives, and digestive enzymes. Layer operations depend on vitamin D and organic trace minerals to sustain shell integrity, while duck and goose segments explore phytogenics for flavor modulation in finished meat.
The “Other Animals” category, including pets, insects, and emerging livestock such as deer and bamboo rats, posts the fastest trajectory at 5.86% CAGR. Premium positioning and specialized husbandry practices allow additive suppliers to command higher margins in these niches. Swine production, recovering from the African Swine Fever trough, prioritizes immune-supporting additives, zinc-reduction strategies, and gut-barrier fortifiers to stabilize weaning transitions. Ruminant formulations emphasize rumen-protected amino acids and methane-mitigation additives that align with climate pledges. Aquaculture diets require water-stable pellets and protected vitamins that withstand extrusion, strengthening the diversity of demand drivers across the China feed additives market.
Geography Analysis
Regional dynamics shape access to raw materials, logistics, and end-user clusters across the China feed additives market. Shandong Province hosts an extensive amino-acid corridor anchored by methionine, lysine, and threonine facilities that benefit from port-based grain imports and dense poultry populations. The province’s Linyi region alone sustains 4.78 million pigs and 1.7 billion birds, creating a self-reinforcing ecosystem of feed mills, premixers, and additive vendors.
Heilongjiang and neighboring Northeast provinces contribute 46.95% of national soybean output in 2024, offering a localized supply base for oilseed co-products and facilitating integrated crush-to-feed operations. Harsh winters necessitate additives that bolster immunity and energy density, including rumen-bypass fats and selenium yeast. Southern coastal provinces, Guangdong, Fujian, and Zhejiang, function as aquaculture innovation hubs, hosting pilot trials for single-cell proteins and water-quality probiotics approved in 2024. Their proximity to Southeast Asian markets also supports additive exports and collaborative R&D projects with regional institutes. Collectively, these regional specializations emphasize that no single supply node can serve the multifaceted China feed additives market, compelling manufacturers to adopt distributed production and distribution strategies.
Competitive Landscape
The top five suppliers occupy a significant share of the Chinese feed additives market, underscoring a moderate concentration that still leaves room for nimble specialists. Adisseo (Bluestar) leads at 11.3%, buoyed by a methionine expansion in Fujian that adds 150,000 metric tons of annual capacity. Evonik Industries AG deepened its Asia presence through a Qingdao joint venture with Vland Biotech that commenced amino-acid output in January 2024, highlighting cooperative pathways to serve regional demand.
BASF leverages integrated Verbund sites to co-produce vitamins, organic acids, and enzymes, bundling solutions for large feed integrators. Technological differentiation is emerging as the prime competitive lever. CO₂-derived single-cell protein, approved by MARA in July 2025, exemplifies a new class of low-impact functional ingredients.
Companies armed with proprietary strains and downstream processing IP secure entry barriers that elevate value capture within the China feed additives market. Regulatory mastery is equally pivotal; firms with robust dossiers and compliant facilities fast-track product releases, while laggards incur costly re-qualification cycles. As sustainability reporting becomes mandatory, carbon-footprint and water-intensity metrics may further stratify market positions.
China Feed Additives Industry Leaders
Adisseo (Bluestar)
Nutreco (SHV Holdings NV)
Cargill, Incorporated.
BASF
DSM-Firmenich
- *Disclaimer: Major Players sorted in no particular order

Recent Industry Developments
- July 2025: The Ministry of Agriculture and Rural Affairs in China revised its approved feed and feed additive catalog, implementing enhanced safety standards and simplified regulatory oversight. The update encompasses new feed additive approvals and provides detailed usage specifications for previously approved additives.
- January 2024: Evonik and Qingdao Vland Biotech established a joint venture in China to produce probiotics and gut health feed additives for livestock and aquaculture. The joint venture focuses on developing sustainable animal nutrition solutions and reducing the use of antibiotic growth promoters.
- January 2024: The Ministry of Agriculture and Rural Affairs (MARA) in China has approved Calysta's FeedKind protein for use in aquaculture feeds. The single-cell protein, produced through gas fermentation, represents a significant advancement in sustainable protein alternatives for China's aquaculture sector.


China Feed Additives Market Report Scope
Acidifiers, Amino Acids, Antibiotics, Antioxidants, Binders, Enzymes, Flavors & Sweeteners, Minerals, Mycotoxin Detoxifiers, Phytogenics, Pigments, Prebiotics, Probiotics, Vitamins, Yeast are covered as segments by Additive. Aquaculture, Poultry, Ruminants, Swine are covered as segments by Animal.By Additive
| Acidifiers | Fumaric Acid |
| Lactic Acid | |
| Propionic Acid | |
| Other Acidifiers | |
| Amino Acids | Lysine |
| Methionine | |
| Threonine | |
| Tryptophan | |
| Other Amino Acids | |
| Antibiotics | Bacitracin |
| Penicillins | |
| Tetracyclines | |
| Tylosin | |
| Other Antibiotics | |
| Antioxidants | Butylated Hydroxyanisole (BHA) |
| Butylated Hydroxytoluene (BHT) | |
| Citric Acid | |
| Ethoxyquin | |
| Propyl Gallate | |
| Tocopherols | |
| Other Antioxidants | |
| Binders | Natural Binders |
| Synthetic Binders | |
| Enzymes | Carbohydrases |
| Phytases | |
| Other Enzymes | |
| Flavors and Sweeteners | Flavors |
| Sweeteners | |
| Minerals | Macrominerals |
| Microminerals | |
| Mycotoxin Detoxifiers | Binders |
| Biotransformers | |
| Other Mycotoxin Detoxifiers | |
| Phytogenics | Essential Oil |
| Herbs and Spices | |
| Other Phytogenics | |
| Pigments | Carotenoids |
| Curcumin and Spirulina | |
| Prebiotics | Fructo Oligosaccharides |
| Galacto Oligosaccharides | |
| Inulin | |
| Lactulose | |
| Mannan Oligosaccharides | |
| Xylo Oligosaccharides | |
| Other Prebiotics | |
| Probiotics | Bifidobacteria |
| Enterococcus | |
| Lactobacilli | |
| Pediococcus | |
| Streptococcus | |
| Other Probiotics | |
| Vitamins | Vitamin A |
| Vitamin B | |
| Vitamin C | |
| Vitamin E | |
| Other Vitamins | |
| Yeast | Live Yeast |
| Selenium Yeast | |
| Spent Yeast | |
| Torula Dried Yeast | |
| Whey Yeast | |
| Yeast Derivatives |
By Animal
| Aquaculture | Fish |
| Shrimp | |
| Other Aquaculture Species | |
| Poultry | Broiler |
| Layer | |
| Other Poultry Birds | |
| Ruminants | Beef Cattle |
| Dairy Cattle | |
| Other Ruminants | |
| Swine | |
| Other Animals |
| By Additive | Acidifiers | Fumaric Acid |
| Lactic Acid | ||
| Propionic Acid | ||
| Other Acidifiers | ||
| Amino Acids | Lysine | |
| Methionine | ||
| Threonine | ||
| Tryptophan | ||
| Other Amino Acids | ||
| Antibiotics | Bacitracin | |
| Penicillins | ||
| Tetracyclines | ||
| Tylosin | ||
| Other Antibiotics | ||
| Antioxidants | Butylated Hydroxyanisole (BHA) | |
| Butylated Hydroxytoluene (BHT) | ||
| Citric Acid | ||
| Ethoxyquin | ||
| Propyl Gallate | ||
| Tocopherols | ||
| Other Antioxidants | ||
| Binders | Natural Binders | |
| Synthetic Binders | ||
| Enzymes | Carbohydrases | |
| Phytases | ||
| Other Enzymes | ||
| Flavors and Sweeteners | Flavors | |
| Sweeteners | ||
| Minerals | Macrominerals | |
| Microminerals | ||
| Mycotoxin Detoxifiers | Binders | |
| Biotransformers | ||
| Other Mycotoxin Detoxifiers | ||
| Phytogenics | Essential Oil | |
| Herbs and Spices | ||
| Other Phytogenics | ||
| Pigments | Carotenoids | |
| Curcumin and Spirulina | ||
| Prebiotics | Fructo Oligosaccharides | |
| Galacto Oligosaccharides | ||
| Inulin | ||
| Lactulose | ||
| Mannan Oligosaccharides | ||
| Xylo Oligosaccharides | ||
| Other Prebiotics | ||
| Probiotics | Bifidobacteria | |
| Enterococcus | ||
| Lactobacilli | ||
| Pediococcus | ||
| Streptococcus | ||
| Other Probiotics | ||
| Vitamins | Vitamin A | |
| Vitamin B | ||
| Vitamin C | ||
| Vitamin E | ||
| Other Vitamins | ||
| Yeast | Live Yeast | |
| Selenium Yeast | ||
| Spent Yeast | ||
| Torula Dried Yeast | ||
| Whey Yeast | ||
| Yeast Derivatives | ||
| By Animal | Aquaculture | Fish |
| Shrimp | ||
| Other Aquaculture Species | ||
| Poultry | Broiler | |
| Layer | ||
| Other Poultry Birds | ||
| Ruminants | Beef Cattle | |
| Dairy Cattle | ||
| Other Ruminants | ||
| Swine | ||
| Other Animals | ||


Market Definition
- FUNCTIONS - For the study, feed additives are considered to be commercially manufactured products that are used to enhance characteristics such as weight gain, feed conversion ratio, and feed intake when fed in appropriate proportions.
- RESELLERS - Companies engaged in reselling feed additives without value addition have been excluded from the market scope, to avoid double counting.
- END CONSUMERS - Compound feed manufacturers are considered to be end-consumers in the market studied. The scope excludes farmers buying feed additives to be used directly as supplements or premixes.
- INTERNAL COMPANY CONSUMPTION - Companies engaged in the production of compound feed as well as the manufacturing of feed additives are part of the study. However, while estimating the market sizes, the internal consumption of feed additives by such companies has been excluded.
| Keyword | Definition |
|---|---|
| Feed additives | Feed additives are products used in animal nutrition for purposes of improving the quality of feed and the quality of food from animal origin, or to improve the animals’ performance and health. |
| Probiotics | Probiotics are microorganisms introduced into the body for their beneficial qualities. (It maintains or restores beneficial bacteria to the gut). |
| Antibiotics | Antibiotic is a drug that is specifically used to inhibit the growth of bacteria. |
| Prebiotics | A non-digestible food ingredient that promotes the growth of beneficial microorganisms in the intestines. |
| Antioxidants | Antioxidants are compounds that inhibit oxidation, a chemical reaction that produces free radicals. |
| Phytogenics | Phytogenics are a group of natural and non-antibiotic growth promoters derived from herbs, spices, essential oils, and oleoresins. |
| Vitamins | Vitamins are organic compounds, which are required for normal growth and maintenance of the body. |
| Metabolism | A chemical process that occurs within a living organism in order to maintain life. |
| Amino acids | Amino acids are the building blocks of proteins and play an important role in metabolic pathways. |
| Enzymes | Enzyme is a substance that acts as a catalyst to bring about a specific biochemical reaction. |
| Anti-microbial resistance | The ability of a microorganism to resist the effects of an antimicrobial agent. |
| Anti-microbial | Destroying or inhibiting the growth of microorganisms. |
| Osmotic balance | It is a process of maintaining salt and water balance across membranes within the body's fluids. |
| Bacteriocin | Bacteriocins are the toxins produced by bacteria to inhibit the growth of similar or closely related bacterial strains. |
| Biohydrogenation | It is a process that occurs in the rumen of an animal in which bacteria convert unsaturated fatty acids (USFA) to saturated fatty acids (SFA). |
| Oxidative rancidity | It is a reaction of fatty acids with oxygen, which generally causes unpleasant odors in animals. To prevent these, antioxidants were added. |
| Mycotoxicosis | Any condition or disease caused by fungal toxins, mainly due to contamination of animal feed with mycotoxins. |
| Mycotoxins | Mycotoxins are toxin compounds that are naturally produced by certain types of molds (fungi). |
| Feed Probiotics | Microbial feed supplements positively affect gastrointestinal microbial balance. |
| Probiotic yeast | Feed yeast (single-cell fungi) and other fungi used as probiotics. |
| Feed enzymes | They are used to supplement digestive enzymes in an animal’s stomach to break down food. Enzymes also ensure that meat and egg production is improved. |
| Mycotoxin detoxifiers | They are used to prevent fungal growth and to stop any harmful mold from being absorbed in the gut and blood. |
| Feed antibiotics | They are used both for the prevention and treatment of diseases but also for rapid growth and development. |
| Feed antioxidants | They are used to protect the deterioration of other feed nutrients in the feed such as fats, vitamins, pigments, and flavoring agents, thus providing nutrient security to the animals. |
| Feed phytogenics | Phytogenics are natural substances, added to livestock feed to promote growth, aid in digestion, and act as anti-microbial agents. |
| Feed vitamins | They are used to maintain the normal physiological function and normal growth and development of animals. |
| Feed flavors and sweetners | These flavors and sweeteners help to mask tastes and odors during changes in additives or medications and make them ideal for animal diets undergoing transition. |
| Feed acidifiers | Animal feed acidifiers are organic acids incorporated into the feed for nutritional or preservative purposes. Acidifiers enhance congestion and microbiological balance in the alimentary and digestive tracts of livestock. |
| Feed minerals | Feed minerals play an important role in the regular dietary requirements of animal feed. |
| Feed binders | Feed binders are the binding agents used in the manufacture of safe animal feed products. It enhances the taste of food and prolongs the storage period of the feed. |
| Key Terms | Abbreviation |
| LSDV | Lumpy Skin Disease Virus |
| ASF | African Swine Fever |
| GPA | Growth Promoter Antibiotics |
| NSP | Non-Starch Polysaccharides |
| PUFA | Polyunsaturated Fatty Acid |
| Afs | Aflatoxins |
| AGP | Antibiotic Growth Promoters |
| FAO | The Food And Agriculture Organization of the United Nations |
| USDA | The United States Department of Agriculture |


Research Methodology
Mordor Intelligence follows a four-step methodology in all our reports.
- Step-1: IDENTIFY KEY VARIABLES: In order to build a robust forecasting methodology, the variables and factors identified in Step-1 are tested against available historical market numbers. Through an iterative process, the variables required for market forecast are set and the model is built on the basis of these variables.
- Step-2: Build a Market Model: Market-size estimations for the forecast years are in nominal terms. Inflation is not a part of the pricing, and the average selling price (ASP) is kept constant throughout the forecast period.
- Step-3: Validate and Finalize: In this important step, all market numbers, variables and analyst calls are validated through an extensive network of primary research experts from the market studied. The respondents are selected across levels and functions to generate a holistic picture of the market studied.
- Step-4: Research Outputs: Syndicated Reports, Custom Consulting Assignments, Databases & Subscription Platforms


